25 Penview Dr Unit PE25 · St. John Fisher College, NY
Flood risk 1/10 · Minimal
- FEMA flood zone
- X (unshaded)
- Chance of flooding over 30 yrs
- 0.0%
- Est. flood insurance / yr
- $507 – $1,088
Fire risk 1/10 · Minimal
- Est. fire insurance / yr
- $691 – $1,283
Heat risk 2/10 · Minimal
- Hot days now (above 95°F)
- 7 days/yr
- Hot days in 30 yrs
- 15 days/yr
Wind risk 1/10 · Minimal
- Chance of severe wind over 30 yrs
- —
Air-quality risk 2/10 · Minimal
- Unhealthy air days now
- 1 days/yr
- Unhealthy air days in 30 yrs
- 2 days/yr
Risk factors via First Street. Map © Google.
Why this score? — see what drove the B grade
The composite is a weighted blend of 9 inputs, each scored 0–100. Each bar is that input's sub-score; the figure is the points it added to the 100-point composite (weight × sub-score).
- Cash flow +30.0/30.0
- 1% rule +10.0/10.0
- DSCR +10.0/10.0
- ARV discount +7.5/15.0
- Schools +6.8/10.0
- Rent growth +2.5/5.0
- Livability +2.5/5.0
- Condition / age +2.2/5.0
- Appreciation +0.0/10.0
$106,900
🖨 Deal sheet 📄 Offer letter ✓ Due diligence
Listing remarks
Unlock the Door to Your Dream Home! Call to Schedule Your Tour Today or SELF TOUR THIS HOME ON YOUR OWN SCHEDULE!
Key facts
- Built 2026
- Listed 35 days
Property features AI
Finance
- Financial info: List price $106,900
Exterior
- Home design: Spec inventory — Concord plan
Interior
- Bedrooms: 2 bedrooms
- Bathrooms: 2 bathrooms
- Interior features: Living area approximately 864
Neighborhood map
What this means for you Summary
Snapshot
- This is a 2-bed/2.0-bath manufactured listed at $107k. Condition is rated fair.
Deal economics
- At list price, monthly cash flow is $1k ($13k/yr) — positive.
- The deal already cash-flows at list — no discount required.
- Meets the 1% rule at list price ($2k rent vs $107k).
- Recommended offer: $104k (3.0% below list) — sets the bar for market timing.
Location & tenants
- Location reads: area grade B — affects rentability + tenant quality, not the cash-flow math above.
- Penfield Central School District (suburban): math 77% / reading 79% proficiency, ranked #67 of 590 in NY (top 11%) — strong family-tenant draw, lease renewals of 3-5y typical; only 11% free/reduced lunch — higher-income household profile.
- Market conditions: 63 active listings in the ZIP; 5 comparable units currently listed for rent nearby; rentals leasing fast (median 3d on market — plan ~1-2 weeks tenant-placement turnaround); 1,169 units permitted in Monroe County in 2024 (591 in 5+ unit buildings).
Forward outlook
- Local home prices are declining (-3.0%/yr); year-one equity from $739 of loan paydown is wiped out by about $3k of value loss. Plan a longer hold.
- Monroe County population projected to shrink 6% by 2050 — rents likely to lag national; underwrite the cash flow, not the appreciation.
- At projected returns (-3.0% appreciation + 3.0% rent growth), your $30k cash investment doubles in ~3 years — after that, you're playing with house money.
Negotiation context
- It's been on market 35 days — a 3% lower offer ($104k) is reasonable based on typical stale-listing flexibility.
Questions for the listing agent
- It's been on market 35 days. Have you received any prior offers? Is the seller open to a 3% concession, seller financing, or rate buy-down credit?
- Have any recent inspections been done? Can we get a copy of the seller's disclosures and any deferred-maintenance estimates?
- Is there a deadline driving the sale (1031 exchange, divorce, estate, relocation)? That informs how much negotiation room exists.
- What's the average days-on-market for RENTAL listings here right now (not sales)? A rising rental-DOM trend means longer vacancies and softer asking-rent achievability than the comps imply.
- What's the recent tenant-quality profile in this submarket — average credit score on applications, eviction rate, late-payment / NSF rate, and stable-employment percentage? A property-management company in the area should have these aggregated.
- How much new for-sale + rental construction is in the pipeline within 1–3 miles? Heavy new supply typically softens prices + rents 12–24 months out; constrained supply supports both.
Investment metrics
- 1% rule
- 2.13% ✓
- Cap rate
- 18.19%
- Cash-on-cash
- 42.50%
- DSCR
- 2.89
- GRM
- 3.9
CMA / ARV
- ARV (on-the-fly)
- $70,848
- Comps found
- 12
Show comp detail 12 sales within ~0.75 mi
| Address | Dist | Beds/Ba | Sqft | Sold | Price | $/sf | Match |
|---|---|---|---|---|---|---|---|
| 7 Skyview Dr | 0.07mi | 2/1.0 | 809 (-6%) | 8mo | $10,000 | $12 | 76 |
| 31 Ewald Dr | 0.28mi | 2/1.0 | 853 (-1%) | 8mo | $88,000 | $103 | 75 |
| 36 Wayside Dr | 0.24mi | 2/1.5 | 924 (+7%) | 2mo | $54,900 | $59 | 74 |
| 32 Skyview Dr | 0.07mi | 2/1.5 | 924 (+7%) | 12mo | $75,500 | $82 | 73 |
| 3 Acorn Dr | 0.40mi | 2/1.0 | 872 (+1%) | 4mo | $35,000 | $40 | 73 |
| 27 Ewald Dr | 0.26mi | 2/2.0 | 907 (+5%) | 8mo | $90,000 | $99 | 72 |
| 25 Ewald Dr | 0.26mi | 2/2.0 | 907 (+5%) | 9mo | $88,000 | $97 | 72 |
| 56 Wayside Dr | 0.31mi | 2/1.5 | 896 (+4%) | 8mo | $9,900 | $11 | 71 |
| 25 Patio Dr | 0.12mi | 3/2.0 (+1) | 960 (+11%) | 6mo | $72,500 | $76 | 66 |
| 26 Ewald Dr | 0.23mi | 2/1.0 | 960 (+11%) | 3mo | $113,777 | $119 | 65 |
| 2 Easy St | 0.37mi | 2/1.0 | 980 (+13%) | 3mo | $40,000 | $41 | 54 |
| 7 Mainview Dr | 0.42mi | 3/2.0 (+1) | 950 (+10%) | 12mo | $80,000 | $84 | 49 |
Match score weights: distance 35% · size 25% · config 20% · recency 20%. Top-matched comps best support the ARV.
Projected returns pro-forma
-3.0% appreciation · 3.0% rent growth · sell at horizon
- IRR
- 39.2%
- Equity multiple
- 2.68×
- Total profit
- $50,228
- Equity at exit
- $15,939
- IRR
- 45.7%
- Equity multiple
- 5.37×
- Total profit
- $130,814
- Equity at exit
- $9,243
Cash invested: $29,932 (down + closing). Projections, not guarantees.
Landlord ↔ Tenant lean methodology
- Overall (STATE)
- 15 Strongly Tenant-Friendly
- State New York
- 15 Strongly Tenant-Friendly · D+10
- County
- — inherits STATE
- City
- — inherits STATE
ZIP-level market 14625
- Home prices YoY
- -15.3%
- Active inventory
- 63
- Price-to-rent
- 3.9×
Monthly cashflow live
- Estimated rent
- $2,277 high interval (Pro) →
- Mortgage (P&I)
- −$561
- Tax est. 1.5%
- −$134 /mo · $1,604/yr
- Insurance
- −$45
- HOA
- −$0
- Vacancy / Maint / Mgmt
- −$478
- Net cashflow
- $1,060
Break-even live
UW: 25.0% down · 7.5% · 30yr · 1.5% tax · 5.0% vac · 8.0% maint · 8.0% mgmt
Financing live
Cash to close
- Down payment
- $26,725
- Closing costs
- $3,207
- Reserves months
- —
- Total cash needed
- —
Loan-product check · same deal, 3 products live
Conventional
25% down · 7.5% · 30yr
- Down + closing
- —
- Monthly P&I
- —
- Monthly cashflow
- —
- DSCR
- —
- Eligible?
- —
Personal DTI + credit; lowest rate.
DSCR
20% down · 8.5% · 30yr
- Down + closing
- —
- Monthly P&I
- —
- Monthly cashflow
- —
- DSCR
- —
- Eligible?
- —
No personal income docs; deal must DSCR.
Hard money
10% down · 12.0% · 12mo
- Down + closing
- —
- Monthly P&I
- —
- Monthly cashflow
- —
- DSCR
- —
- Eligible?
- —
Short-term bridge; refi at stabilization.
Rent comps 5 comps
| Address | Beds | Baths | Sqft | Rent | $/sqft | DOM | Units | Dist |
|---|---|---|---|---|---|---|---|---|
| 3540 East Ave Rochester, NY | 1.0–2.0 | 1.0–2.5 | 1261 | $4,123 | $3.27 | 2d | 10 | 0.63mi |
| 18 Brook Hill Ln Rochester, NY | 1.0–2.0 | 1.0–1.5 | 841 | $1,915 | $2.28 | 2d | 1 | 1.03mi |
| 234 W Commercial St Unit 2 East Rochester, NY | 2.0 | 1.0 | 640 | $1,100 | $1.72 | 43d | 1 | 1.18mi |
| 126 West Ave Unit UPPER East Rochester, NY | 2.0 | 1.0 | 820 | $1,500 | $1.83 | 19d | 1 | 1.37mi |
| 108 W Filbert St Unit 2 East Rochester, NY | 2.0 | 1.0 | 1100 | $1,525 | $1.39 | 2d | 1 | 1.46mi |
Listing history 11 events
-
2026-06-18days on market $106,900 Active 35 DOM
-
2026-06-17days on market $106,900 Active 34 DOM
-
2026-06-16days on market $106,900 Active 33 DOM
-
2026-06-15days on market $106,900 Active 32 DOM
-
2026-06-13remarks 113-char remark
-
2026-06-13days on market $106,900 Active 30 DOM
-
2026-06-10days on market $106,900 Active 27 DOM
-
2026-06-09days on market $106,900 Active 26 DOM
-
2026-06-09days on market $106,900 Active 25 DOM
-
2026-06-07remarks 69-char remark
-
2026-06-07$106,900 Active 24 DOM
ⓘ Source: listings_history table (triggers on properties + properties_extension) + one-shot
backfill from property_details.listing_events for pre-trigger history.
Climate risk First Street
- Flood 1/10 Low FEMA zone X (unshaded) · 0% chance over 30 yrs
- Wildfire 1/10 Low
- Heat 2/10 Low 7 d/yr ≥95°F today · 15 d/yr by 30 yrs out
- Wind 1/10 Low
- Air quality 2/10 Low 1 unhealthy d/yr today · 2 by 30 yrs out
Nearby sold comps map
Loading sold comps map…
Walkable amenities ~0.75 mi
Loading nearby amenities…
Taxation est. · year 1
- Rental income
- $27,324
- − Mortgage interest
- −$5,988
- − Property taxes
- −$1,604
- − Insurance
- −$534
- − Repairs & maintenance
- −$2,186
- − Management
- −$2,186
- − Depreciation
- −$3,110
- Taxable income
- $11,716
- Est. tax owed @ 24.0%
- −$2,812
- After-tax cash flow
- $9,909/yr
For passive investors: Depreciation is non-cash, so a rental often shows a tax loss while cash-flowing — sheltering income. Rental losses are passive: they offset passive income freely, and up to $25,000/yr can offset ordinary (W-2) income if you actively participate and your MAGI is under $100k (phasing out to $0 by $150k); unused losses carry forward. On sale, claimed depreciation is recaptured at up to 25%, and gains may owe capital-gains tax (a 1031 exchange can defer both). Figures are a year-1 estimate at your 24.0% rate — not tax advice; consult a CPA.
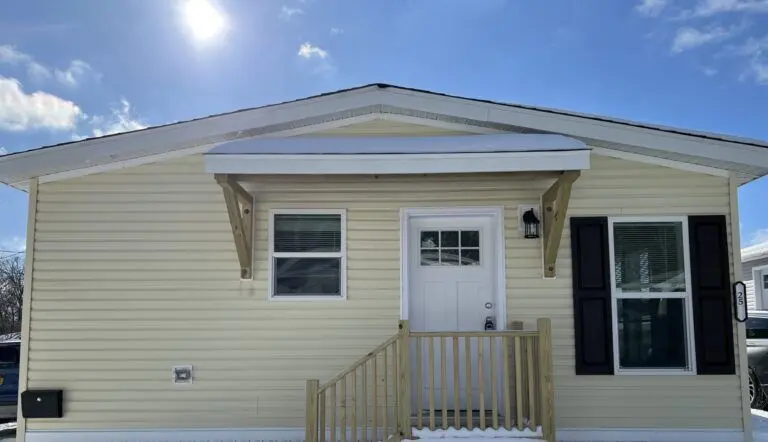
Condition & rehab AI · 2 photos
The home appears to be in good condition with no major repairs needed. However, painting the exterior and making some interior updates could significantly increase its value.
Value-add opportunities
- Both Paint the exterior — Painting the exterior can improve the curb appeal and increase both resale and rental value.
- Both Landscaping improvements — Well-maintained landscaping can enhance the home's curb appeal and attract more potential buyers or renters.
- Both Interior updates — Updating the interior can improve the home's overall condition and make it more attractive to potential buyers or renters.
Renovation cost estimate screening
Value-add ROI direction
- Both Paint the exterior — Painting the exterior can improve the curb appeal and increase both resale and rental value. ↑
- Both Landscaping improvements — Well-maintained landscaping can enhance the home's curb appeal and attract more potential buyers or renters. ↑
- Both Interior updates — Updating the interior can improve the home's overall condition and make it more attractive to potential buyers or renters. ↑
ⓘ Cost ranges are severity-bucket heuristics (US national rule-of-thumb). Get contractor quotes + a written scope before underwriting a rehab budget.
Schools (NCES district)
- District
- Penfield Central School District
- NCES district ID
- 3622710
- Math proficiency
- 77% ▼ -3.00%
- Reading proficiency
- 79% ▲ 10.00%
- Median HH income
- $74,802
- Composite
- 68.37/100
- National rank
- #347
- State rank
- #67 of 590 in NY
Livability — St. John Fisher College
No livability data for this city. (Only ~50 U.S. cities are tracked.)
Census & demographics
- Population (ZIP)
- 10,667
Population outlook (Monroe County) Hauer SSP2
- Today (2025)
- 759,460 people
- By 2030
- 757,154 · -0.3%
- By 2040
- 740,644 · -2.5%
- By 2050
- 714,443 · -5.9%
- By 2075
- 645,883 · -15.0%
- By 2100
- 547,084 · -28.0%
Race, ethnicity, and origin ACS 2023
- Neighborhood character
- Predominantly White (85%)
- Race & ethnicity
- White 85% Two or more races 10% Hispanic / Latino 6% Black 1% Asian 1%
- Hispanic origin (detail)
- Puerto Rican 1% Dominican 1%
- Common ancestry
- Romanian 7% Subsaharan African 3% Iranian 2%
- Foreign-born
- 7% · Canada, China
- Languages at home
- 92% English-only · Russian/Polish/Slavic 3% Spanish 2% Other Indo-European 2%
Political lean MEDSL · Monroe
- 2024 margin
- D (+19.1) · D 59.5% · R 40.5%
- 2008→2024 swing
- +1.4pp toward D · 2008: 17.7pp · 2024: 19.1pp
- All cycles
- 2024: D+19.1 2020: D+21.0 2016: D+14.1 2012: D+17.4 2008: D+17.7
Not yet ingested
- Civics
- —
Market trends
- HPI YoY
- ▼ -49.69%
- Current HPI
- 275.9721
- Rent YoY
- —
- Metro
- —
- State GDP YoY
- ▲ 2.60%
- F500 in state
- 92
Industry mix (Fortune 500 HQ in NY)
| Industry | F500 HQs | Revenue |
|---|---|---|
| Financial Services | 10 | $950B |
|
||
| Consumer Goods | 9 | $162B |
|
||
| Insurance | 4 | $225B |
|
||
| Telecommunications | 2 | $144B |
|
||
| Pharmaceuticals | 2 | $112B |
|
||
| Media / Entertainment | 2 | $69B |
|
||
Cash-flow waterfall
monthlySold comps — $/sqft
last 12 mo · ≤1 miLoading sold comps…