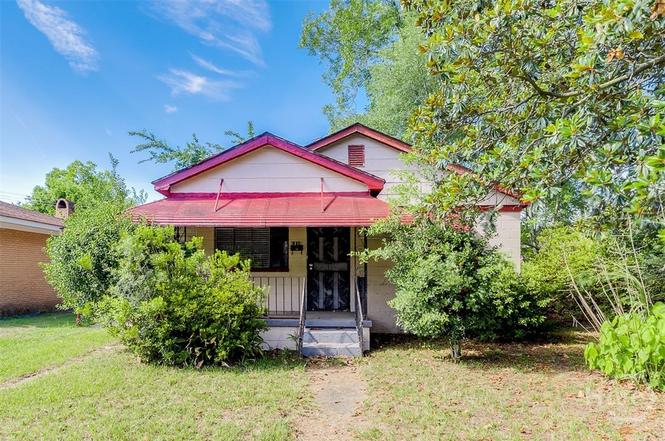
1110 W 49th St · Savannah, GA
Flood risk 1/10 · Minimal
- FEMA flood zone
- X (unshaded)
- Chance of flooding over 30 yrs
- 0.0%
- Est. flood insurance / yr
- $507 – $1,088
Fire risk 2/10 · Minimal
- Est. fire insurance / yr
- $963 – $1,789
Heat risk 10/10 · Severe
- Hot days now (above 108°F)
- 7 days/yr
- Hot days in 30 yrs
- 18 days/yr
Wind risk 9/10 · Severe
- Chance of severe wind over 30 yrs
- 99.0%
Air-quality risk 5/10 · Moderate
- Unhealthy air days now
- 7 days/yr
- Unhealthy air days in 30 yrs
- 8 days/yr
Risk factors via First Street. Map © Google.
Why this score? — see what drove the B+ grade
The composite is a weighted blend of 9 inputs, each scored 0–100. Each bar is that input's sub-score; the figure is the points it added to the 100-point composite (weight × sub-score).
- Cash flow +30.0/30.0
- ARV discount +15.0/15.0
- 1% rule +10.0/10.0
- DSCR +10.0/10.0
- Livability +4.3/5.0
- Rent growth +3.2/5.0
- Condition / age +2.5/5.0
- Schools +2.0/10.0
- Appreciation +0.0/10.0
$117,000
🖨 Deal sheet (PDF) 📄 Offer letter ✓ Due diligence
Listing remarks
This charming 2-bedroom, 1-bath home is the perfect opportunity for investors, first-time buyers, or anyone looking to add their own personal touch. It sits on a quiet, dead end street. Featuring original hardwood flooring in the living area, this home offers character and a great start for renovation. With its manageable size and great layout, it's an ideal project home ready to be transformed into something special. Whether you're looking for a starter home or your next investment property, this one is full of possibilities. Don't miss the chance to bring your vision to life! Priced at current apprasial value.
Key facts
- Great layout
- 5,998 sq ft lot
- Garage
Tags
Property features AI
Exterior
- Parking: Carport (1 space); Off-street parking
- Utilities: Public water; Public sewer; Underground utilities
- Home design: Single-family residence; One story; R1 zoning
- Construction: Block construction
- Exterior features: Asphalt road access; Underground utilities
Interior
- Bathrooms: 1 full bathroom
- Heating & cooling: Central heating (electric); Central air conditioning (electric)
- Interior features: Electric water heater
- Laundry & utility: Laundry area in garage
Neighborhood map
What this means for you Summary
Snapshot
- This is a 3-bed/1.0-bath single-family listed at $117k.
Deal economics
- At list price, monthly cash flow is $669 ($8k/yr) — positive.
- The deal already cash-flows at list — no discount required.
- Meets the 1% rule at list price ($2k rent vs $117k).
- Cap rate 13.2% vs local median 4.0% in Savannah — top-decile yield for the area; either an underpriced asset or a hidden risk that comps aren't pricing in. Stress-test before assuming the spread holds.
Location & tenants
- Location reads 86/100 on livability (#1 in GA, #397 nationally) — a professional / high-income tenant draw. Strengths: crime A+, amenities A+, commute A+; Watch: employment D, schools F.
- Savannah-Chatham County (urban): math 20% / reading 26% proficiency, ranked #134 of 174 in GA (top 77%) — low school quality limits family demand, transient renter base, plan for 1-2y turnover.
- Market conditions: Rents rising (+3.0%/yr); 332 active listings in the ZIP; 40 comparable units currently listed for rent nearby; rentals at typical pace (median 26d on market — plan ~3-4 weeks tenant-placement turnaround); 2,694 units permitted in Chatham County in 2024 (973 in 5+ unit buildings).
- This rent runs 43% of the median local income ($53k/yr) — at the standard rent-burdened threshold; future hikes will face affordability resistance.
Forward outlook
- Local home prices are declining (-3.0%/yr); year-one equity from $809 of loan paydown is wiped out by about $4k of value loss. Plan a longer hold.
- Chatham County population projected at +33% by 2050 — long-run rental-demand tailwind backs the buy-and-hold thesis.
- At projected returns (-3.0% appreciation + 3.0% rent growth), your $33k cash investment doubles in ~5 years — after that, you're playing with house money.
Negotiation context
- Only 4 days on market — expect competitive offers; lowballing is unlikely to land.
- Current owner paid $27k; list at $117k implies a 333% gain — meaningful room to come down on a strong offer.
Risks & watch-outs
- Watch-outs: built in 1950 — expect roof / HVAC / electrical / plumbing capex.
- Climate carrying-cost: severe wind risk, 99% chance of damaging wind over 30y; extreme-heat days projected 7→18/yr by 2055 (HVAC capex compounding) — expect insurance premiums to compound above CPI over the hold.
Questions for the listing agent
- Built in 1950 — when were the roof, HVAC, electrical panel, plumbing, and water heater last replaced?
- Is there a deadline driving the sale (1031 exchange, divorce, estate, relocation)? That informs how much negotiation room exists.
- Schools are F-rated, which usually means shorter tenancies and higher turnover. Who's the typical renter profile here, and what's been the actual vacancy rate?
- What's the average days-on-market for RENTAL listings here right now (not sales)? A rising rental-DOM trend means longer vacancies and softer asking-rent achievability than the comps imply.
- What's the recent tenant-quality profile in this submarket — average credit score on applications, eviction rate, late-payment / NSF rate, and stable-employment percentage? A property-management company in the area should have these aggregated.
- How much new for-sale + rental construction is in the pipeline within 1–3 miles? Heavy new supply typically softens prices + rents 12–24 months out; constrained supply supports both.
Investment metrics
- 1% rule
- 1.59% ✓
- Cap rate
- 13.16%
- Cash-on-cash
- 24.52%
- DSCR
- 2.09
- GRM
- 5.2
CMA / ARV
- ARV (on-the-fly)
- $164,736
- Comps found
- 12
Show comp detail 12 sales within ~0.75 mi
| Address | Dist | Beds/Ba | Sqft | Sold | Price | $/sf | Match |
|---|---|---|---|---|---|---|---|
| 921 W 46th St | 0.20mi | 2/1.0 (-1) | 792 (0%) | 16mo | $113,500 | $143 | 72 |
| 1011 W Victory Dr | 0.31mi | 2/1.0 (-1) | 768 (-3%) | 12mo | $159,600 | $208 | 65 |
| 1106 W 41st St | 0.42mi | 2/1.0 (-1) | 864 (+9%) | 4mo | $160,000 | $185 | 57 |
| 1011 W 40th St | 0.46mi | 2/1.0 (-1) | 804 (+2%) | 23mo | $50,000 | $62 | 52 |
| 515 W 59th St | 0.73mi | 2/1.0 (-1) | 832 (+5%) | 2mo | $230,000 | $276 | 51 |
| 717 W 51st St | 0.28mi | 2/1.0 (-1) | 864 (+9%) | 21mo | $145,000 | $168 | 49 |
| 514 Orchard St | 0.47mi | 2/2.0 (-1) | 768 (-3%) | 20mo | $235,000 | $306 | 47 |
| 2019 Harden St | 0.70mi | 3/1.0 | 693 (-12%) | 2mo | $144,200 | $208 | 45 |
| 509 Acacia St | 0.46mi | 3/1.0 | 888 (+12%) | 21mo | $125,000 | $141 | 40 |
| 2110 Bulloch St | 0.66mi | 3/2.0 | 700 (-12%) | 7mo | $236,000 | $337 | 40 |
| 607 W 39th St | 0.65mi | 3/1.0 | 864 (+9%) | 23mo | $225,000 | $260 | 35 |
| 2712 Burroughs St | 0.52mi | 2/1.0 (-1) | 905 (+14%) | 16mo | $60,000 | $66 | 34 |
Match score weights: distance 35% · size 25% · config 20% · recency 20%. Top-matched comps best support the ARV.
Projected returns pro-forma
-3.0% appreciation · 2.95% rent growth · sell at horizon
- IRR
- 17.8%
- Equity multiple
- 1.72×
- Total profit
- $23,597
- Equity at exit
- $17,445
- IRR
- 26.2%
- Equity multiple
- 3.29×
- Total profit
- $75,148
- Equity at exit
- $10,116
Cash invested: $32,760 (down + closing). Projections, not guarantees.
Landlord ↔ Tenant lean methodology
- Overall (STATE)
- 90 Strongly Landlord-Friendly
- State Georgia
- 90 Strongly Landlord-Friendly · R+3
- County
- — inherits STATE
- City
- — inherits STATE
ZIP-level market 31401
- Rents YoY
- 3.0%
- Active inventory
- 332
- Price-to-rent
- 5.2×
Monthly cashflow live
- Estimated rent
- $1,862 high interval (Pro) →
- Mortgage (P&I)
- −$614
- Tax from tax record
- −$140 /mo · $1,675/yr
- Insurance
- −$49
- HOA
- −$0
- Vacancy / Maint / Mgmt
- −$391
- Net cashflow
- $669
Break-even live
Sensitivity live
| Price | -10% $735 | -5% $702 | +0% $669 | +5% $636 | +10% $603 |
|---|---|---|---|---|---|
| Rent | -10% $522 | -5% $596 | +0% $669 | +5% $743 | +10% $816 |
| Rate | -1.0pp $728 | -0.5pp $699 | base $669 | +0.5pp $639 | +1.0pp $608 |
UW: 25.0% down · 7.5% · 30yr · 1.5% tax · 5.0% vac · 8.0% maint · 8.0% mgmt
Financing live
Cash to close
- Down payment
- $29,250
- Closing costs
- $3,510
- Reserves months
- —
- Total cash needed
- —
Loan-product check · same deal, 3 products live
Conventional
25% down · 7.5% · 30yr
- Down + closing
- —
- Monthly P&I
- —
- Monthly cashflow
- —
- DSCR
- —
- Eligible?
- —
Personal DTI + credit; lowest rate.
DSCR
20% down · 8.5% · 30yr
- Down + closing
- —
- Monthly P&I
- —
- Monthly cashflow
- —
- DSCR
- —
- Eligible?
- —
No personal income docs; deal must DSCR.
Hard money
10% down · 12.0% · 12mo
- Down + closing
- —
- Monthly P&I
- —
- Monthly cashflow
- —
- DSCR
- —
- Eligible?
- —
Short-term bridge; refi at stabilization.
Rent comps 40 comps
| Address | Beds | Baths | Sqft | Rent | $/sqft | DOM | Units | Dist |
|---|---|---|---|---|---|---|---|---|
| 1003 W 46th St Savannah, GA | 3.0 | 1.0 | 1100 | $1,625 | $1.48 | 16d | 1 | 0.17mi |
| 3302 Bulloch St Savannah, GA | 2.0 | 1.0 | 744 | $995 | $1.34 | 25d | 1 | 0.25mi |
| 1014 W 53rd St Savannah, GA | 3.0 | 2.0 | 1048 | $1,600 | $1.53 | 16d | 1 | 0.26mi |
| 2705 Stevens St Savannah, GA | 3.0 | 1.0 | 900 | $1,585 | $1.76 | 46d | 1 | 0.30mi |
| 1005 W Victory Dr Savannah, GA | 3.0 | 2.0 | 1056 | $1,950 | $1.85 | 25d | 1 | 0.31mi |
| 628 W 48th St Savannah, GA | 3.0 | 1.0 | 975 | $1,699 | $1.74 | 16d | 1 | 0.37mi |
| 1109 W 41st St Savannah, GA | 3.0 | 1.0 | 960 | $1,620 | $1.69 | 46d | 1 | 0.38mi |
| 1011 W 40th St Savannah, GA | 3.0 | 2.0 | 1125 | $1,995 | $1.77 | 16d | 1 | 0.45mi |
| 3212 Burroughs St Savannah, GA | 3.0 | 1.0 | 814 | $1,400 | $1.72 | 25d | 1 | 0.46mi |
| 607 W 44th St Unit B Savannah, GA | 3.0 | 1.0 | 1050 | $1,650 | $1.57 | 46d | 1 | 0.48mi |
| 601 W 54th St Savannah, GA | 1.0–4.0 | 1.0–2.0 | 881 | $1,633 | $1.85 | 25d | 1 | 0.54mi |
| 1024 W 39th St Savannah, GA | 2.0 | 1.0 | 860 | $1,399 | $1.63 | 25d | 1 | 0.57mi |
| 2221 Harden St Savannah, GA | 3.0 | 1.0 | 1000 | $1,550 | $1.55 | 46d | 1 | 0.58mi |
| 2203 Harden St Unit A Savannah, GA | 3.0 | 1.0 | 900 | $2,100 | $2.33 | 16d | 1 | 0.60mi |
| 2123 Harden St Savannah, GA | 2.0 | 1.0 | 1000 | $1,550 | $1.55 | 25d | 1 | 0.62mi |
| 2613 Montgomery St Unit B303 Savannah, GA | 2.0 | 2.0 | 879 | $3,472 | $3.95 | 46d | 1 | 0.64mi |
| 119 W 52nd St Savannah, GA | 2.0 | 1.0 | 1020 | $1,800 | $1.76 | 46d | 1 | 0.65mi |
| 3708 Montgomery St Savannah, GA | 2.0 | 1.0 | 725 | $1,400 | $1.93 | 16d | 1 | 0.65mi |
| 2108 Bulloch St Savannah, GA | 2.0 | 1.0 | 638 | $1,095 | $1.72 | 25d | 1 | 0.65mi |
| 620 W 38th St Unit B Savannah, GA | 2.0 | 1.0 | 1076 | $1,600 | $1.49 | 46d | 1 | 0.69mi |
| 2604 Jefferson St Savannah, GA | 2.0 | 1.0 | 910 | $1,900 | $2.09 | 46d | 1 | 0.72mi |
| 316 W 40th St Unit E Savannah, GA | 2.0 | 1.5 | 700 | $1,500 | $2.14 | 23d | 1 | 0.76mi |
| 316 W 40th St Unit D Savannah, GA | 2.0 | 1.0 | 700 | $1,500 | $2.14 | 23d | 1 | 0.76mi |
| 4401 Meding St Savannah, GA | 3.0 | 2.0 | 1030 | $1,500 | $1.46 | 25d | 1 | 0.78mi |
| 12 W 51st St Savannah, GA | 2.0 | 1.0 | 932 | $2,500 | $2.68 | 25d | 1 | 0.78mi |
| 118 W 56th St Savannah, GA | 2.0 | 1.0 | 936 | $1,625 | $1.74 | 16d | 1 | 0.78mi |
| 1019 W 35th St Unit B Savannah, GA | 3.0 | 2.0 | 1071 | $2,199 | $2.05 | 16d | 1 | 0.79mi |
| 4 W 53rd St Unit 4 Savannah, GA | 2.0 | 1.0 | 960 | $1,400 | $1.46 | 46d | 1 | 0.80mi |
| 20 W 54th St Savannah, GA | 2.0 | 1.0 | 950 | $1,200 | $1.26 | 25d | 1 | 0.80mi |
| 620 W 36th St Unit B Savannah, GA | 3.0 | 1.0 | 812 | $1,650 | $2.03 | 46d | 1 | 0.80mi |
| 3211 Bull St Unit A Savannah, GA | 2.0 | 1.0 | 1000 | $1,975 | $1.98 | 46d | 1 | 0.81mi |
| 3301 Bull St Unit 4 Savannah, GA | 2.0 | 1.0 | 1000 | $1,750 | $1.75 | 25d | 1 | 0.81mi |
| 2 W 53rd St #3 Savannah, GA | 2.0 | 1.0 | 1122 | $1,750 | $1.56 | 46d | 1 | 0.81mi |
| 315 W 38th St Savannah, GA | 2.0 | 2.0 | 864 | $1,600 | $1.85 | 46d | 1 | 0.82mi |
| 213 W 39th St Unit B Savannah, GA | 3.0 | 2.0 | 1000 | $2,250 | $2.25 | 25d | 1 | 0.84mi |
| 513 W 35th St Unit A LOWER Savannah, GA | 2.0 | 1.0 | 930 | $1,350 | $1.45 | 16d | 1 | 0.88mi |
| 513 W 35th St Savannah, GA | 2.0 | 1.0 | 930 | $1,450 | $1.56 | 16d | 1 | 0.88mi |
| 201 W 37th St Savannah, GA | 3.0 | 2.0 | 1000 | $2,595 | $2.60 | 46d | 1 | 0.93mi |
| 508 Kline St Savannah, GA | 2.0 | 2.0 | 900 | $2,000 | $2.22 | 16d | 1 | 0.94mi |
| 2213 Bull St Savannah, GA | 2.0 | 1.0–2.5 | 975 | $3,725 | $3.82 | 16d | 108 | 1.00mi |
Listing history 3 events
-
2026-06-21days on market $117,000 Active 4 DOM
-
2026-06-18remarks 619-char remark
-
2026-06-18$117,000 Active 1 DOM
ⓘ Source: listings_history table (triggers on properties + properties_extension) + one-shot
backfill from property_details.listing_events for pre-trigger history.
Tax reassessment forecast GA · Resets to sale price
- Current annual tax
- $1,675 · $140/mo
- Projected year-2 tax
- $1,675 · $140/mo
- Expected delta
- $0/yr ($0/mo · 0.0%)
ⓘ Screening estimate from a state-policy table — verify with the county assessor before closing.
Climate risk First Street
- Flood 1/10 Low FEMA zone X (unshaded) · 0% chance over 30 yrs
- Wildfire 2/10 Low
- Heat 10/10 Extreme 7 d/yr ≥108°F today · 18 d/yr by 30 yrs out
- Wind 9/10 Extreme 99% chance of damaging wind over 30 yrs
- Air quality 5/10 Major 7 unhealthy d/yr today · 8 by 30 yrs out
Nearby sold comps map
Loading sold comps map…
Walkable amenities ~0.75 mi
Loading nearby amenities…
Taxation est. · year 1
- Rental income
- $22,346
- − Mortgage interest
- −$6,554
- − Property taxes
- −$1,675
- − Insurance
- −$585
- − Repairs & maintenance
- −$1,788
- − Management
- −$1,788
- − Depreciation
- −$3,404
- Taxable income
- $6,554
- Est. tax owed @ 24.0%
- −$1,573
- After-tax cash flow
- $6,458/yr
For passive investors: Depreciation is non-cash, so a rental often shows a tax loss while cash-flowing — sheltering income. Rental losses are passive: they offset passive income freely, and up to $25,000/yr can offset ordinary (W-2) income if you actively participate and your MAGI is under $100k (phasing out to $0 by $150k); unused losses carry forward. On sale, claimed depreciation is recaptured at up to 25%, and gains may owe capital-gains tax (a 1031 exchange can defer both). Figures are a year-1 estimate at your 24.0% rate — not tax advice; consult a CPA.
Schools (NCES district)
- District
- Savannah-Chatham County
- NCES district ID
- 1301020
- Math proficiency
- 20% ▼ -11.00%
- Reading proficiency
- 26% ▼ -5.00%
- Median HH income
- $47,443
- Composite
- 20.14/100
- National rank
- #8639
- State rank
- #134 of 174 in GA
Livability — Savannah
- Score
- 86/100
- State rank
- #1
- US rank
- #397
Category grades
Schools grade is shown separately in the Schools card above.
Census & demographics
- Census place
- Savannah, GA
- County
- Chatham County · 271,602 people
- City population
- 216,564
- Metro
- Savannah, GA
- Population (ZIP)
- 20,445
- Household income
- $52,509
- Rent vs Own
- Severe rent burden
- 2031.0
Population outlook (Chatham County) Hauer SSP2
- Today (2025)
- 332,584 people
- By 2030
- 355,508 · +6.9%
- By 2040
- 400,030 · +20.3%
- By 2050
- 443,019 · +33.2%
- By 2075
- 534,579 · +60.7%
- By 2100
- 583,863 · +75.6%
Race, ethnicity, and origin ACS 2023
- Neighborhood character
- Diverse neighborhood (Simpson 0.59)
- Race & ethnicity
- White 53% Black 35% Hispanic / Latino 7% Two or more races 5% Asian 3%
- Hispanic origin (detail)
- Mexican 2% Puerto Rican 2%
- Common ancestry
- Slovak 2% Lithuanian 2% Romanian 2%
- Foreign-born
- 8% · Canada, China
- Languages at home
- 90% English-only · Spanish 4% Chinese 2% Other Indo-European 1%
Political lean MEDSL · Chatham
- 2024 margin
- D (+18.0) · D 58.6% · R 40.6%
- 2008→2024 swing
- +3.6pp toward D · 2008: 14.4pp · 2024: 18.0pp
- All cycles
- 2024: D+18.0 2020: D+18.8 2016: D+14.5 2012: D+12.0 2008: D+14.4
Not yet ingested
- Civics
- —
Market trends
- HPI YoY
- ▼ -358.74%
- Current HPI
- 553.5645
- Rent YoY
- ▲ 2.95%
- Metro
- Savannah, GA
- State GDP YoY
- ▲ 2.66%
- F500 in state
- 28
Industry mix (Fortune 500 HQ in GA)
| Industry | F500 HQs | Revenue |
|---|---|---|
| Paper / Packaging | 2 | $29B |
|
||
| Retail | 1 | $160B |
|
||
| Transportation / Logistics | 1 | $91B |
|
||
| Airlines | 1 | $62B |
|
||
| Consumer Goods | 1 | $47B |
|
||
| Utilities | 1 | $25B |
|
||
Price history
+333.3% since first listed2 events — show timeline
- 2026-06-17 Listed $117,000 Hive MLS
- 2000-04-14 Sold (Public Records) $27,000 Public Records
Property tax history
+11.4%/yrLatest (2025): $1,675 · +30.8% YoY. Source: county tax records.
Cash-flow waterfall
monthlySold comps — $/sqft
last 12 mo · ≤1 miLoading sold comps…