 Multi-family
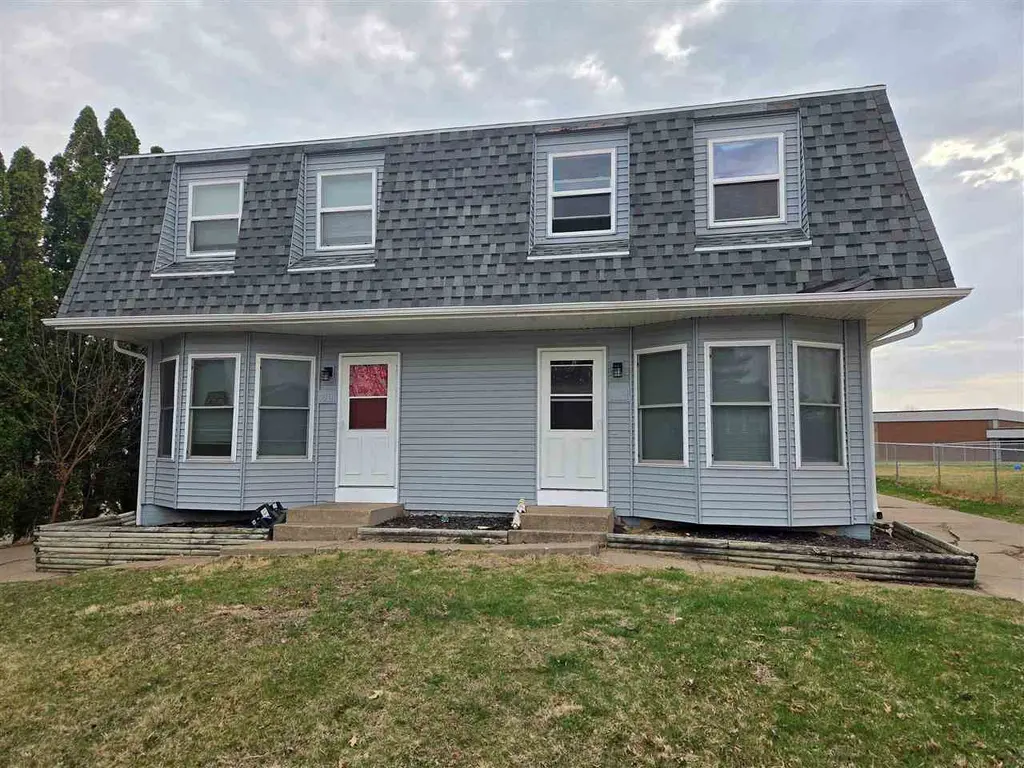
5511 N Linwood Ave #5509 · Davenport, IA
Flood risk 1/10 · Minimal
- FEMA flood zone
- X (unshaded)
- Chance of flooding over 30 yrs
- 0.0%
- Est. flood insurance / yr
- $473 – $860
Fire risk 1/10 · Minimal
- Est. fire insurance / yr
- $902 – $1,676
Heat risk 3/10 · Minor
- Hot days now (above 103°F)
- 7 days/yr
- Hot days in 30 yrs
- 16 days/yr
Wind risk 2/10 · Minimal
- Chance of severe wind over 30 yrs
- —
Air-quality risk 3/10 · Minor
- Unhealthy air days now
- 2 days/yr
- Unhealthy air days in 30 yrs
- 3 days/yr
Risk factors via First Street. Map © Google.
Why this score? — see what drove the C grade
The composite is a weighted blend of 9 inputs, each scored 0–100. Each bar is that input's sub-score; the figure is the points it added to the 100-point composite (weight × sub-score).
- Cash flow +26.2/30.0
- DSCR +8.9/10.0
- 1% rule +7.0/10.0
- Livability +4.0/5.0
- Condition / age +4.0/5.0
- Schools +3.9/10.0
- Rent growth +3.0/5.0
- ARV discount +2.6/15.0
- Appreciation +0.0/10.0
$198,000
🖨 Deal sheet (PDF) 📄 Offer letter ✓ Due diligence
Multi-family units
County records classify this as Multi-Family (2-4 Unit). Listing-text estimate: 1 unit. estimate disagrees with records
Listing remarks
This property has been completely updated from the flooring, paint, stairs, newer kitchen cabinets and both bathrooms updated. Leased through 4-1-27 for $2100/month & Tenant pays all utilities. New roof and A/C in "22"
Key facts
- New a c
- Updated bathrooms
- New roof
Tags
Property features AI
Finance
- Other: Community: Wedgewood; No community amenities listed
- Financial info: Unit rents listed: one unit at $950, another at $1,150
- HOA & community: Association fee paid annually
Exterior
- Parking: 2 parking spaces
- Utilities: Public water; Public sewer
- Home design: Residential multi-family property; Frame construction with vinyl siding
- Construction: Frame construction; Vinyl siding
- Exterior features: Lot dimensions approximately 60.5 x 127; Residential zoning
Interior
- Kitchen: Dishwasher; Refrigerator; Microwave
- Flooring: Carpet
- Bathrooms: Units include half baths (some units have 1 half bath); Some units include one full bathroom
- Heating & cooling: Central air conditioning; Electric and natural gas heating; Forced air heating
- Interior features: Dining room in multiple units; Living room in multiple units; Full, unfinished concrete basement
- Laundry & utility: Washer; Dryer
Neighborhood map
What this means for you Summary
Snapshot
- This is a ?-bed/2.0-bath multifamily listed at $198k. Condition is rated good.
Deal economics
- At list price, monthly cash flow is $508 ($6k/yr) — positive.
- The deal already cash-flows at list — no discount required.
- Meets the 1% rule at list price ($2k rent vs $198k).
- Recommended offer: $195k (1.5% below list) — sets the bar for market timing.
- Cap rate 9.4% vs local median 4.4% in Davenport — top-decile yield for the area; either an underpriced asset or a hidden risk that comps aren't pricing in. Stress-test before assuming the spread holds.
Location & tenants
- Location reads 79/100 on livability (#126 in IA, #2,312 nationally) — a middle-class / working-renter tenant base. Strengths: cost of living A+, housing A+, health & safety A+; Watch: employment C-, crime F.
- Davenport Community School District (urban): math 43% / reading 50% proficiency, ranked #288 of 289 in IA (top 100%) — families likely to look elsewhere, expect single-tenant / working-renter base with shorter leases.
- Market conditions: Rents rising (+1.8%/yr); 162 active listings in the ZIP; 2 comparable units currently listed for rent nearby; 805 units permitted in Scott County in 2024 (479 in 5+ unit buildings).
- This rent runs 38% of the median local income ($74k/yr) — at the standard rent-burdened threshold; future hikes will face affordability resistance.
Forward outlook
- Local home prices are declining (-3.0%/yr); year-one equity from $1k of loan paydown is wiped out by about $6k of value loss. Plan a longer hold.
- Scott County population projected at +19% by 2050 — long-run rental-demand tailwind backs the buy-and-hold thesis.
Negotiation context
- It's been on market 18 days — a 2% lower offer ($195k) is reasonable based on typical stale-listing flexibility.
Questions for the listing agent
- Built in 1979 — when were the roof, HVAC, electrical panel, plumbing, and water heater last replaced?
- Is there a deadline driving the sale (1031 exchange, divorce, estate, relocation)? That informs how much negotiation room exists.
- Crime grade is F in this area — have there been break-ins, vandalism, or insurance claims at this property in the last 3 years? What carrier currently insures it and at what premium?
- What's the average days-on-market for RENTAL listings here right now (not sales)? A rising rental-DOM trend means longer vacancies and softer asking-rent achievability than the comps imply.
- What's the recent tenant-quality profile in this submarket — average credit score on applications, eviction rate, late-payment / NSF rate, and stable-employment percentage? A property-management company in the area should have these aggregated.
- How much new apartment / multifamily construction is in the pipeline within 1–3 miles? Heavy new supply (>2% of stock underway) typically softens rents 12–24 months out; light construction supports rent growth.
Investment metrics
- 1% rule
- 1.20% ✓
- Cap rate
- 9.37%
- Cash-on-cash
- 10.99%
- DSCR
- 1.49
- GRM
- 6.9
CMA / ARV
- ARV (on-the-fly)
- $178,416
- Comps found
- 4
Show comp detail 4 sales within ~0.75 mi
| Address | Dist | Beds/Ba | Sqft | Sold | Price | $/sf | Match |
|---|---|---|---|---|---|---|---|
| 5503 N Linwood Ave | 0.02mi | —/— | 2,124 (0%) | 14mo | $180,000 | $85 | 88 |
| 5510 N Division St | 0.64mi | —/— | 2,124 (0%) | 5mo | $175,000 | $82 | 66 |
| 5524 N Division St | 0.64mi | —/— | 2,124 (0%) | 8mo | $172,000 | $81 | 63 |
| 5436 N Division St | 0.65mi | —/— | 2,088 (-2%) | 7mo | $175,000 | $84 | 61 |
Match score weights: distance 35% · size 25% · config 20% · recency 20%. Top-matched comps best support the ARV.
Projected returns pro-forma
-3.0% appreciation · 1.8% rent growth · sell at horizon
- IRR
- -1.2%
- Equity multiple
- 0.95×
- Total profit
- $-2,533
- Equity at exit
- $29,522
- IRR
- 7.2%
- Equity multiple
- 1.51×
- Total profit
- $28,244
- Equity at exit
- $17,119
Cash invested: $55,440 (down + closing). Projections, not guarantees.
Landlord ↔ Tenant lean methodology
- Overall (STATE)
- 83 Strongly Landlord-Friendly
- State Iowa
- 83 Strongly Landlord-Friendly · R+6
- County
- — inherits STATE
- City
- — inherits STATE
ZIP-level market 52806
- Rents YoY
- 1.8%
- Active inventory
- 162
- Price-to-rent
- 13.9×
Monthly cashflow live
- Estimated rent
- $2,375 high interval (Pro) →
- Mortgage (P&I)
- −$1,038
- Tax est. 1.5%
- −$248 /mo · $2,970/yr
- Insurance
- −$82
- HOA
- −$0
- Vacancy / Maint / Mgmt
- −$499
- Net cashflow
- $508
Break-even live
Sensitivity live
| Price | -10% $645 | -5% $576 | +0% $508 | +5% $439 | +10% $371 |
|---|---|---|---|---|---|
| Rent | -10% $320 | -5% $414 | +0% $508 | +5% $602 | +10% $696 |
| Rate | -1.0pp $608 | -0.5pp $558 | base $508 | +0.5pp $457 | +1.0pp $404 |
2-unit breakdown (identical units grouped — click to expand)
| Units | Beds | Baths | Est. rent |
|---|---|---|---|
| 2× units | 2 | 1 | $2,376 |
| #1 | 2 | 1 | $1,188 |
| #2 | 2 | 1 | $1,188 |
| Total (2 units) | $2,375 | ||
UW: 25.0% down · 7.5% · 30yr · 1.5% tax · 5.0% vac · 8.0% maint · 8.0% mgmt
Financing live
Cash to close
- Down payment
- $49,500
- Closing costs
- $5,940
- Reserves months
- —
- Total cash needed
- —
Loan-product check · same deal, 3 products live
Conventional
25% down · 7.5% · 30yr
- Down + closing
- —
- Monthly P&I
- —
- Monthly cashflow
- —
- DSCR
- —
- Eligible?
- —
Personal DTI + credit; lowest rate.
DSCR
20% down · 8.5% · 30yr
- Down + closing
- —
- Monthly P&I
- —
- Monthly cashflow
- —
- DSCR
- —
- Eligible?
- —
No personal income docs; deal must DSCR.
Hard money
10% down · 12.0% · 12mo
- Down + closing
- —
- Monthly P&I
- —
- Monthly cashflow
- —
- DSCR
- —
- Eligible?
- —
Short-term bridge; refi at stabilization.
Rent comps 2 comps
| Address | Beds | Baths | Sqft | Rent | $/sqft | DOM | Units | Dist |
|---|---|---|---|---|---|---|---|---|
| 5556 N Thornwood Ave Davenport, IA | 3.0 | 2.0 | 1715 | $1,800 | $1.05 | 45d | 1 | 0.13mi |
| 5337 Villa Dr Davenport, IA | 2.0–3.0 | 2.5 | 1650 | $1,995 | $1.21 | 14d | 1 | 0.85mi |
Listing history 13 events
-
2026-06-21days on market $198,000 Active 18 DOM
-
2026-06-18days on market $198,000 Active 15 DOM
-
2026-06-17days on market $198,000 Active 14 DOM
-
2026-06-16days on market $198,000 Active 13 DOM
-
2026-06-15days on market $198,000 Active 12 DOM
-
2026-06-14days on market $198,000 Active 10 DOM
-
2026-06-13days on market $198,000 Active 9 DOM
-
2026-06-10days on market $198,000 Active 7 DOM
-
2026-06-09days on market $198,000 Active 6 DOM
-
2026-06-08days on market $198,000 Active 5 DOM
-
2026-06-07days on market $198,000 Active 4 DOM
-
2026-06-03remarks 220-char remark
-
2026-06-03$198,000 Active 1 DOM
ⓘ Source: listings_history table (triggers on properties + properties_extension) + one-shot
backfill from property_details.listing_events for pre-trigger history.
Climate risk First Street
- Flood 1/10 Low FEMA zone X (unshaded) · 0% chance over 30 yrs
- Wildfire 1/10 Low
- Heat 3/10 Moderate 7 d/yr ≥103°F today · 16 d/yr by 30 yrs out
- Wind 2/10 Low
- Air quality 3/10 Moderate 2 unhealthy d/yr today · 3 by 30 yrs out
Nearby sold comps map
Loading sold comps map…
Walkable amenities ~0.75 mi
Loading nearby amenities…
Taxation est. · year 1
- Rental income
- $28,500
- − Mortgage interest
- −$11,091
- − Property taxes
- −$2,970
- − Insurance
- −$990
- − Repairs & maintenance
- −$2,280
- − Management
- −$2,280
- − Depreciation
- −$5,760
- Taxable income
- $3,129
- Est. tax owed @ 24.0%
- −$751
- After-tax cash flow
- $5,344/yr
For passive investors: Depreciation is non-cash, so a rental often shows a tax loss while cash-flowing — sheltering income. Rental losses are passive: they offset passive income freely, and up to $25,000/yr can offset ordinary (W-2) income if you actively participate and your MAGI is under $100k (phasing out to $0 by $150k); unused losses carry forward. On sale, claimed depreciation is recaptured at up to 25%, and gains may owe capital-gains tax (a 1031 exchange can defer both). Figures are a year-1 estimate at your 24.0% rate — not tax advice; consult a CPA.
Condition & rehab AI · 6 photos
This multi-family property has been comprehensively updated with new flooring, paint, and appliances, making it move-in ready and well-suited for both resale and rental.
Value-add opportunities
- Both Paint exterior — Enhances curb appeal and value
- Both Replace window seals — Improves energy efficiency and reduces maintenance costs
Renovation cost estimate screening
Value-add ROI direction
- Both Paint exterior — Enhances curb appeal and value ↑
- Both Replace window seals — Improves energy efficiency and reduces maintenance costs ↑
ⓘ Cost ranges are severity-bucket heuristics (US national rule-of-thumb). Get contractor quotes + a written scope before underwriting a rehab budget.
Schools (NCES district)
- District
- Davenport Community School District
- NCES district ID
- 1908580
- Math proficiency
- 43% ▼ -11.00%
- Reading proficiency
- 50% ▼ -3.00%
- Median HH income
- $46,157
- Composite
- 39.49/100
- National rank
- #3951
- State rank
- #288 of 289 in IA
Livability — Davenport
- Score
- 79/100
- State rank
- #126
- US rank
- #2312
Category grades
Schools grade is shown separately in the Schools card above.
Census & demographics
- Census place
- Davenport, IA
- County
- Scott County · 144,583 people
- City population
- 103,319
- Metro
- Davenport-Moline-Rock Island, IA-IL
- Population (ZIP)
- 26,871
- Household income
- $74,297
- Rent vs Own
- Severe rent burden
- 735.0
Population outlook (Scott County) Hauer SSP2
- Today (2025)
- 188,878 people
- By 2030
- 196,648 · +4.1%
- By 2040
- 210,860 · +11.6%
- By 2050
- 224,359 · +18.8%
- By 2075
- 258,884 · +37.1%
- By 2100
- 286,447 · +51.7%
Race, ethnicity, and origin ACS 2023
- Neighborhood character
- Predominantly White (74%)
- Race & ethnicity
- White 74% Black 12% Hispanic / Latino 7% Two or more races 7% Asian 2%
- Hispanic origin (detail)
- Mexican 6%
- Common ancestry
- Slovak 2% Lithuanian 2% Iranian 1%
- Foreign-born
- 4% · Canada, Vietnam, China
- Languages at home
- 93% English-only · Spanish 3% Vietnamese 1% Chinese 1%
Political lean MEDSL · Scott
- 2024 margin
- Toss-up / Even · D 47.3% · R 51.2% · Other 1.4%
- 2008→2024 swing
- -18.4pp toward R · 2008: 14.6pp · 2024: -3.9pp
- All cycles
- 2024: R+3.9 2020: D+3.5 2016: D+1.4 2012: D+13.8 2008: D+14.6
Not yet ingested
- Civics
- —
Market trends
- HPI YoY
- ▼ -127.41%
- Current HPI
- 185.0808
- Rent YoY
- ▲ 1.80%
- Metro
- Davenport-Moline-Rock Island, IA-IL
- State GDP YoY
- ▲ 2.48%
- F500 in state
- 4
Industry mix (Fortune 500 HQ in IA)
| Industry | F500 HQs | Revenue |
|---|---|---|
| Financial Services | 1 | $16B |
|
||
| Retail / Convenience | 1 | $15B |
|
||
Price history
1 event — show timeline
- 2026-06-03 Listed $198,000 ICAARMLS
Cash-flow waterfall
monthlySold comps — $/sqft
last 12 mo · ≤1 miLoading sold comps…