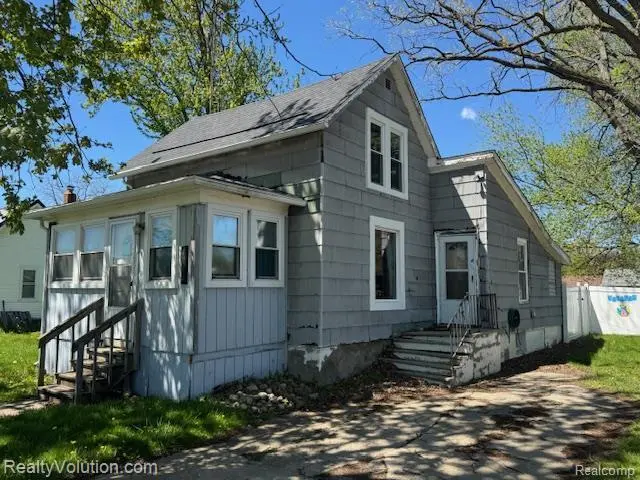
4212 1st St · Brown City, MI
Flood risk 1/10 · Minimal
- FEMA flood zone
- X (unshaded)
- Chance of flooding over 30 yrs
- 0.0%
- Est. flood insurance / yr
- $473 – $860
Fire risk 1/10 · Minimal
- Est. fire insurance / yr
- $784 – $1,456
Heat risk 2/10 · Minimal
- Hot days now (above 98°F)
- 7 days/yr
- Hot days in 30 yrs
- 15 days/yr
Wind risk 1/10 · Minimal
- Chance of severe wind over 30 yrs
- —
Air-quality risk 3/10 · Minor
- Unhealthy air days now
- 2 days/yr
- Unhealthy air days in 30 yrs
- 3 days/yr
Risk factors via First Street. Map © Google.
Why this score? — see what drove the C+ grade
The composite is a weighted blend of 9 inputs, each scored 0–100. Each bar is that input's sub-score; the figure is the points it added to the 100-point composite (weight × sub-score).
- Cash flow +30.0/30.0
- 1% rule +10.0/10.0
- DSCR +10.0/10.0
- Livability +3.2/5.0
- Schools +2.7/10.0
- Rent growth +2.5/5.0
- Condition / age +2.5/5.0
- ARV discount +0.0/15.0
- Appreciation +0.0/10.0
$59,900
🖨 Deal sheet (PDF) 📄 Offer letter ✓ Due diligence
Listing remarks MLS
CASH BUYERS ONLY--Attn: Investors, Landlords, Flippers---come check out this estate sale opportunity. This home needs some TLC inside and out but shows potential. It appears to have a newer roof and newer vinyl windows as well. Also has an updated 100amp electrical panel and newer HWH. Features a very private back yard that is fenced with newer vinyl fencing. House is heated by central wall furnace--no duct work. Has one small bedroom on first floor and two small bedrooms upstairs. Home does have a basement too. Warning there is mold present on some wood paneling in basement. House is sold as is with all contents on site included. No land contracts---cash offers only. Could be a great rental home or flip opportunity. FYI-Buyer to pay for the agent services they choose to hire.
Key facts
- Central wall furnace
- Newer vinyl windows
- Fenced yard
Tags
Property features AI
Finance
- Other: Located in the J M BROWNS ADD subdivision; Directions: M-90 into town to 1st St.; cross streets 1st St. and St. Marys
Exterior
- Parking: No garage
- Utilities: Public water; Public sewer
- Home design: Single-family residence; One and one-half stories; Ground-level entry with steps
- Construction: Asphalt construction materials; Block foundation
- Exterior features: Paved road access; Lot dimensions approximately 50 x 150 (0.2 acres)
Interior
- Bathrooms: 1 full bathroom
- Heating & cooling: Natural gas heating; Wall furnace; No central cooling
- Interior features: Unfinished basement; Total of 4 rooms
Neighborhood map
What this means for you Summary
Snapshot
- This is a 3-bed/1.0-bath single-family listed at $60k.
Deal economics
- At list price, monthly cash flow is $398 ($5k/yr) — positive.
- The deal already cash-flows at list — no discount required.
- Meets the 1% rule at list price ($950 rent vs $60k).
- Recommended offer: $59k (1.5% below list) — sets the bar for market timing.
- Cap rate 14.3% vs local median 4.2% in Brown City — top-decile yield for the area; either an underpriced asset or a hidden risk that comps aren't pricing in. Stress-test before assuming the spread holds.
Location & tenants
- Location reads 63/100 on livability (#512 in MI) — a middle-class / working-renter tenant base. Strengths: cost of living A+, housing A+, crime A; Watch: schools C-, amenities F, commute F.
- Brown City Community Schools (rural): math 25% / reading 39% proficiency, ranked #336 of 540 in MI (top 62%) — families likely to look elsewhere, expect single-tenant / working-renter base with shorter leases.
- Market conditions: 43 active listings in the ZIP; 1 comparable units currently listed for rent nearby; 63 units permitted in Sanilac County in 2024 (0 in 5+ unit buildings).
Forward outlook
- Local home prices are declining (-3.0%/yr); year-one equity from $414 of loan paydown is wiped out by about $2k of value loss. Plan a longer hold.
- Sanilac County population projected at -31% by 2050 — secular population decline; favor cash flow + early exit over multi-decade hold.
- At projected returns (-3.0% appreciation + 3.0% rent growth), your $17k cash investment doubles in ~5 years — after that, you're playing with house money.
Negotiation context
- It's been on market 17 days — a 2% lower offer ($59k) is reasonable based on typical stale-listing flexibility.
- 3 sale attempts since 12y ago with the ask held roughly flat each time — persistent listings suggest the price (not the market) is what's stuck; bring a comps-based counter.
- Current owner paid $18k; list at $60k implies a 233% gain — meaningful room to come down on a strong offer.
Questions for the listing agent
- Is there a deadline driving the sale (1031 exchange, divorce, estate, relocation)? That informs how much negotiation room exists.
- What's the average days-on-market for RENTAL listings here right now (not sales)? A rising rental-DOM trend means longer vacancies and softer asking-rent achievability than the comps imply.
- What's the recent tenant-quality profile in this submarket — average credit score on applications, eviction rate, late-payment / NSF rate, and stable-employment percentage? A property-management company in the area should have these aggregated.
- How much new for-sale + rental construction is in the pipeline within 1–3 miles? Heavy new supply typically softens prices + rents 12–24 months out; constrained supply supports both.
Investment metrics
- 1% rule
- 1.59% ✓
- Cap rate
- 14.27%
- Cash-on-cash
- 28.48%
- DSCR
- 2.27
- GRM
- 5.3
CMA / ARV
- ARV (on-the-fly)
- $49,882
- Comps found
- 11
Show comp detail 11 sales within ~0.75 mi
| Address | Dist | Beds/Ba | Sqft | Sold | Price | $/sf | Match |
|---|---|---|---|---|---|---|---|
| 4183 Second St | 0.08mi | 2/1.5 (-1) | 1,000 (-2%) | 4mo | $187,000 | $187 | 83 |
| 4101 Mapleview Ct E | 0.43mi | 3/2.0 | 1,000 (-2%) | 4mo | $41,500 | $42 | 70 |
| 4297 Maple St | 0.27mi | 2/1.0 (-1) | 1,025 (+1%) | 18mo | $97,000 | $95 | 66 |
| 4247 Vine St | 0.17mi | 3/1.0 | 1,135 (+12%) | 10mo | $153,000 | $135 | 64 |
| 7113 Mapleview Cir E | 0.38mi | 3/2.0 | 980 (-4%) | 9mo | $46,000 | $47 | 64 |
| 7168 Mapleview Cir W | 0.40mi | 3/2.0 | 950 (-7%) | 10mo | $35,000 | $37 | 57 |
| 7134 Mapleview Circle East Cir | 0.41mi | 2/2.0 (-1) | 980 (-4%) | 13mo | $39,900 | $41 | 54 |
| 4245 Maple St | 0.25mi | 3/1.0 | 1,155 (+14%) | 21mo | $113,000 | $98 | 48 |
| 7111 Mapleview Cir E | 0.34mi | 3/2.0 | 1,120 (+10%) | 22mo | $55,000 | $49 | 45 |
| 4085 Mapleview Ct E | 0.45mi | 2/2.0 (-1) | 924 (-9%) | 12mo | $45,000 | $49 | 44 |
| 6791 Cade Rd | 0.61mi | 3/1.0 | 1,150 (+13%) | 23mo | $99,000 | $86 | 30 |
Match score weights: distance 35% · size 25% · config 20% · recency 20%. Top-matched comps best support the ARV.
Projected returns pro-forma
-3.0% appreciation · 3.0% rent growth · sell at horizon
- IRR
- 22.7%
- Equity multiple
- 1.93×
- Total profit
- $15,626
- Equity at exit
- $8,931
- IRR
- 30.7%
- Equity multiple
- 3.75×
- Total profit
- $46,162
- Equity at exit
- $5,179
Cash invested: $16,772 (down + closing). Projections, not guarantees.
Landlord ↔ Tenant lean methodology
- Overall (STATE)
- 62 Landlord-Friendly
- State Michigan
- 62 Landlord-Friendly · EVEN
- County
- — inherits STATE
- City
- — inherits STATE
ZIP-level market 48416
- Home prices YoY
- -16.8%
- Active inventory
- 43
- Price-to-rent
- 5.3×
Monthly cashflow live
- Estimated rent
- $950 medium interval (Pro) →
- Mortgage (P&I)
- −$314
- Tax from tax record
- −$13 /mo · $160/yr
- Insurance
- −$25
- HOA
- −$0
- Vacancy / Maint / Mgmt
- −$200
- Net cashflow
- $398
Break-even live
Sensitivity live
| Price | -10% $432 | -5% $415 | +0% $398 | +5% $381 | +10% $364 |
|---|---|---|---|---|---|
| Rent | -10% $323 | -5% $361 | +0% $398 | +5% $436 | +10% $473 |
| Rate | -1.0pp $428 | -0.5pp $413 | base $398 | +0.5pp $383 | +1.0pp $367 |
UW: 25.0% down · 7.5% · 30yr · 1.5% tax · 5.0% vac · 8.0% maint · 8.0% mgmt
Financing live
Cash to close
- Down payment
- $14,975
- Closing costs
- $1,797
- Reserves months
- —
- Total cash needed
- —
Loan-product check · same deal, 3 products live
Conventional
25% down · 7.5% · 30yr
- Down + closing
- —
- Monthly P&I
- —
- Monthly cashflow
- —
- DSCR
- —
- Eligible?
- —
Personal DTI + credit; lowest rate.
DSCR
20% down · 8.5% · 30yr
- Down + closing
- —
- Monthly P&I
- —
- Monthly cashflow
- —
- DSCR
- —
- Eligible?
- —
No personal income docs; deal must DSCR.
Hard money
10% down · 12.0% · 12mo
- Down + closing
- —
- Monthly P&I
- —
- Monthly cashflow
- —
- DSCR
- —
- Eligible?
- —
Short-term bridge; refi at stabilization.
Rent comps 1 comps
| Address | Beds | Baths | Sqft | Rent | $/sqft | DOM | Units | Dist |
|---|---|---|---|---|---|---|---|---|
| 7201 Maple Valley Rd Brown City, MI | 2.0 | 1.0 | 850 | $950 | $1.12 | 0d | 1 | 0.82mi |
Listing history 11 events
-
2026-06-07status $59,900 Pending 17 DOM
-
2026-06-04days on market $59,900 Active 17 DOM
-
2026-06-03days on market $59,900 Active 16 DOM
-
2026-06-02days on market $59,900 Active 15 DOM
-
2026-06-01days on market $59,900 Active 14 DOM
-
2026-05-31days on market $59,900 Active 13 DOM
-
2026-05-18$59,900 Active
Show marketing remark (787 chars)
CASH BUYERS ONLY--Attn: Investors, Landlords, Flippers---come check out this estate sale opportunity. This home needs some TLC inside and out but shows potential. It appears to have a newer roof and newer vinyl windows as well. Also has an updated 100amp electrical panel and newer HWH. Features a very private back yard that is fenced with newer vinyl fencing. House is heated by central wall furnace--no duct work. Has one small bedroom on first floor and two small bedrooms upstairs. Home does have a basement too. Warning there is mold present on some wood paneling in basement. House is sold as is with all contents on site included. No land contracts---cash offers only. Could be a great rental home or flip opportunity. FYI-Buyer to pay for the agent services they choose to hire.
-
2026-05-18$59,900 Active 787-char remark
Show marketing remark (787 chars)
CASH BUYERS ONLY--Attn: Investors, Landlords, Flippers---come check out this estate sale opportunity. This home needs some TLC inside and out but shows potential. It appears to have a newer roof and newer vinyl windows as well. Also has an updated 100amp electrical panel and newer HWH. Features a very private back yard that is fenced with newer vinyl fencing. House is heated by central wall furnace--no duct work. Has one small bedroom on first floor and two small bedrooms upstairs. Home does have a basement too. Warning there is mold present on some wood paneling in basement. House is sold as is with all contents on site included. No land contracts---cash offers only. Could be a great rental home or flip opportunity. FYI-Buyer to pay for the agent services they choose to hire.
-
2014-12-12soldstatus $18,000 229-char remark
Show marketing remark (229 chars)
Great opportunity on this 2 possibly, 3 bedroom home (room downstairs does not have a closet) located in walking distance to everything. Newer roof and water heater, some remodeling and updating has been done. Spacious back yard.
-
2014-11-25historical 229-char remark
Show marketing remark (229 chars)
Great opportunity on this 2 possibly, 3 bedroom home (room downstairs does not have a closet) located in walking distance to everything. Newer roof and water heater, some remodeling and updating has been done. Spacious back yard.
-
2014-10-20$24,900 229-char remark
Show marketing remark (229 chars)
Great opportunity on this 2 possibly, 3 bedroom home (room downstairs does not have a closet) located in walking distance to everything. Newer roof and water heater, some remodeling and updating has been done. Spacious back yard.
ⓘ Source: listings_history table (triggers on properties + properties_extension) + one-shot
backfill from property_details.listing_events for pre-trigger history.
Tax reassessment forecast MI · Partial reset (capped growth)
- Current annual tax
- $160 · $13/mo
- Projected year-2 tax
- $541 · $45/mo
- Expected delta
- +$381/yr (+$32/mo · 238.9%)
ⓘ Screening estimate from a state-policy table — verify with the county assessor before closing.
Climate risk First Street
- Flood 1/10 Low FEMA zone X (unshaded) · 0% chance over 30 yrs
- Wildfire 1/10 Low
- Heat 2/10 Low 7 d/yr ≥98°F today · 15 d/yr by 30 yrs out
- Wind 1/10 Low
- Air quality 3/10 Moderate 2 unhealthy d/yr today · 3 by 30 yrs out
Nearby sold comps map
Loading sold comps map…
Walkable amenities ~0.75 mi
Loading nearby amenities…
Taxation est. · year 1
- Rental income
- $11,400
- − Mortgage interest
- −$3,355
- − Property taxes
- −$160
- − Insurance
- −$300
- − Repairs & maintenance
- −$912
- − Management
- −$912
- − Depreciation
- −$1,743
- Taxable income
- $4,019
- Est. tax owed @ 24.0%
- −$965
- After-tax cash flow
- $3,813/yr
For passive investors: Depreciation is non-cash, so a rental often shows a tax loss while cash-flowing — sheltering income. Rental losses are passive: they offset passive income freely, and up to $25,000/yr can offset ordinary (W-2) income if you actively participate and your MAGI is under $100k (phasing out to $0 by $150k); unused losses carry forward. On sale, claimed depreciation is recaptured at up to 25%, and gains may owe capital-gains tax (a 1031 exchange can defer both). Figures are a year-1 estimate at your 24.0% rate — not tax advice; consult a CPA.
Schools (NCES district)
- District
- Brown City Community Schools
- NCES district ID
- 2607040
- Math proficiency
- 25% ▼ -8.00%
- Reading proficiency
- 39% ▼ -5.00%
- Median HH income
- $44,588
- Composite
- 27.29/100
- National rank
- #7002
- State rank
- #336 of 540 in MI
Livability — Brown City
- Score
- 63/100
- State rank
- #512
- US rank
- #15324
Category grades
Schools grade is shown separately in the Schools card above.
Census & demographics
- Census place
- Brown City, MI
- City population
- 5,216
- Population (ZIP)
- 5,216
Population outlook (Sanilac County) Hauer SSP2
- Today (2025)
- 37,948 people
- By 2030
- 35,772 · -5.7%
- By 2040
- 30,996 · -18.3%
- By 2050
- 26,280 · -30.7%
- By 2075
- 17,471 · -54.0%
- By 2100
- 10,572 · -72.1%
Race, ethnicity, and origin ACS 2023
- Neighborhood character
- Predominantly White (93%)
- Race & ethnicity
- White 93% Hispanic / Latino 4% Two or more races 3%
- Common ancestry
- Romanian 12% Lithuanian 2% Iranian 2%
- Foreign-born
- 2% · Canada
- Languages at home
- 89% English-only · German/W. Germanic 9% Spanish 1% Russian/Polish/Slavic 0%
Political lean MEDSL · Sanilac
- 2024 margin
- Solid R (+47.7) · D 25.5% · R 73.2% · Other 1.3%
- 2008→2024 swing
- -39.6pp toward R · 2008: -8.1pp · 2024: -47.7pp
- All cycles
- 2024: R+47.7 2020: R+45.6 2016: R+44.5 2012: R+20.4 2008: R+8.1
Not yet ingested
- Civics
- —
Market trends
- HPI YoY
- ▼ -41.42%
- Current HPI
- 205.2258
- Rent YoY
- —
- Metro
- —
- State GDP YoY
- ▲ 1.37%
- F500 in state
- 28
Industry mix (Fortune 500 HQ in MI)
| Industry | F500 HQs | Revenue |
|---|---|---|
| Automotive Parts | 3 | $48B |
|
||
| Automotive | 2 | $372B |
|
||
| Chemicals | 1 | $45B |
|
||
| Automotive Retail | 1 | $29B |
|
||
| Healthcare / Medical Devices | 1 | $23B |
|
||
| Automotive Technology | 1 | $20B |
|
||
Price history
+140.6% since first listed5 events — show timeline
- 2026-05-18 Listed $59,900 REALCOMP
- 2026-05-18 Listed $59,900 MiRealSource-MiMLS
- 2014-12-12 Sold (MLS) $18,000 MiRealSource-MiMLS
- 2014-11-25 Listing Removed — MiRealSource-MiMLS
- 2014-10-20 Listed $24,900 MiRealSource-MiMLS
Property tax history
-9.9%/yrLatest (2025): $160 · -76.2% YoY. Source: county tax records.
Cash-flow waterfall
monthlySold comps — $/sqft
last 12 mo · ≤1 miLoading sold comps…