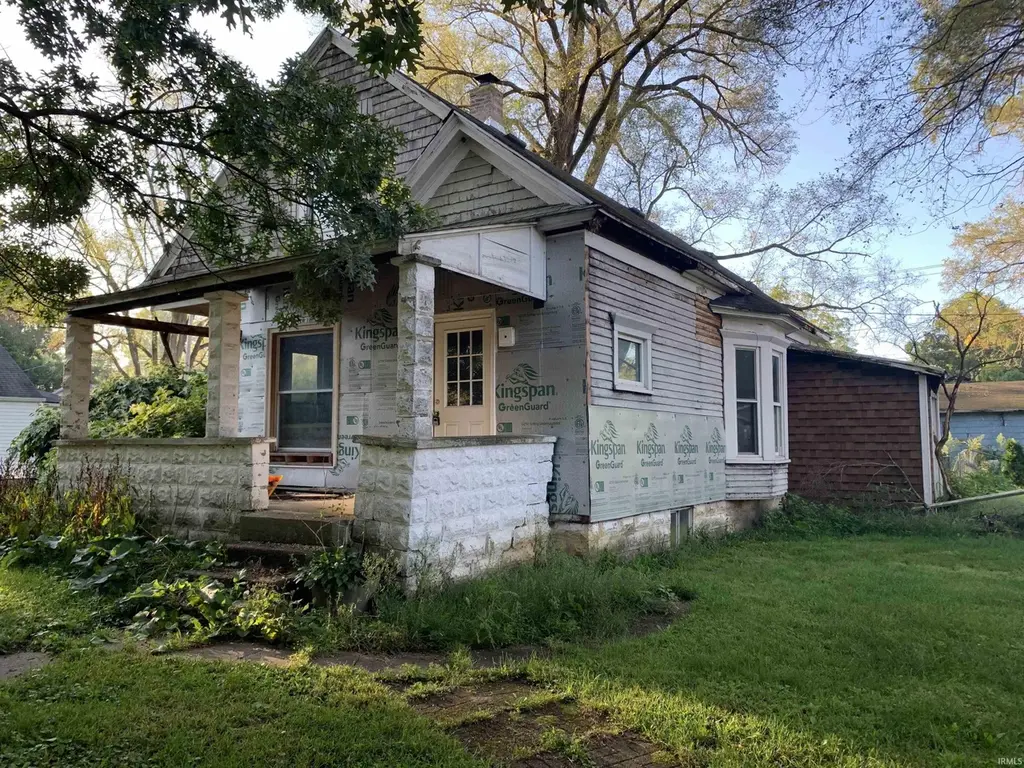
307 E Goshen Rd · Osceola, IN
Flood risk 4/10 · Minor
- FEMA flood zone
- X (unshaded)
- Chance of flooding over 30 yrs
- 0.22%
- Est. flood insurance / yr
- $473 – $860
Fire risk 1/10 · Minimal
- Est. fire insurance / yr
- $717 – $1,331
Heat risk 2/10 · Minimal
- Hot days now (above 101°F)
- 7 days/yr
- Hot days in 30 yrs
- 16 days/yr
Wind risk 2/10 · Minimal
- Chance of severe wind over 30 yrs
- —
Air-quality risk 3/10 · Minor
- Unhealthy air days now
- 2 days/yr
- Unhealthy air days in 30 yrs
- 3 days/yr
Risk factors via First Street. Map © Google.
Why this score? — see what drove the B+ grade
The composite is a weighted blend of 9 inputs, each scored 0–100. Each bar is that input's sub-score; the figure is the points it added to the 100-point composite (weight × sub-score).
- Cash flow +30.0/30.0
- ARV discount +15.0/15.0
- DSCR +10.0/10.0
- 1% rule +9.6/10.0
- Schools +5.1/10.0
- Livability +3.5/5.0
- Rent growth +2.5/5.0
- Condition / age +2.5/5.0
- Appreciation +0.0/10.0
$110,000
🖨 Deal sheet 📄 Offer letter ✓ Due diligence
Listing remarks MLS
* Seller financing available * This 3-bedroom, 1-bath home is an excellent investment property with much of the interior work already completed. Inside, you’ll find updated spaces that are well on their way to being move-in ready, making this a great head start for investors. The exterior still needs some attention, giving you the perfect chance to add value and increase curb appeal. Conveniently located near local amenities and schools. This property is ideal for anyone looking to finish a project and unlock its full potential. See agent remarks.
Key facts
- Near schools
- Local amenities
- Updated spaces
Tags
Neighborhood map
What this means for you Summary
Snapshot
- This is a 3-bed/1.0-bath single-family listed at $110k.
Deal economics
- At list price, monthly cash flow is $593 ($7k/yr) — positive.
- The deal already cash-flows at list — no discount required.
- Meets the 1% rule at list price ($2k rent vs $110k).
- Recommended offer: $97k (12.0% below list) — sets the bar for market timing.
- Cap rate 12.8% vs local median 3.4% in Osceola — top-decile yield for the area; either an underpriced asset or a hidden risk that comps aren't pricing in. Stress-test before assuming the spread holds.
Location & tenants
- Location reads 70/100 on livability (#144 in IN) — a middle-class / working-renter tenant base. Strengths: crime A+, cost of living A+, housing A+; Watch: amenities F, commute F, health & safety D-.
- Penn-Harris-Madison School Corporation (suburban): math 54% / reading 64% proficiency, ranked #19 of 301 in IN (top 6%) — acceptable for families but not a draw, mixed tenant base, ~2y average lease.
- Market conditions: 112 active listings in the ZIP; 754 units permitted in St. Joseph County in 2024 (460 in 5+ unit buildings).
Forward outlook
- Local home prices are declining (-3.0%/yr); year-one equity from $761 of loan paydown is wiped out by about $3k of value loss. Plan a longer hold.
- At projected returns (-3.0% appreciation + 3.0% rent growth), your $31k cash investment doubles in ~6 years — after that, you're playing with house money.
Negotiation context
- It's been on market 286 days — a 12% lower offer ($97k) is reasonable based on typical stale-listing flexibility.
- 4 sale attempts since 2y ago; this cycle's ask has dropped $10k (8%) from the opening price — seller is motivated, your offer sets the floor, not the list.
Risks & watch-outs
- Watch-outs: built in 1899 — expect roof / HVAC / electrical / plumbing capex.
Questions for the listing agent
- It's been on market 286 days. Have you received any prior offers? Is the seller open to a 12% concession, seller financing, or rate buy-down credit?
- Built in 1899 — when were the roof, HVAC, electrical panel, plumbing, and water heater last replaced?
- Why hasn't it sold? Are there any deal-killer items the seller is aware of (foundation, flood, title, zoning, code violations)?
- Is there a deadline driving the sale (1031 exchange, divorce, estate, relocation)? That informs how much negotiation room exists.
- What's the average days-on-market for RENTAL listings here right now (not sales)? A rising rental-DOM trend means longer vacancies and softer asking-rent achievability than the comps imply.
- What's the recent tenant-quality profile in this submarket — average credit score on applications, eviction rate, late-payment / NSF rate, and stable-employment percentage? A property-management company in the area should have these aggregated.
- How much new for-sale + rental construction is in the pipeline within 1–3 miles? Heavy new supply typically softens prices + rents 12–24 months out; constrained supply supports both.
Investment metrics
- 1% rule
- 1.46% ✓
- Cap rate
- 12.76%
- Cash-on-cash
- 23.10%
- DSCR
- 2.03
- GRM
- 5.7
CMA / ARV
- ARV (median comp)
- $190,298
- List price
- $110,000
- Delta
- -42.20%
- Verdict
- UNDERPRICED
- Comps
- 20 within 1.0 mi
Show comp detail 12 sales within ~0.75 mi
| Address | Dist | Beds/Ba | Sqft | Sold | Price | $/sf | Match |
|---|---|---|---|---|---|---|---|
| 310 E Adams St | 0.17mi | 3/2.0 | 1,818 (+11%) | 6mo | $259,000 | $142 | 65 |
| 418 W Superior St | 0.43mi | 3/2.0 | 1,752 (+7%) | 5mo | $237,000 | $135 | 60 |
| 10425 Appletree Ln | 0.58mi | 3/2.0 | 1,641 (-0%) | 11mo | $195,000 | $119 | 59 |
| 57006 Ash Rd | 0.43mi | 3/2.0 | 1,502 (-8%) | 3mo | $354,000 | $236 | 59 |
| 56968 Ash Rd | 0.44mi | 3/2.0 | 1,502 (-8%) | 7mo | $345,000 | $230 | 55 |
| 10310 Lindwood Ct | 0.71mi | 3/2.0 | 1,636 (-0%) | 11mo | $315,000 | $193 | 54 |
| 304 S Beech Rd | 0.68mi | 3/1.5 | 1,588 (-3%) | 9mo | $250,000 | $157 | 53 |
| 601 W Superior St | 0.53mi | 3/1.0 | 1,462 (-11%) | 9mo | $190,000 | $130 | 50 |
| 30627 County Road 20 | 0.63mi | 3/2.5 | 1,724 (+5%) | 10mo | $263,000 | $153 | 48 |
| 57792 Pendleton Dr | 0.73mi | 3/2.5 | 1,780 (+8%) | 2mo | $290,000 | $163 | 44 |
| 57738 Pendleton Dr | 0.70mi | 4/3.0 (+1) | 1,659 (+1%) | 13mo | $275,000 | $166 | 42 |
| 30715 Mary Don Ln | 0.65mi | 3/2.0 | 1,430 (-13%) | 4mo | $340,000 | $238 | 41 |
Match score weights: distance 35% · size 25% · config 20% · recency 20%. Top-matched comps best support the ARV.
Projected returns pro-forma
-3.0% appreciation · 3.0% rent growth · sell at horizon
- IRR
- 16.1%
- Equity multiple
- 1.65×
- Total profit
- $19,907
- Equity at exit
- $16,401
- IRR
- 24.7%
- Equity multiple
- 3.14×
- Total profit
- $65,851
- Equity at exit
- $9,511
Cash invested: $30,800 (down + closing). Projections, not guarantees.
Landlord ↔ Tenant lean methodology
- Overall (STATE)
- 90 Strongly Landlord-Friendly
- State Indiana
- 90 Strongly Landlord-Friendly · R+11
- County
- — inherits STATE
- City
- — inherits STATE
ZIP-level market 46561
- Home prices YoY
- -27.2%
- Active inventory
- 112
- Price-to-rent
- 5.7×
Monthly cashflow live
- Estimated rent
- $1,611 medium interval (Pro) →
- Mortgage (P&I)
- −$577
- Tax from tax record
- −$57 /mo · $688/yr
- Insurance
- −$46
- HOA
- −$0
- Vacancy / Maint / Mgmt
- −$338
- Net cashflow
- $593
Break-even live
UW: 25.0% down · 7.5% · 30yr · 1.5% tax · 5.0% vac · 8.0% maint · 8.0% mgmt
Financing live
Cash to close
- Down payment
- $27,500
- Closing costs
- $3,300
- Reserves months
- —
- Total cash needed
- —
Loan-product check · same deal, 3 products live
Conventional
25% down · 7.5% · 30yr
- Down + closing
- —
- Monthly P&I
- —
- Monthly cashflow
- —
- DSCR
- —
- Eligible?
- —
Personal DTI + credit; lowest rate.
DSCR
20% down · 8.5% · 30yr
- Down + closing
- —
- Monthly P&I
- —
- Monthly cashflow
- —
- DSCR
- —
- Eligible?
- —
No personal income docs; deal must DSCR.
Hard money
10% down · 12.0% · 12mo
- Down + closing
- —
- Monthly P&I
- —
- Monthly cashflow
- —
- DSCR
- —
- Eligible?
- —
Short-term bridge; refi at stabilization.
Listing history 20 events
-
2026-06-18days on market $110,000 Active 286 DOM
-
2026-06-17days on market $110,000 Active 285 DOM
-
2026-06-16days on market $110,000 Active 284 DOM
-
2026-06-15days on market $110,000 Active 283 DOM
-
2026-06-14days on market $110,000 Active 281 DOM
-
2026-06-13days on market $110,000 Active 280 DOM
-
2026-06-10days on market $110,000 Active 278 DOM
-
2026-06-09days on market $110,000 Active 277 DOM
-
2026-06-08days on market $110,000 Active 276 DOM
-
2026-06-07days on market $110,000 Active 275 DOM
-
2026-06-02days on market $110,000 Active 270 DOM
-
2026-06-01days on market $110,000 Active 269 DOM
-
2026-05-31days on market $110,000 Active 268 DOM
-
2026-05-30days on market $110,000 Active 267 DOM
-
2026-05-19status Active 560-char remark
Show marketing remark (560 chars)
* Seller financing available * This 3-bedroom, 1-bath home is an excellent investment property with much of the interior work already completed. Inside, you’ll find updated spaces that are well on their way to being move-in ready, making this a great head start for investors. The exterior still needs some attention, giving you the perfect chance to add value and increase curb appeal. Conveniently located near local amenities and schools. This property is ideal for anyone looking to finish a project and unlock its full potential. See agent remarks.
-
2026-03-17status Active 560-char remark
Show marketing remark (560 chars)
* Seller financing available * This 3-bedroom, 1-bath home is an excellent investment property with much of the interior work already completed. Inside, you’ll find updated spaces that are well on their way to being move-in ready, making this a great head start for investors. The exterior still needs some attention, giving you the perfect chance to add value and increase curb appeal. Conveniently located near local amenities and schools. This property is ideal for anyone looking to finish a project and unlock its full potential. See agent remarks.
-
2026-01-30historical Active Under Contract 560-char remark
Show marketing remark (560 chars)
* Seller financing available * This 3-bedroom, 1-bath home is an excellent investment property with much of the interior work already completed. Inside, you’ll find updated spaces that are well on their way to being move-in ready, making this a great head start for investors. The exterior still needs some attention, giving you the perfect chance to add value and increase curb appeal. Conveniently located near local amenities and schools. This property is ideal for anyone looking to finish a project and unlock its full potential. See agent remarks.
-
2025-10-27price $115,000 560-char remark
Show marketing remark (560 chars)
* Seller financing available * This 3-bedroom, 1-bath home is an excellent investment property with much of the interior work already completed. Inside, you’ll find updated spaces that are well on their way to being move-in ready, making this a great head start for investors. The exterior still needs some attention, giving you the perfect chance to add value and increase curb appeal. Conveniently located near local amenities and schools. This property is ideal for anyone looking to finish a project and unlock its full potential. See agent remarks.
-
2025-09-05$120,000 Active 560-char remark
Show marketing remark (560 chars)
* Seller financing available * This 3-bedroom, 1-bath home is an excellent investment property with much of the interior work already completed. Inside, you’ll find updated spaces that are well on their way to being move-in ready, making this a great head start for investors. The exterior still needs some attention, giving you the perfect chance to add value and increase curb appeal. Conveniently located near local amenities and schools. This property is ideal for anyone looking to finish a project and unlock its full potential. See agent remarks.
-
2024-11-16$159,000 Active
ⓘ Source: listings_history table (triggers on properties + properties_extension) + one-shot
backfill from property_details.listing_events for pre-trigger history.
Tax reassessment forecast IN · Partial reset (capped growth)
- Current annual tax
- $688 · $57/mo
- Projected year-2 tax
- $812 · $68/mo
- Expected delta
- +$124/yr (+$10/mo · 18.0%)
ⓘ Screening estimate from a state-policy table — verify with the county assessor before closing.
Climate risk First Street
- Flood 4/10 Moderate FEMA zone X (unshaded) · 22% chance over 30 yrs
- Wildfire 1/10 Low
- Heat 2/10 Low 7 d/yr ≥101°F today · 16 d/yr by 30 yrs out
- Wind 2/10 Low
- Air quality 3/10 Moderate 2 unhealthy d/yr today · 3 by 30 yrs out
Nearby sold comps map
Loading sold comps map…
Walkable amenities ~0.75 mi
Loading nearby amenities…
Taxation est. · year 1
- Rental income
- $19,334
- − Mortgage interest
- −$6,162
- − Property taxes
- −$688
- − Insurance
- −$550
- − Repairs & maintenance
- −$1,547
- − Management
- −$1,547
- − Depreciation
- −$3,200
- Taxable income
- $5,641
- Est. tax owed @ 24.0%
- −$1,354
- After-tax cash flow
- $5,760/yr
For passive investors: Depreciation is non-cash, so a rental often shows a tax loss while cash-flowing — sheltering income. Rental losses are passive: they offset passive income freely, and up to $25,000/yr can offset ordinary (W-2) income if you actively participate and your MAGI is under $100k (phasing out to $0 by $150k); unused losses carry forward. On sale, claimed depreciation is recaptured at up to 25%, and gains may owe capital-gains tax (a 1031 exchange can defer both). Figures are a year-1 estimate at your 24.0% rate — not tax advice; consult a CPA.
Schools (NCES district)
- District
- Penn-Harris-Madison School Corporation
- NCES district ID
- 1808760
- Math proficiency
- 54% ▼ -11.00%
- Reading proficiency
- 64% ▼ -6.00%
- Median HH income
- $59,421
- Composite
- 51.11/100
- National rank
- #1764
- State rank
- #19 of 301 in IN
Livability — Osceola
- Score
- 70/100
- State rank
- #144
- US rank
- #7375
Category grades
Schools grade is shown separately in the Schools card above.
Census & demographics
- Census place
- Osceola, IN
- City population
- 14,499
- Population (ZIP)
- 14,499
Population outlook (St. Joseph County) Hauer SSP2
- Today (2025)
- 273,186 people
- By 2030
- 273,594 · +0.1%
- By 2040
- 271,641 · -0.6%
- By 2050
- 269,187 · -1.5%
- By 2075
- 263,136 · -3.7%
- By 2100
- 245,659 · -10.1%
Race, ethnicity, and origin ACS 2023
- Neighborhood character
- Predominantly White (87%)
- Race & ethnicity
- White 87% Hispanic / Latino 9% Two or more races 7% Black 2% Asian 1%
- Hispanic origin (detail)
- Mexican 4% Puerto Rican 4%
- Common ancestry
- Romanian 5% Italian 2% Lithuanian 1%
- Foreign-born
- 3% · Canada
- Languages at home
- 95% English-only · Spanish 3% Arabic 1% Korean 1%
Political lean MEDSL · St. Joseph
- 2024 margin
- Toss-up / Even · D 50.0% · R 48.5% · Other 1.5%
- 2008→2024 swing
- -15.6pp toward R · 2008: 17.1pp · 2024: 1.5pp
- All cycles
- 2024: D+1.5 2020: D+5.8 2016: D+0.2 2012: D+3.5 2008: D+17.1
Not yet ingested
- Civics
- —
Market trends
- HPI YoY
- ▼ -81.38%
- Current HPI
- 217.644
- Rent YoY
- —
- Metro
- —
- State GDP YoY
- ▲ 2.90%
- F500 in state
- 18
Industry mix (Fortune 500 HQ in IN)
| Industry | F500 HQs | Revenue |
|---|---|---|
| Industrial Machinery | 2 | $37B |
|
||
| Healthcare | 1 | $177B |
|
||
| Pharmaceuticals | 1 | $45B |
|
||
| Metals / Steel | 1 | $18B |
|
||
| Agriculture | 1 | $17B |
|
||
| Packaging | 1 | $12B |
|
||
Price history
-27.7% since first listed6 events — show timeline
- 2026-05-19 Relisted — IRMLS
- 2026-03-17 Relisted — IRMLS
- 2026-01-30 Contingent — IRMLS
- 2025-10-27 Price Changed $115,000 IRMLS
- 2025-09-05 Listed $120,000 IRMLS
- 2024-11-16 Listed $159,000 IRMLS
Property tax history
+9.8%/yrLatest (2023): $688 · -58.4% YoY. Source: county tax records.
Cash-flow waterfall
monthlySold comps — $/sqft
last 12 mo · ≤1 miLoading sold comps…