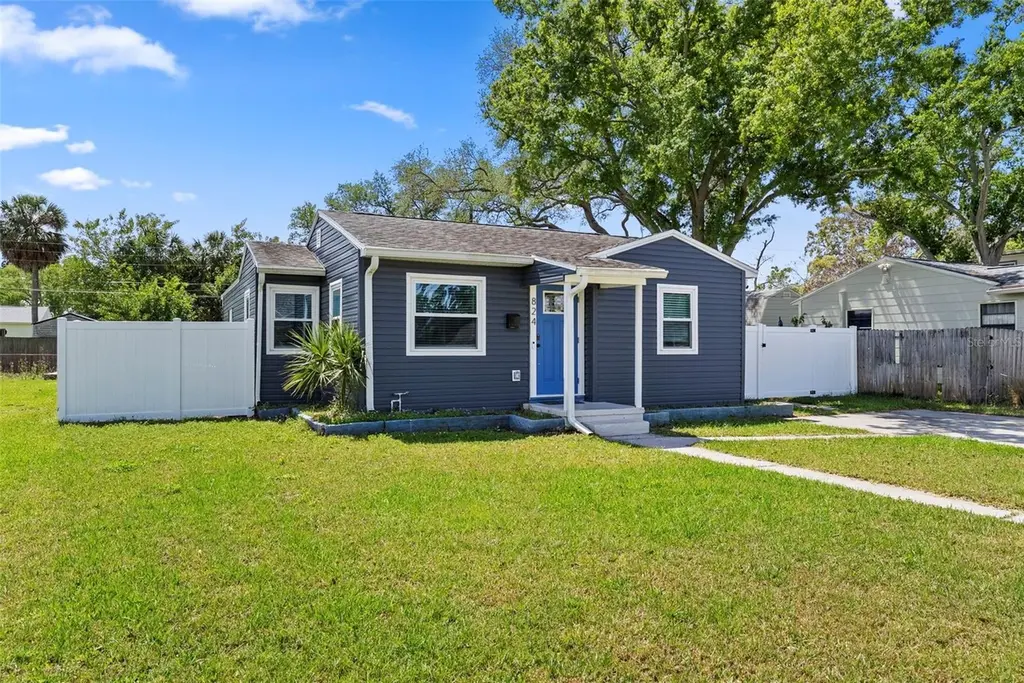
824 61st Ave NE · St. Petersburg, FL
Flood risk 10/10 · Severe
- FEMA flood zone
- AE
- Chance of flooding over 30 yrs
- 0.99%
- Est. flood insurance / yr
- $1,737 – $8,500
Fire risk 2/10 · Minimal
- Est. fire insurance / yr
- $947 – $1,759
Heat risk 10/10 · Severe
- Hot days now (above 106°F)
- 7 days/yr
- Hot days in 30 yrs
- 27 days/yr
Wind risk 10/10 · Severe
- Chance of severe wind over 30 yrs
- 99.0%
Air-quality risk 3/10 · Minor
- Unhealthy air days now
- 2 days/yr
- Unhealthy air days in 30 yrs
- 3 days/yr
Risk factors via First Street. Map © Google.
Why this score? — see what drove the C grade
The composite is a weighted blend of 9 inputs, each scored 0–100. Each bar is that input's sub-score; the figure is the points it added to the 100-point composite (weight × sub-score).
- Cash flow +20.9/30.0
- ARV discount +14.1/15.0
- DSCR +6.7/10.0
- 1% rule +5.0/10.0
- Schools +4.3/10.0
- Rent growth +3.1/5.0
- Livability +2.5/5.0
- Condition / age +2.5/5.0
- Appreciation +0.0/10.0
$319,000
🖨 Deal sheet (PDF) 📄 Offer letter ✓ Due diligence
Listing remarks MLS
Need an Oasis in a beautiful city? This charming cottage in the heart of Northeast St. Petersburg has a lot to offer. The property is located within a short distance of Jack Puryear Park, Mangrove Bay Golf Course and several other parks. Enjoy barbecues and community on the new composite deck overlooking a peaceful fully fenced back yard. The original hardwood floors and updated kitchen are sure to make you feel at home. Wind resistent Windows and French doors were replaced February of 2020. Prepare yourself to be wowed by this vintage gem in such a prime location.
Key facts
- 7,536 sq ft lot
- Built 1950
- Listed 65 days
Property features AI
Finance
- Other: Homestead exemption indicated; Property is unfurnished; Pets allowed
- HOA & community: No homeowners association
Exterior
- Utilities: Public water; Public sewer; Electricity connected; Cable connected
- Home design: Single family residence; One story; Faces northwest
- Construction: Block and vinyl siding construction; Shingle roof; Crawlspace and slab foundation; Built on 0.17-acre lot
- Exterior features: Porch; Shed(s); Chain link, vinyl and wood fencing; Asphalt road access
Interior
- Kitchen: Built-in oven; Range; Dishwasher; Disposal; Refrigerator; Electric water heater
- Bedrooms: 3 bedrooms
- Bathrooms: 1 full bathroom; 1 half bathroom
- Heating & cooling: Central heating; Central air conditioning
- Interior features: Ceiling fans; Crown molding; Split bedroom floor plan; Stone counters; Thermostat; Window treatments; Aluminum frame and insulated windows; French doors; Storage
- Laundry & utility: Laundry inside
Neighborhood map
What this means for you Summary
Snapshot
- This is a 3-bed/1.0-bath single-family listed at $319k.
Deal economics
- At list price, monthly cash flow is $18 ($215/yr) — positive.
- The deal already cash-flows at list — no discount required.
- To meet the 1% rule (rent ≥ 1% of price), the offer needs to be $318k (0.2% below list).
- Recommended offer: $300k (6.0% below list) — sets the bar for market timing.
- Cap rate 8.0% vs local median 2.6% in St. Petersburg — top-decile yield for the area; either an underpriced asset or a hidden risk that comps aren't pricing in. Stress-test before assuming the spread holds.
Location & tenants
- Location reads: area grade C — affects rentability + tenant quality, not the cash-flow math above.
- Pinellas (suburban): math 51% / reading 51% proficiency, ranked #31 of 73 in FL (top 42%) — acceptable for families but not a draw, mixed tenant base, ~2y average lease.
- Zoned schools: Shore Acres Elementary School (math 61% / reading 52%, grade C+, #816 of 2,144 statewide, top 39%, 709 students, 46% FRL); Meadowlawn Middle School (math 29% / reading 30%, grade F, #469 of 571 statewide, top 84%, 832 students, 69% FRL); Northeast High School (math 35% / reading 47%, grade F, #289 of 667 statewide, top 44%, 1,736 students, 50% FRL).
- Market conditions: Rents rising (+2.2%/yr); 457 active listings in the ZIP; 40 comparable units currently listed for rent nearby; rentals leasing fast (median 6d on market — plan ~1-2 weeks tenant-placement turnaround); solid renter incomes; 2,676 units permitted in Pinellas County in 2024 (1,422 in 5+ unit buildings).
- This rent runs 40% of the median local income ($95k/yr) — at the standard rent-burdened threshold; future hikes will face affordability resistance.
Forward outlook
- Local home prices are declining (-3.0%/yr); year-one equity from $2k of loan paydown is wiped out by about $10k of value loss. Plan a longer hold.
- Pinellas County population projected at +14% by 2050 — modest demand growth; plan on rents tracking national, not racing it.
Negotiation context
- It's been on market 66 days — a 6% lower offer ($300k) is reasonable based on typical stale-listing flexibility.
- 3 sale attempts since 20y ago; this cycle's ask has dropped $30k (9%) from the opening price — seller is motivated, your offer sets the floor, not the list.
- Current owner paid $268k; 19% above their basis — modest negotiation headroom, anchor on the comps not their cost.
Risks & watch-outs
- Watch-outs: flood insurance adds $427/mo; built in 1950 — expect roof / HVAC / electrical / plumbing capex.
- Climate carrying-cost: in FEMA flood zone AE (mandatory federal flood insurance); severe wind risk, 99% chance of damaging wind over 30y; extreme-heat days projected 7→27/yr by 2055 (HVAC capex compounding) — expect insurance premiums to compound above CPI over the hold.
Questions for the listing agent
- It's been on market 66 days. Have you received any prior offers? Is the seller open to a 6% concession, seller financing, or rate buy-down credit?
- Built in 1950 — when were the roof, HVAC, electrical panel, plumbing, and water heater last replaced?
- What's the actual annual flood-insurance premium (NFIP or private), and is the property in a SFHA with mandatory coverage?
- Why hasn't it sold? Are there any deal-killer items the seller is aware of (foundation, flood, title, zoning, code violations)?
- Is there a deadline driving the sale (1031 exchange, divorce, estate, relocation)? That informs how much negotiation room exists.
- What's the average days-on-market for RENTAL listings here right now (not sales)? A rising rental-DOM trend means longer vacancies and softer asking-rent achievability than the comps imply.
- What's the recent tenant-quality profile in this submarket — average credit score on applications, eviction rate, late-payment / NSF rate, and stable-employment percentage? A property-management company in the area should have these aggregated.
- How much new for-sale + rental construction is in the pipeline within 1–3 miles? Heavy new supply typically softens prices + rents 12–24 months out; constrained supply supports both.
Investment metrics
- 1% rule
- 1.00% ✗
- Cap rate
- 7.96%
- Cash-on-cash
- 5.97%
- DSCR
- 1.27
- GRM
- 8.3
CMA / ARV
- ARV (on-the-fly)
- $374,060
- Comps found
- 12
Show comp detail 12 sales within ~0.75 mi
| Address | Dist | Beds/Ba | Sqft | Sold | Price | $/sf | Match |
|---|---|---|---|---|---|---|---|
| 780 62nd Ave NE | 0.08mi | 3/1.0 | 1,284 (+1%) | 3mo | $231,000 | $180 | 92 |
| 732 62nd Ave NE | 0.14mi | 4/2.0 (+1) | 1,277 (+1%) | 10mo | $243,000 | $190 | 74 |
| 251 Davison Ave NE | 0.52mi | 3/1.5 | 1,323 (+4%) | 1mo | $395,000 | $299 | 66 |
| 423 61st Ave NE | 0.36mi | 2/1.0 (-1) | 1,332 (+5%) | 4mo | $215,000 | $161 | 66 |
| 474 Dawson Ave NE | 0.44mi | 3/2.0 | 1,227 (-3%) | 6mo | $379,000 | $309 | 65 |
| 5730 16th Ln NE | 0.66mi | 3/2.0 | 1,190 (-6%) | 2mo | $462,000 | $388 | 53 |
| 780 58th Ave NE | 0.19mi | 4/2.0 (+1) | 1,420 (+12%) | 13mo | $225,000 | $158 | 51 |
| 565 55th Ave NE | 0.47mi | 3/2.0 | 1,430 (+13%) | 2mo | $422,000 | $295 | 51 |
| 5517 Pershing St NE | 0.55mi | 2/2.0 (-1) | 1,170 (-8%) | 2mo | $340,000 | $291 | 51 |
| 433 Hampton Ave NE | 0.34mi | 4/2.0 (+1) | 1,396 (+10%) | 13mo | $217,200 | $156 | 48 |
| 486 Genoa Cir NE | 0.53mi | 3/2.0 | 1,438 (+13%) | 5mo | $560,000 | $389 | 44 |
| 5700 Bay St NE | 0.64mi | 3/2.0 | 1,400 (+10%) | 13mo | $425,000 | $304 | 38 |
Match score weights: distance 35% · size 25% · config 20% · recency 20%. Top-matched comps best support the ARV.
Projected returns pro-forma
-3.0% appreciation · 2.21% rent growth · sell at horizon
- IRR
- -16.8%
- Equity multiple
- 0.41×
- Total profit
- $-52,834
- Equity at exit
- $47,564
- IRR
- -10.2%
- Equity multiple
- 0.40×
- Total profit
- $-53,753
- Equity at exit
- $27,581
Cash invested: $89,320 (down + closing). Projections, not guarantees.
Landlord ↔ Tenant lean methodology
- Overall (STATE)
- 87 Strongly Landlord-Friendly
- State Florida
- 87 Strongly Landlord-Friendly · R+3
- County
- — inherits STATE
- City
- — inherits STATE
ZIP-level market 33703
- Rents YoY
- 2.2%
- Active inventory
- 457
- Price-to-rent
- 8.3×
Monthly cashflow live
- Estimated rent
- $3,184 high interval (Pro) →
- Mortgage (P&I)
- −$1,673
- Tax from tax record
- −$265 /mo · $3,180/yr
- Insurance
- −$133
- Flood insurance flood zone
- −$427 /mo · $5,118/yr
- HOA
- −$0
- Vacancy / Maint / Mgmt
- −$669
- Net cashflow
- $18
Break-even live
Sensitivity live
| Price | -10% $198 | -5% $108 | +0% $18 | +5% $-72 | +10% $-163 |
|---|---|---|---|---|---|
| Rent | -10% $-234 | -5% $-108 | +0% $18 | +5% $144 | +10% $269 |
| Rate | -1.0pp $179 | -0.5pp $99 | base $18 | +0.5pp $-65 | +1.0pp $-149 |
UW: 25.0% down · 7.5% · 30yr · 1.5% tax · 5.0% vac · 8.0% maint · 8.0% mgmt
Financing live
Cash to close
- Down payment
- $79,750
- Closing costs
- $9,570
- Reserves months
- —
- Total cash needed
- —
Loan-product check · same deal, 3 products live
Conventional
25% down · 7.5% · 30yr
- Down + closing
- —
- Monthly P&I
- —
- Monthly cashflow
- —
- DSCR
- —
- Eligible?
- —
Personal DTI + credit; lowest rate.
DSCR
20% down · 8.5% · 30yr
- Down + closing
- —
- Monthly P&I
- —
- Monthly cashflow
- —
- DSCR
- —
- Eligible?
- —
No personal income docs; deal must DSCR.
Hard money
10% down · 12.0% · 12mo
- Down + closing
- —
- Monthly P&I
- —
- Monthly cashflow
- —
- DSCR
- —
- Eligible?
- —
Short-term bridge; refi at stabilization.
Rent comps 40 comps
| Address | Beds | Baths | Sqft | Rent | $/sqft | DOM | Units | Dist |
|---|---|---|---|---|---|---|---|---|
| 517 Hampton Ave NE St Petersburg, FL | 3.0 | 2.0 | 896 | $2,950 | $3.29 | 26d | 1 | 0.29mi |
| 5516 Pine Cir NE Saint Petersburg, FL | 3.0 | 1.0 | 1205 | $2,500 | $2.07 | 6d | 1 | 0.41mi |
| 5925 1st St NE Saint Petersburg, FL | 3.0 | 2.0 | 1510 | $2,799 | $1.85 | 6d | 1 | 0.63mi |
| 525 Moreno Cir NE Saint Petersburg, FL | 3.0 | 2.0 | 1587 | $3,500 | $2.21 | 16d | 1 | 0.66mi |
| 6016 18th St NE Saint Petersburg, FL | 4.0 | 2.0 | 1692 | $3,900 | $2.30 | 6d | 1 | 0.72mi |
| 1640 Cape Hope Ave NE #4 Saint Petersburg, FL | 4.0 | 3.0 | 1610 | $3,400 | $2.11 | 26d | 1 | 0.75mi |
| 4920 Locust St NE St. Petersburg, FL | 2.0 | 2.0 | 1035 | $1,825 | $1.76 | 26d | 1 | 0.76mi |
| 617 Segovia Ct NE Saint Petersburg, FL | 2.0 | 2.5 | 1420 | $2,950 | $2.08 | 26d | 1 | 0.77mi |
| 4843 Napoli Ct NE Saint Petersburg, FL | 2.0 | 2.5 | 1210 | $3,000 | $2.48 | 0d | 1 | 0.79mi |
| 5923 19th St NE Saint Petersburg, FL | 3.0 | 2.0 | 1336 | $3,500 | $2.62 | 6d | 1 | 0.80mi |
| 5923 19th St NE Saint Petersburg, FL | 3.0 | 2.0 | 1335 | $3,299 | $2.47 | 0d | 1 | 0.80mi |
| 5840 Tanglewood Dr NE Saint Petersburg, FL | 4.0 | 3.0 | 1680 | $3,150 | $1.88 | 6d | 1 | 0.82mi |
| 6060 Denver St NE Saint Petersburg, FL | 3.0 | 2.0 | 1523 | $3,950 | $2.59 | 6d | 1 | 0.87mi |
| 375 54th Ter N St. Petersburg, FL | 1.0–2.0 | 1.0–2.0 | 966 | $3,284 | $3.40 | 0d | 13 | 0.89mi |
| 5510 Bayou Grande Blvd NE Saint Petersburg, FL | 3.0 | 2.0 | 1232 | $2,750 | $2.23 | 18d | 1 | 1.00mi |
| 4681 1st St NE #209 Saint Petersburg, FL | 2.0 | 2.0 | 1120 | $2,100 | $1.88 | 0d | 1 | 1.05mi |
| 5541 Bayou Grande Blvd NE Saint Petersburg, FL | 3.0 | 2.0 | 1532 | $5,000 | $3.26 | 6d | 1 | 1.06mi |
| 5541 Bayou Grande Blvd NE Saint Petersburg, FL | 3.0 | 2.0 | 1532 | $5,000 | $3.26 | 3d | 1 | 1.06mi |
| 1733 Bayou Grande Blvd NE Saint Petersburg, FL | 2.0 | 1.0 | 1735 | $4,750 | $2.74 | 26d | 1 | 1.08mi |
| 120 47th Ave N Saint Petersburg, FL | 1.0–2.0 | 1.0–2.0 | 914 | $1,999 | $2.19 | 4d | 8 | 1.09mi |
| 4651 1st St NE #306 Saint Petersburg, FL | 2.0 | 2.0 | 1120 | $2,900 | $2.59 | 6d | 1 | 1.09mi |
| 1739 Bayou Grande Blvd NE St Petersburg, FL | 3.0 | 2.0 | 1658 | $5,500 | $3.32 | 5d | 1 | 1.10mi |
| 111 73rd Ave N Saint Petersburg, FL | 3.0 | 1.0–1.5 | 695 | $2,225 | $3.20 | 26d | 1 | 1.11mi |
| 1070 Sanabel Ct NE Saint Petersburg, FL | 3.0 | 3.0 | 1804 | $4,500 | $2.49 | 26d | 1 | 1.14mi |
| 620 62nd Ave N #1110 Saint Petersburg, FL | 2.0 | 1.0 | 884 | $1,700 | $1.92 | 0d | 1 | 1.15mi |
| 411 42nd Ave NE Saint Petersburg, FL | 3.0 | 2.0 | 1365 | $3,500 | $2.56 | 19d | 1 | 1.19mi |
| 617 52nd Ave N Saint Petersburg, FL | 3.0 | 2.5 | 1481 | $3,250 | $2.19 | 6d | 1 | 1.22mi |
| 5185 6th Way N St Petersburg, FL | 3.0 | 2.5 | 1480 | $3,150 | $2.13 | 6d | 1 | 1.24mi |
| 379 79th Ave NE Unit 334 1 St. Petersburg, FL | 2.0 | 1.0 | 915 | $1,600 | $1.75 | 26d | 1 | 1.24mi |
| 628 51st Ave N Saint Petersburg, FL | 3.0 | 2.5 | 1480 | $2,800 | $1.89 | 5d | 1 | 1.26mi |
| 541 40th Ave NE Saint Petersburg, FL | 3.0 | 1.0 | 1630 | $3,000 | $1.84 | 26d | 1 | 1.28mi |
| 233 41st Ave NE Saint Petersburg, FL | 3.0 | 1.0 | 920 | $2,245 | $2.44 | 0d | 1 | 1.28mi |
| 200 78th Ave N Saint Petersburg, FL | 1.0–3.0 | 1.0 | 810 | $2,035 | $2.51 | 6d | 1 | 1.29mi |
| 5801 Magnolia St N Saint Petersburg, FL | 2.0 | 2.0 | 1147 | $2,250 | $1.96 | 6d | 1 | 1.32mi |
| 4165 13th Ln NE Saint Petersburg, FL | 2.0 | 2.0 | 1438 | $4,700 | $3.27 | 6d | 1 | 1.35mi |
| 131 41st Ave N Saint Petersburg, FL | 2.0 | 2.0 | 933 | $2,100 | $2.25 | 5d | 2 | 1.37mi |
| 101 40th Ave NE Saint Petersburg, FL | 3.0 | 1.0 | 1075 | $2,700 | $2.51 | 6d | 1 | 1.40mi |
| 4095 14th St NE Saint Petersburg, FL | 2.0 | 2.0 | 1791 | $3,795 | $2.12 | 6d | 1 | 1.40mi |
| 324 42nd Ave N Saint Petersburg, FL | 2.0 | 2.0 | 1434 | $3,500 | $2.44 | 0d | 1 | 1.41mi |
| 1885 Shore Acres Blvd NE Saint Petersburg, FL | 3.0 | 2.0 | 1040 | $2,498 | $2.40 | 16d | 1 | 1.43mi |
Listing history 20 events
-
2026-06-15days on market $319,000 Active 66 DOM
-
2026-06-13days on market $319,000 Active 64 DOM
-
2026-06-09days on market $319,000 Active 60 DOM
-
2026-06-08days on market $319,000 Active 59 DOM
-
2026-06-07days on market $319,000 Active 58 DOM
-
2026-06-04days on market $319,000 Active 55 DOM
-
2026-06-03days on market $319,000 Active 54 DOM
-
2026-06-01days on market $319,000 Active 52 DOM
-
2026-05-31days on market $319,000 Active 51 DOM
-
2026-05-21price $319,000
-
2026-05-08price $339,000
-
2026-04-10$349,000 Active
-
2021-02-12soldstatus $267,500
-
2021-02-11soldstatus $267,500 Sold 571-char remark
Show marketing remark (571 chars)
Need an Oasis in a beautiful city? This charming cottage in the heart of Northeast St. Petersburg has a lot to offer. The property is located within a short distance of Jack Puryear Park, Mangrove Bay Golf Course and several other parks. Enjoy barbecues and community on the new composite deck overlooking a peaceful fully fenced back yard. The original hardwood floors and updated kitchen are sure to make you feel at home. Wind resistent Windows and French doors were replaced February of 2020. Prepare yourself to be wowed by this vintage gem in such a prime location.
-
2021-01-03status Pending 571-char remark
Show marketing remark (571 chars)
Need an Oasis in a beautiful city? This charming cottage in the heart of Northeast St. Petersburg has a lot to offer. The property is located within a short distance of Jack Puryear Park, Mangrove Bay Golf Course and several other parks. Enjoy barbecues and community on the new composite deck overlooking a peaceful fully fenced back yard. The original hardwood floors and updated kitchen are sure to make you feel at home. Wind resistent Windows and French doors were replaced February of 2020. Prepare yourself to be wowed by this vintage gem in such a prime location.
-
2020-12-31$264,900 Active 571-char remark
Show marketing remark (571 chars)
Need an Oasis in a beautiful city? This charming cottage in the heart of Northeast St. Petersburg has a lot to offer. The property is located within a short distance of Jack Puryear Park, Mangrove Bay Golf Course and several other parks. Enjoy barbecues and community on the new composite deck overlooking a peaceful fully fenced back yard. The original hardwood floors and updated kitchen are sure to make you feel at home. Wind resistent Windows and French doors were replaced February of 2020. Prepare yourself to be wowed by this vintage gem in such a prime location.
-
2006-12-05soldstatus $132,000
-
2006-11-30soldstatus $132,000 73-char remark
Show marketing remark (73 chars)
Nice clean home with vinyl siding, Lumadome in kitchen. Ready to move in.
-
2006-08-26$137,900 73-char remark
Show marketing remark (73 chars)
Nice clean home with vinyl siding, Lumadome in kitchen. Ready to move in.
-
1990-09-01soldstatus $48,300
ⓘ Source: listings_history table (triggers on properties + properties_extension) + one-shot
backfill from property_details.listing_events for pre-trigger history.
Tax reassessment forecast FL · Resets to sale price
- Current annual tax
- $3,180 · $265/mo
- Projected year-2 tax
- $3,180 · $265/mo
- Expected delta
- $0/yr ($0/mo · 0.0%)
ⓘ Screening estimate from a state-policy table — verify with the county assessor before closing.
Climate risk First Street
- Flood 10/10 Extreme FEMA zone AE · 99% chance over 30 yrs
- Wildfire 2/10 Low
- Heat 10/10 Extreme 7 d/yr ≥106°F today · 27 d/yr by 30 yrs out
- Wind 10/10 Extreme 99% chance of damaging wind over 30 yrs
- Air quality 3/10 Moderate 2 unhealthy d/yr today · 3 by 30 yrs out
Nearby sold comps map
Loading sold comps map…
Walkable amenities ~0.75 mi
Loading nearby amenities…
Taxation est. · year 1
- Rental income
- $38,206
- − Mortgage interest
- −$17,869
- − Property taxes
- −$3,180
- − Insurance
- −$6,714
- − Repairs & maintenance
- −$3,057
- − Management
- −$3,057
- − Depreciation
- −$9,280
- Taxable loss
- −$4,949
- Est. tax savings @ 24.0%
- +$1,188
- After-tax cash flow
- $1,403/yr
For passive investors: Depreciation is non-cash, so a rental often shows a tax loss while cash-flowing — sheltering income. Rental losses are passive: they offset passive income freely, and up to $25,000/yr can offset ordinary (W-2) income if you actively participate and your MAGI is under $100k (phasing out to $0 by $150k); unused losses carry forward. On sale, claimed depreciation is recaptured at up to 25%, and gains may owe capital-gains tax (a 1031 exchange can defer both). Figures are a year-1 estimate at your 24.0% rate — not tax advice; consult a CPA.
Schools (NCES district)
- District
- Pinellas
- NCES district ID
- 1201560
- Math proficiency
- 51% ▼ -5.00%
- Reading proficiency
- 51% ▼ -3.00%
- Median HH income
- $46,270
- Composite
- 43.27/100
- National rank
- #3046
- State rank
- #31 of 73 in FL
Livability — St. Petersburg
No livability data for this city. (Only ~50 U.S. cities are tracked.)
Census & demographics
- Census place
- St. Petersburg, FL
- County
- Pinellas County · 939,478 people
- City population
- 249,151
- Metro
- Tampa-St. Petersburg-Clearwater, FL
- Population (ZIP)
- 25,264
- Household income
- $95,224
- Rent vs Own
- Severe rent burden
- 509.0
Population outlook (Pinellas County) Hauer SSP2
- Today (2025)
- 1,027,532 people
- By 2030
- 1,063,586 · +3.5%
- By 2040
- 1,125,020 · +9.5%
- By 2050
- 1,168,637 · +13.7%
- By 2075
- 1,265,188 · +23.1%
- By 2100
- 1,260,357 · +22.7%
Race, ethnicity, and origin ACS 2023
- Neighborhood character
- Predominantly White (76%)
- Race & ethnicity
- White 76% Hispanic / Latino 10% Two or more races 10% Black 5% Asian 4%
- Hispanic origin (detail)
- Mexican 1% Puerto Rican 2% Cuban 2%
- Common ancestry
- Lithuanian 4% Romanian 3% Italian 2%
- Foreign-born
- 9% · Canada, Vietnam
- Languages at home
- 87% English-only · Spanish 6% Russian/Polish/Slavic 2% Other Indo-European 1%
Political lean MEDSL · Pinellas
- 2024 margin
- Lean R (+5.2) · D 46.9% · R 52.1%
- 2008→2024 swing
- -13.5pp toward R · 2008: 8.3pp · 2024: -5.2pp
- All cycles
- 2024: R+5.2 2020: D+0.2 2016: R+1.1 2012: D+5.6 2008: D+8.3
Not yet ingested
- Civics
- —
Market trends
- HPI YoY
- ▼ -617.95%
- Current HPI
- 352.2886
- Rent YoY
- ▲ 2.21%
- Metro
- Tampa-St. Petersburg-Clearwater, FL
- State GDP YoY
- ▲ 3.28%
- F500 in state
- 36
Industry mix (Fortune 500 HQ in FL)
| Industry | F500 HQs | Revenue |
|---|---|---|
| Industrial Technology | 2 | $29B |
|
||
| Insurance | 2 | $17B |
|
||
| Retail | 1 | $60B |
|
||
| Technology Distribution | 1 | $58B |
|
||
| Homebuilding | 1 | $35B |
|
||
| Technology Manufacturing | 1 | $35B |
|
||
Price history
+560.5% since first listed11 events — show timeline
- 2026-05-21 Price Changed $319,000 Stellar MLS as Distributed by MLS Grid
- 2026-05-08 Price Changed $339,000 Stellar MLS as Distributed by MLS Grid
- 2026-04-10 Listed $349,000 Stellar MLS as Distributed by MLS Grid
- 2021-02-12 Sold (Public Records) $267,500 Public Records
- 2021-02-11 Sold (MLS) $267,500 Stellar MLS as Distributed by MLS Grid
- 2021-01-03 Pending — Stellar MLS as Distributed by MLS Grid
- 2020-12-31 Listed $264,900 Stellar MLS as Distributed by MLS Grid
- 2006-12-05 Sold (Public Records) $132,000 Public Records
- 2006-11-30 Sold (MLS) $132,000 Stellar MLS as Distributed by MLS Grid
- 2006-08-26 Listed $137,900 Stellar MLS as Distributed by MLS Grid
- 1990-09-01 Sold (Public Records) $48,300 Public Records
Property tax history
+5.2%/yrLatest (2025): $3,180 · -15.5% YoY. Source: county tax records.
Cash-flow waterfall
monthlySold comps — $/sqft
last 12 mo · ≤1 miLoading sold comps…