 24-Plex
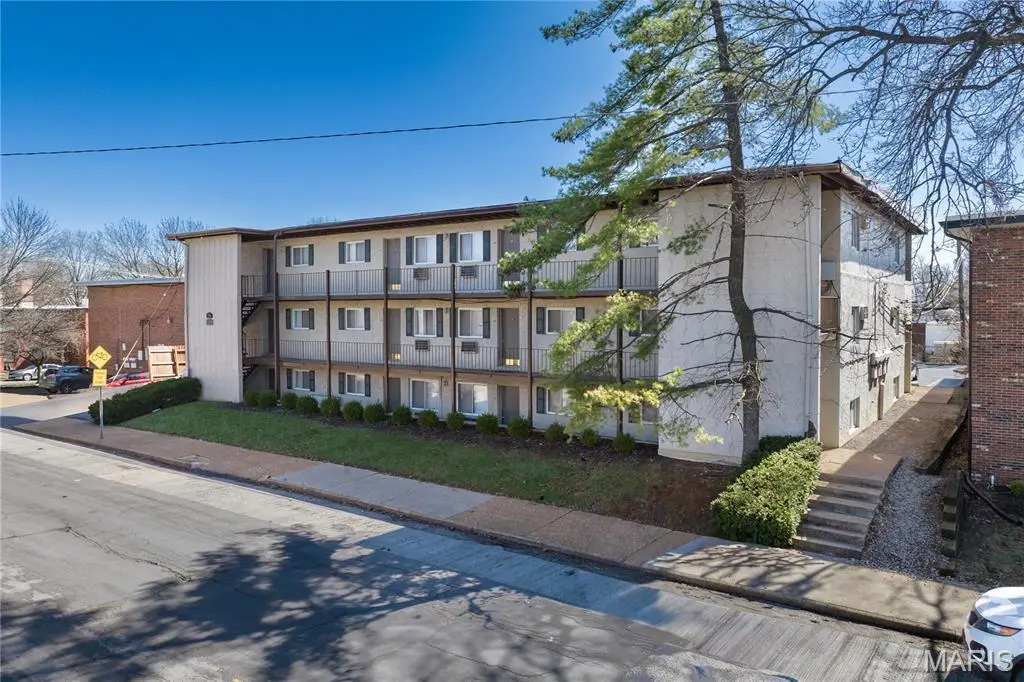
3704 Greenwood Blvd · Maplewood, MO
Flood risk 1/10 · Minimal
- FEMA flood zone
- X (unshaded)
- Chance of flooding over 30 yrs
- 0.0%
- Est. flood insurance / yr
- $507 – $1,088
Fire risk 1/10 · Minimal
- Est. fire insurance / yr
- $1,054 – $1,958
Heat risk 5/10 · Moderate
- Hot days now (above 107°F)
- 7 days/yr
- Hot days in 30 yrs
- 21 days/yr
Wind risk 2/10 · Minimal
- Chance of severe wind over 30 yrs
- 1.0%
Air-quality risk 3/10 · Minor
- Unhealthy air days now
- 3 days/yr
- Unhealthy air days in 30 yrs
- 4 days/yr
Risk factors via First Street. Map © Google.
Why this score? — see what drove the B- grade
The composite is a weighted blend of 9 inputs, each scored 0–100. Each bar is that input's sub-score; the figure is the points it added to the 100-point composite (weight × sub-score).
- Cash flow +29.2/30.0
- DSCR +10.0/10.0
- 1% rule +7.5/10.0
- ARV discount +7.5/15.0
- Livability +4.2/5.0
- Schools +4.1/10.0
- Rent growth +3.4/5.0
- Condition / age +2.5/5.0
- Appreciation +0.0/10.0
$1,825,000
🖨 Deal sheet (PDF) 📄 Offer letter ✓ Due diligence
Multi-family units
County records classify this as Multi-Family (5+ Unit). Listing-text estimate: 24 units. confirmed
5+ unit building — per-unit beds/baths from public records are typically unavailable; the breakdown below (if shown) is an estimate from the listing text.
Listing remarks MLS
Greenwood Apartments (the “Property”), is a 24 unit multifamily asset located in Maplewood, a suburb in the St. Louis MSA. The Property features 24 one-bedroom units in one three-story building. The property has strong historical occupancy and is currently 100% occupied. Significant value-add potential exists, as nine of the units are in classic or near-classic condition, providing new ownership with the immediate opportunity to implement upgrades and subsequently increase rents. Greenwood Apartments is located in the city of Maplewood, just off Big Bend Road and less than one mile from the I-44 and Shrewsbury Avenue Interchange. Maplewood is a family-friendly suburban community situated four miles from Clayton and ten miles southwest of Downtown St. Louis.
Key facts
- 0.39 acre lot
- Built 1971
- Listed 87 days
Neighborhood map
What this means for you Summary
Snapshot
- This is a 24 × 1-bed/1-bath units multifamily listed at $1.82M.
Deal economics
- At list price, monthly cash flow is $6k ($76k/yr) — positive. Per door: $265/mo.
- The deal already cash-flows at list — no discount required.
- Meets the 1% rule at list price ($23k rent vs $1.82M).
- Recommended offer: $1.72M (6.0% below list) — sets the bar for market timing.
- Cap rate 10.5% vs local median 3.8% in Maplewood — top-decile yield for the area; either an underpriced asset or a hidden risk that comps aren't pricing in. Stress-test before assuming the spread holds.
Location & tenants
- Location reads 84/100 on livability (#5 in MO, #673 nationally) — a professional / high-income tenant draw. Strengths: amenities A+, commute A+, cost of living A+; Watch: crime F.
- Maplewood-Richmond Heights (suburban): math 40% / reading 56% proficiency, ranked #63 of 324 in MO (top 19%) — families likely to look elsewhere, expect single-tenant / working-renter base with shorter leases.
- Zoned schools: Mrh Early Childhood Center (460 students, 22% FRL); Mrh Middle (math 30% / reading 51%, grade F, #180 of 391 statewide, top 47%, 220 students, 31% FRL); Maplewood-Richmond Hgts. High (math 62% / reading 67%, grade B-, #19 of 521 statewide, top 4%, 413 students, 32% FRL).
- Market conditions: Rents rising (+3.8%/yr); 44 active listings in the ZIP; 920 units permitted in St. Louis County in 2024 (250 in 5+ unit buildings).
- At $22,776/mo this rent would consume 415% of the median local household income ($66k/yr) (locally 195% of renters already pay >50% of income on rent) — very limited rent-growth headroom before tenants either downsize or default.
Forward outlook
- Local home prices are declining (-3.0%/yr); year-one equity from $13k of loan paydown is wiped out by about $55k of value loss. Plan a longer hold.
- At projected returns (-3.0% appreciation + 3.8% rent growth), your $511k cash investment doubles in ~8 years — after that, you're playing with house money.
Negotiation context
- It's been on market 87 days — a 6% lower offer ($1.72M) is reasonable based on typical stale-listing flexibility.
- Current owner paid $700k; list at $1.82M implies a 161% gain — meaningful room to come down on a strong offer.
Risks & watch-outs
- Climate carrying-cost: extreme-heat days projected 7→21/yr by 2055 (HVAC capex compounding) — expect insurance premiums to compound above CPI over the hold.
Questions for the listing agent
- It's been on market 87 days. Have you received any prior offers? Is the seller open to a 6% concession, seller financing, or rate buy-down credit?
- Can we see the unit-by-unit rent roll, current vacancy, and any below-market leases? What's the average tenancy length?
- What capital expenditures (roof, boiler, parking lot, exteriors) have been made in the last 5 years, and what's planned in the next 2?
- Built in 1971 — when were the roof, HVAC, electrical panel, plumbing, and water heater last replaced?
- Why hasn't it sold? Are there any deal-killer items the seller is aware of (foundation, flood, title, zoning, code violations)?
- Is there a deadline driving the sale (1031 exchange, divorce, estate, relocation)? That informs how much negotiation room exists.
- Schools are A-rated — typically a magnet for longer-tenancy family renters. What's the average tenant stay here, and is there a school-zone premium baked into asking?
- Crime grade is F in this area — have there been break-ins, vandalism, or insurance claims at this property in the last 3 years? What carrier currently insures it and at what premium?
- What's the average days-on-market for RENTAL listings here right now (not sales)? A rising rental-DOM trend means longer vacancies and softer asking-rent achievability than the comps imply.
- What's the recent tenant-quality profile in this submarket — average credit score on applications, eviction rate, late-payment / NSF rate, and stable-employment percentage? A property-management company in the area should have these aggregated.
- How much new apartment / multifamily construction is in the pipeline within 1–3 miles? Heavy new supply (>2% of stock underway) typically softens rents 12–24 months out; light construction supports rent growth.
Investment metrics
- 1% rule
- 1.25% ✓
- Cap rate
- 10.47%
- Cash-on-cash
- 14.92%
- DSCR
- 1.66
- GRM
- 6.7
CMA / ARV
No comps found within radius.
Projected returns pro-forma
-3.0% appreciation · 3.76% rent growth · sell at horizon
- IRR
- 6.3%
- Equity multiple
- 1.25×
- Total profit
- $126,086
- Equity at exit
- $272,113
- IRR
- 16.3%
- Equity multiple
- 2.38×
- Total profit
- $702,778
- Equity at exit
- $157,793
Cash invested: $511,000 (down + closing). Projections, not guarantees.
Landlord ↔ Tenant lean methodology
- Overall (STATE)
- 81 Strongly Landlord-Friendly
- State Missouri
- 81 Strongly Landlord-Friendly · R+10
- County
- — inherits STATE
- City
- — inherits STATE
ZIP-level market 63143
- Rents YoY
- 3.8%
- Active inventory
- 44
- Price-to-rent
- 160.3×
Monthly cashflow live
- Estimated rent
- $22,776 medium interval (Pro) →
- Mortgage (P&I)
- −$9,570
- Tax from tax record
- −$1,311 /mo · $15,730/yr
- Insurance
- −$760
- HOA
- −$0
- Vacancy / Maint / Mgmt
- −$4,783
- Net cashflow
- $6,351
Break-even live
Sensitivity live
| Price | -10% $7,384 | -5% $6,868 | +0% $6,351 | +5% $5,835 | +10% $5,318 |
|---|---|---|---|---|---|
| Rent | -10% $4,552 | -5% $5,452 | +0% $6,351 | +5% $7,251 | +10% $8,151 |
| Rate | -1.0pp $7,270 | -0.5pp $6,815 | base $6,351 | +0.5pp $5,878 | +1.0pp $5,397 |
24-unit breakdown (identical units grouped — click to expand)
| Units | Beds | Baths | Est. rent |
|---|---|---|---|
| 24× units | 1 | 1 | $22,776 |
| #1 | 1 | 1 | $949 |
| #2 | 1 | 1 | $949 |
| #3 | 1 | 1 | $949 |
| #4 | 1 | 1 | $949 |
| #5 | 1 | 1 | $949 |
| #6 | 1 | 1 | $949 |
| #7 | 1 | 1 | $949 |
| #8 | 1 | 1 | $949 |
| #9 | 1 | 1 | $949 |
| #10 | 1 | 1 | $949 |
| #11 | 1 | 1 | $949 |
| #12 | 1 | 1 | $949 |
| #13 | 1 | 1 | $949 |
| #14 | 1 | 1 | $949 |
| #15 | 1 | 1 | $949 |
| #16 | 1 | 1 | $949 |
| #17 | 1 | 1 | $949 |
| #18 | 1 | 1 | $949 |
| #19 | 1 | 1 | $949 |
| #20 | 1 | 1 | $949 |
| #21 | 1 | 1 | $949 |
| #22 | 1 | 1 | $949 |
| #23 | 1 | 1 | $949 |
| #24 | 1 | 1 | $949 |
| Total (24 units) | $22,776 | ||
UW: 25.0% down · 7.5% · 30yr · 1.5% tax · 5.0% vac · 8.0% maint · 8.0% mgmt
Financing live
Cash to close
- Down payment
- $456,250
- Closing costs
- $54,750
- Reserves months
- —
- Total cash needed
- —
Loan-product check · same deal, 3 products live
Conventional
25% down · 7.5% · 30yr
- Down + closing
- —
- Monthly P&I
- —
- Monthly cashflow
- —
- DSCR
- —
- Eligible?
- —
Personal DTI + credit; lowest rate.
DSCR
20% down · 8.5% · 30yr
- Down + closing
- —
- Monthly P&I
- —
- Monthly cashflow
- —
- DSCR
- —
- Eligible?
- —
No personal income docs; deal must DSCR.
Hard money
10% down · 12.0% · 12mo
- Down + closing
- —
- Monthly P&I
- —
- Monthly cashflow
- —
- DSCR
- —
- Eligible?
- —
Short-term bridge; refi at stabilization.
Listing history 19 events
-
2026-06-21days on market $1,825,000 Active 87 DOM
-
2026-06-18days on market $1,825,000 Active 84 DOM
-
2026-06-17days on market $1,825,000 Active 83 DOM
-
2026-06-16days on market $1,825,000 Active 82 DOM
-
2026-06-15days on market $1,825,000 Active 81 DOM
-
2026-06-13days on market $1,825,000 Active 79 DOM
-
2026-06-13days on market $1,825,000 Active 78 DOM
-
2026-06-09days on market $1,825,000 Active 75 DOM
-
2026-06-08days on market $1,825,000 Active 74 DOM
-
2026-06-07days on market $1,825,000 Active 73 DOM
-
2026-06-03days on market $1,825,000 Active 69 DOM
-
2026-06-02days on market $1,825,000 Active 68 DOM
-
2026-06-01days on market $1,825,000 Active 67 DOM
-
2026-05-31days on market $1,825,000 Active 66 DOM
-
2026-03-26$1,825,000 Active 779-char remark
Show marketing remark (779 chars)
Greenwood Apartments (the “Property”), is a 24 unit multifamily asset located in Maplewood, a suburb in the St. Louis MSA. The Property features 24 one-bedroom units in one three-story building. The property has strong historical occupancy and is currently 100% occupied. Significant value-add potential exists, as nine of the units are in classic or near-classic condition, providing new ownership with the immediate opportunity to implement upgrades and subsequently increase rents. Greenwood Apartments is located in the city of Maplewood, just off Big Bend Road and less than one mile from the I-44 and Shrewsbury Avenue Interchange. Maplewood is a family-friendly suburban community situated four miles from Clayton and ten miles southwest of Downtown St. Louis.
-
2020-04-06soldstatus
-
2009-02-03soldstatus $700,000
-
1987-12-01soldstatus $350,000
-
1987-12-01soldstatus
ⓘ Source: listings_history table (triggers on properties + properties_extension) + one-shot
backfill from property_details.listing_events for pre-trigger history.
Tax reassessment forecast MO · Resets to sale price
- Current annual tax
- $15,730 · $1,311/mo
- Projected year-2 tax
- $17,702 · $1,475/mo
- Expected delta
- +$1,973/yr (+$164/mo · 12.5%)
ⓘ Screening estimate from a state-policy table — verify with the county assessor before closing.
Climate risk First Street
- Flood 1/10 Low FEMA zone X (unshaded) · 0% chance over 30 yrs
- Wildfire 1/10 Low
- Heat 5/10 Major 7 d/yr ≥107°F today · 21 d/yr by 30 yrs out
- Wind 2/10 Low 100% chance of damaging wind over 30 yrs
- Air quality 3/10 Moderate 3 unhealthy d/yr today · 4 by 30 yrs out
Nearby sold comps map
Loading sold comps map…
Walkable amenities ~0.75 mi
Loading nearby amenities…
Taxation est. · year 1
- Rental income
- $273,312
- − Mortgage interest
- −$102,228
- − Property taxes
- −$15,730
- − Insurance
- −$9,125
- − Repairs & maintenance
- −$21,865
- − Management
- −$21,865
- − Depreciation
- −$53,091
- Taxable income
- $49,408
- Est. tax owed @ 24.0%
- −$11,858
- After-tax cash flow
- $64,358/yr
For passive investors: Depreciation is non-cash, so a rental often shows a tax loss while cash-flowing — sheltering income. Rental losses are passive: they offset passive income freely, and up to $25,000/yr can offset ordinary (W-2) income if you actively participate and your MAGI is under $100k (phasing out to $0 by $150k); unused losses carry forward. On sale, claimed depreciation is recaptured at up to 25%, and gains may owe capital-gains tax (a 1031 exchange can defer both). Figures are a year-1 estimate at your 24.0% rate — not tax advice; consult a CPA.
Schools (NCES district)
- District
- Maplewood-Richmond Heights
- NCES district ID
- 2920010
- Math proficiency
- 40% ▼ -5.00%
- Reading proficiency
- 56% ▼ -4.00%
- Median HH income
- $45,159
- Composite
- 40.6/100
- National rank
- #3696
- State rank
- #63 of 324 in MO
Livability — Maplewood
- Score
- 84/100
- State rank
- #5
- US rank
- #673
Category grades
Schools grade is shown separately in the Schools card above.
Census & demographics
- Census place
- Maplewood, MO
- County
- Saint Louis County · 888,823 people
- City population
- 8,975
- Metro
- St. Louis, MO-IL
- Population (ZIP)
- 8,975
- Household income
- $65,861
- Rent vs Own
- Severe rent burden
- 195.0
Population outlook (St. Louis County) Hauer SSP2
- Today (2025)
- 1,025,227 people
- By 2030
- 1,028,023 · +0.3%
- By 2040
- 1,020,940 · -0.4%
- By 2050
- 1,007,280 · -1.8%
- By 2075
- 987,277 · -3.7%
- By 2100
- 921,984 · -10.1%
Race, ethnicity, and origin ACS 2023
- Neighborhood character
- Predominantly White (74%)
- Race & ethnicity
- White 74% Two or more races 12% Black 8% Hispanic / Latino 4% Asian 3%
- Common ancestry
- Romanian 4% Slovak 4% Italian 3%
- Foreign-born
- 6% · Canada, China, Vietnam
- Languages at home
- 94% English-only · Spanish 3% Tagalog/Filipino 1%
Political lean MEDSL · St. Louis
- 2024 margin
- Strong D (+23.4) · D 60.8% · R 37.4% · Other 1.7%
- 2008→2024 swing
- +3.5pp toward D · 2008: 19.9pp · 2024: 23.4pp
- All cycles
- 2024: D+23.4 2020: D+24.0 2016: D+16.2 2012: D+13.7 2008: D+19.9
Not yet ingested
- Civics
- —
Market trends
- HPI YoY
- ▼ -226.44%
- Current HPI
- 300.6917
- Rent YoY
- ▲ 3.76%
- Metro
- St. Louis, MO-IL
- State GDP YoY
- ▲ 1.84%
- F500 in state
- 20
Industry mix (Fortune 500 HQ in MO)
| Industry | F500 HQs | Revenue |
|---|---|---|
| Healthcare | 1 | $163B |
|
||
| Insurance | 1 | $21B |
|
||
| Industrial Technology | 1 | $17B |
|
||
| Retail | 1 | $16B |
|
||
| Industrial Distribution | 1 | $10B |
|
||
| Utilities | 1 | $9B |
|
||
Price history
+421.4% since first listed5 events — show timeline
- 2026-03-26 Listed $1,825,000 MARIS as Distributed by MLS Grid
- 2020-04-06 Sold (Public Records) — Public Records
- 2009-02-03 Sold (Public Records) $700,000 Public Records
- 1987-12-01 Sold (Public Records) — Public Records
- 1987-12-01 Sold (Public Records) $350,000 Public Records
Property tax history
+1.9%/yrLatest (2022): $15,730 · +0.8% YoY. Source: county tax records.
Cash-flow waterfall
monthlySold comps — $/sqft
last 12 mo · ≤1 miLoading sold comps…