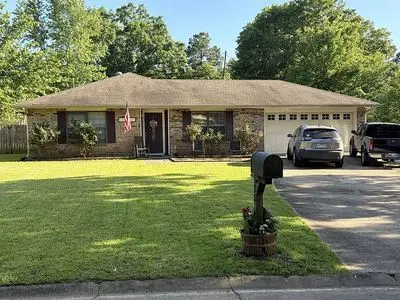
125 Van Buren Dr · Charleston, AR
Flood risk 1/10 · Minimal
- FEMA flood zone
- X (unshaded)
- Chance of flooding over 30 yrs
- 0.0%
- Est. flood insurance / yr
- $507 – $1,088
Fire risk 6/10 · Moderate
- Est. fire insurance / yr
- $1,499 – $2,785
Heat risk 7/10 · Major
- Hot days now (above 112°F)
- 7 days/yr
- Hot days in 30 yrs
- 20 days/yr
Wind risk 2/10 · Minimal
- Chance of severe wind over 30 yrs
- 2.0%
Air-quality risk 2/10 · Minimal
- Unhealthy air days now
- 0 days/yr
- Unhealthy air days in 30 yrs
- 1 days/yr
Risk factors via First Street. Map © Google.
Why this score? — see what drove the D grade
The composite is a weighted blend of 9 inputs, each scored 0–100. Each bar is that input's sub-score; the figure is the points it added to the 100-point composite (weight × sub-score).
- Appreciation +10.0/10.0
- ARV discount +9.3/15.0
- Cash flow +7.7/30.0
- Schools +3.8/10.0
- Livability +3.5/5.0
- Rent growth +2.5/5.0
- Condition / age +2.5/5.0
- DSCR +1.8/10.0
- 1% rule +1.3/10.0
$190,000
🖨 Deal sheet (PDF) 📄 Offer letter ✓ Due diligence
Listing remarks MLS
Gather the friends and family for cookouts around the pool! This charming home is move-in ready! Fresh, new interior paint gives it a bright, clean, modern look. Large, open and spacious kitchen with plenty of countertop space. Two living areas. One of which could possibly be converted to an extra bedroom, playroom or office. Large, privacy fenced backyard with inground pool. Centrally located in an established neighborhood. A must see!
Key facts
- Large backyard
- Separate fence
- Quiet neighborhood
Tags
Neighborhood map
What this means for you Summary
Snapshot
- This is a 3-bed/2.0-bath single-family listed at $190k.
Deal economics
- At list price, monthly cash flow is $-216 ($-3k/yr) — negative.
- To cash-flow at today's rent, offer at most $152k (20.1% below list).
- To meet the 1% rule (rent ≥ 1% of price), the offer needs to be $120k (37.1% below list).
- Recommended offer: $120k (37.1% below list) — sets the bar for 1% rule.
Location & tenants
- Location reads 69/100 on livability (#70 in AR) — a middle-class / working-renter tenant base. Strengths: cost of living A+, housing A+, health & safety A+; Watch: crime D, amenities F, commute F.
- Charleston School District (rural): math 46% / reading 43% proficiency, ranked #39 of 238 in AR (top 16%) — families likely to look elsewhere, expect single-tenant / working-renter base with shorter leases.
- Zoned schools: Charleston Elementary School (math 56% / reading 41%, grade D, #109 of 454 statewide, top 25%, 454 students, 47% FRL); Charleston High School (math 38% / reading 46%, grade F, #38 of 292 statewide, top 14%, 435 students, 44% FRL).
- Market conditions: 51 active listings in the ZIP; 1 comparable units currently listed for rent nearby; 23 units permitted in Franklin County in 2024 (0 in 5+ unit buildings).
Forward outlook
- In year one you build about $20k of equity ($1k loan paydown + $19k appreciation (10.0% local appreciation)).
- Franklin County population projected at -16% by 2050 — secular population decline; favor cash flow + early exit over multi-decade hold.
- By year 2, paydown + projected appreciation supports a ~$33k cash-out refi (75% LTV) — recoverable capital for the next deal without selling this one.
Negotiation context
- It's been on market 34 days — a 3% lower offer ($184k) is reasonable based on typical stale-listing flexibility.
Risks & watch-outs
- Climate carrying-cost: major wildfire risk; extreme-heat days projected 7→20/yr by 2055 (HVAC capex compounding) — expect insurance premiums to compound above CPI over the hold.
Questions for the listing agent
- What do current leases actually rent for vs. the listed asking? Can we see a recent rent roll and the last 12 months of T-12 income?
- It's been on market 34 days. Have you received any prior offers? Is the seller open to a 37% concession, seller financing, or rate buy-down credit?
- Built in 1971 — when were the roof, HVAC, electrical panel, plumbing, and water heater last replaced?
- Is there a deadline driving the sale (1031 exchange, divorce, estate, relocation)? That informs how much negotiation room exists.
- Crime grade is D in this area — have there been break-ins, vandalism, or insurance claims at this property in the last 3 years? What carrier currently insures it and at what premium?
- The area grade is low — what's the realistic commute time and amenity access for the typical tenant pool here? Any planned neighborhood developments (good or bad) we should know about?
- What's the average days-on-market for RENTAL listings here right now (not sales)? A rising rental-DOM trend means longer vacancies and softer asking-rent achievability than the comps imply.
- What's the recent tenant-quality profile in this submarket — average credit score on applications, eviction rate, late-payment / NSF rate, and stable-employment percentage? A property-management company in the area should have these aggregated.
- How much new for-sale + rental construction is in the pipeline within 1–3 miles? Heavy new supply typically softens prices + rents 12–24 months out; constrained supply supports both.
Investment metrics
- 1% rule
- 0.63% ✗
- Cap rate
- 4.93%
- Cash-on-cash
- -4.87%
- DSCR
- 0.78
- GRM
- 13.2
CMA / ARV
- ARV (median comp)
- $198,126
- List price
- $190,000
- Delta
- -4.10%
- Verdict
- FAIR
- Comps
- 20 within 1.0 mi
Show comp detail 12 sales within ~0.75 mi
| Address | Dist | Beds/Ba | Sqft | Sold | Price | $/sf | Match |
|---|---|---|---|---|---|---|---|
| 200 Jefferson Dr | 0.03mi | 3/2.0 | 1,500 (+1%) | 6mo | $195,000 | $130 | 91 |
| 70 Maplewood Loop | 0.16mi | 4/2.5 (+1) | 1,546 (+4%) | 2mo | $252,630 | $163 | 76 |
| 152 Maplewood Loop | 0.16mi | 3/2.5 | 1,400 (-5%) | 9mo | $229,900 | $164 | 74 |
| 606 Highland Dr | 0.30mi | 3/2.0 | 1,455 (-2%) | 11mo | $165,000 | $113 | 74 |
| 616 Darrin Dr | 0.30mi | 3/2.0 | 1,452 (-2%) | 19mo | $167,700 | $115 | 67 |
| 172 Maplewood Loop | 0.15mi | 3/2.5 | 1,400 (-5%) | 19mo | $229,900 | $164 | 66 |
| 627 Parks Dr | 0.50mi | 3/2.0 | 1,429 (-3%) | 9mo | $229,000 | $160 | 63 |
| 625 Louis St | 0.32mi | 4/1.5 (+1) | 1,348 (-9%) | 2mo | $55,000 | $41 | 62 |
| 322 N Seventh St | 0.50mi | 3/2.0 | 1,344 (-9%) | 2mo | $185,000 | $138 | 60 |
| 122 N Logan St | 0.48mi | 2/1.0 (-1) | 1,529 (+3%) | 9mo | $99,000 | $65 | 55 |
| 614 N School St | 0.28mi | 4/1.0 (+1) | 1,300 (-12%) | 6mo | $134,000 | $103 | 53 |
| 703 S Hancock St | 0.74mi | 3/1.0 | 1,300 (-12%) | 12mo | $120,000 | $92 | 32 |
Match score weights: distance 35% · size 25% · config 20% · recency 20%. Top-matched comps best support the ARV.
Projected returns pro-forma
10.0% appreciation · 3.0% rent growth · sell at horizon
- IRR
- 20.8%
- Equity multiple
- 2.68×
- Total profit
- $89,639
- Equity at exit
- $171,167
- IRR
- 18.9%
- Equity multiple
- 6.16×
- Total profit
- $274,646
- Equity at exit
- $369,128
Cash invested: $53,200 (down + closing). Projections, not guarantees.
Landlord ↔ Tenant lean methodology
- Overall (STATE)
- 92 Strongly Landlord-Friendly
- State Arkansas
- 92 Strongly Landlord-Friendly · R+14
- County
- — inherits STATE
- City
- — inherits STATE
ZIP-level market 72933
- Home prices YoY
- 5.8%
- Active inventory
- 51
- Price-to-rent
- 13.2×
Monthly cashflow live
- Estimated rent
- $1,195 medium interval (Pro) →
- Mortgage (P&I)
- −$996
- Tax from tax record
- −$85 /mo · $1,015/yr
- Insurance
- −$79
- HOA
- −$0
- Vacancy / Maint / Mgmt
- −$251
- Net cashflow
- $-216
Break-even live
Sensitivity live
| Price | -10% $-109 | -5% $-162 | +0% $-216 | +5% $-270 | +10% $-324 |
|---|---|---|---|---|---|
| Rent | -10% $-311 | -5% $-263 | +0% $-216 | +5% $-169 | +10% $-122 |
| Rate | -1.0pp $-120 | -0.5pp $-168 | base $-216 | +0.5pp $-265 | +1.0pp $-315 |
UW: 25.0% down · 7.5% · 30yr · 1.5% tax · 5.0% vac · 8.0% maint · 8.0% mgmt
Financing live
Cash to close
- Down payment
- $47,500
- Closing costs
- $5,700
- Reserves months
- —
- Total cash needed
- —
Loan-product check · same deal, 3 products live
Conventional
25% down · 7.5% · 30yr
- Down + closing
- —
- Monthly P&I
- —
- Monthly cashflow
- —
- DSCR
- —
- Eligible?
- —
Personal DTI + credit; lowest rate.
DSCR
20% down · 8.5% · 30yr
- Down + closing
- —
- Monthly P&I
- —
- Monthly cashflow
- —
- DSCR
- —
- Eligible?
- —
No personal income docs; deal must DSCR.
Hard money
10% down · 12.0% · 12mo
- Down + closing
- —
- Monthly P&I
- —
- Monthly cashflow
- —
- DSCR
- —
- Eligible?
- —
Short-term bridge; refi at stabilization.
Rent comps 1 comps
| Address | Beds | Baths | Sqft | Rent | $/sqft | DOM | Units | Dist |
|---|---|---|---|---|---|---|---|---|
| 96 N School St Unit 15 Charleston, AR | 2.0 | 1.5 | 952 | $1,195 | $1.26 | 15d | 1 | 0.17mi |
Listing history 19 events
-
2026-06-15days on market $190,000 Active 34 DOM
-
2026-06-14days on market $190,000 Active 32 DOM
-
2026-06-12days on market $190,000 Active 31 DOM
-
2026-06-09days on market $190,000 Active 28 DOM
-
2026-06-08days on market $190,000 Active 27 DOM
-
2026-06-07days on market $190,000 Active 26 DOM
-
2026-06-07days on market $190,000 Active 25 DOM
-
2026-06-04days on market $190,000 Active 22 DOM
-
2026-06-02days on market $190,000 Active 21 DOM
-
2026-06-01days on market $190,000 Active 20 DOM
-
2026-05-31days on market $190,000 Active 19 DOM
-
2026-05-31days on market $190,000 Active 18 DOM
-
2026-05-12$190,000 Active 309-char remark
-
2022-04-04soldstatus $174,000
-
2022-04-01soldstatus $174,000 443-char remark
Show marketing remark (443 chars)
Gather the friends and family for cookouts around the pool! This charming home is move-in ready! Fresh, new interior paint gives it a bright, clean, modern look. Large, open and spacious kitchen with plenty of countertop space. Two living areas. One of which could possibly be converted to an extra bedroom, playroom or office. Large, privacy fenced backyard with inground pool. Centrally located in an established neighborhood. A must see!
-
2022-02-06$179,900 443-char remark
Show marketing remark (443 chars)
Gather the friends and family for cookouts around the pool! This charming home is move-in ready! Fresh, new interior paint gives it a bright, clean, modern look. Large, open and spacious kitchen with plenty of countertop space. Two living areas. One of which could possibly be converted to an extra bedroom, playroom or office. Large, privacy fenced backyard with inground pool. Centrally located in an established neighborhood. A must see!
-
2017-01-12soldstatus $113,650
-
2012-04-04soldstatus $90,000
-
1998-08-05soldstatus $69,000
ⓘ Source: listings_history table (triggers on properties + properties_extension) + one-shot
backfill from property_details.listing_events for pre-trigger history.
Tax reassessment forecast AR · Resets to sale price
- Current annual tax
- $1,015 · $85/mo
- Projected year-2 tax
- $1,216 · $101/mo
- Expected delta
- +$201/yr (+$17/mo · 19.8%)
ⓘ Screening estimate from a state-policy table — verify with the county assessor before closing.
Climate risk First Street
- Flood 1/10 Low FEMA zone X (unshaded) · 0% chance over 30 yrs
- Wildfire 6/10 Major
- Heat 7/10 Severe 7 d/yr ≥112°F today · 20 d/yr by 30 yrs out
- Wind 2/10 Low 2% chance of damaging wind over 30 yrs
- Air quality 2/10 Low 0 unhealthy d/yr today · 1 by 30 yrs out
Nearby sold comps map
Loading sold comps map…
Walkable amenities ~0.75 mi
Loading nearby amenities…
Taxation est. · year 1
- Rental income
- $14,340
- − Mortgage interest
- −$10,643
- − Property taxes
- −$1,015
- − Insurance
- −$950
- − Repairs & maintenance
- −$1,147
- − Management
- −$1,147
- − Depreciation
- −$5,527
- Taxable loss
- −$6,090
- Est. tax savings @ 24.0%
- +$1,462
- After-tax cash flow
- $-1,132/yr
For passive investors: Depreciation is non-cash, so a rental often shows a tax loss while cash-flowing — sheltering income. Rental losses are passive: they offset passive income freely, and up to $25,000/yr can offset ordinary (W-2) income if you actively participate and your MAGI is under $100k (phasing out to $0 by $150k); unused losses carry forward. On sale, claimed depreciation is recaptured at up to 25%, and gains may owe capital-gains tax (a 1031 exchange can defer both). Figures are a year-1 estimate at your 24.0% rate — not tax advice; consult a CPA.
Schools (NCES district)
- District
- Charleston School District
- NCES district ID
- 0504200
- Math proficiency
- 46% ▼ -12.00%
- Reading proficiency
- 43% ▼ -9.00%
- Median HH income
- $47,155
- Composite
- 37.97/100
- National rank
- #4296
- State rank
- #39 of 238 in AR
Livability — Charleston
- Score
- 69/100
- State rank
- #70
- US rank
- #8583
Category grades
Schools grade is shown separately in the Schools card above.
Census & demographics
- Census place
- Charleston, AR
- Population (ZIP)
- 5,207
Population outlook (Franklin County) Hauer SSP2
- Today (2025)
- 16,946 people
- By 2030
- 16,403 · -3.2%
- By 2040
- 15,303 · -9.7%
- By 2050
- 14,243 · -16.0%
- By 2075
- 12,136 · -28.4%
- By 2100
- 10,443 · -38.4%
Race, ethnicity, and origin ACS 2023
- Neighborhood character
- Predominantly White (86%)
- Race & ethnicity
- White 86% Two or more races 10% Hispanic / Latino 2%
- Common ancestry
- Slovak 2% Iranian 2% Italian 1%
- Foreign-born
- 1%
Political lean MEDSL · Franklin
- 2024 margin
- Solid R (+62.4) · D 17.7% · R 80.1% · Other 2.2%
- 2008→2024 swing
- -23.1pp toward R · 2008: -39.3pp · 2024: -62.4pp
- All cycles
- 2024: R+62.4 2020: R+61.4 2016: R+54.6 2012: R+44.4 2008: R+39.3
Not yet ingested
- Civics
- —
Market trends
- HPI YoY
- ▲ 15.06%
- Current HPI
- 273.2222
- Rent YoY
- —
- Metro
- —
- State GDP YoY
- ▲ 3.80%
- F500 in state
- 10
Industry mix (Fortune 500 HQ in AR)
| Industry | F500 HQs | Revenue |
|---|---|---|
| Retail | 1 | $681B |
|
||
| Food / Agriculture | 1 | $53B |
|
||
| Retail / Energy | 1 | $22B |
|
||
| Transportation / Logistics | 1 | $12B |
|
||
| Energy | 1 | $4B |
|
||
Price history
+152.2% since first listed6 events — show timeline
- 2022-04-04 Sold (Public Records) $174,000 Public Records
- 2022-04-01 Sold (MLS) $174,000 WRVBOR
- 2022-02-06 Listed $179,900 WRVBOR
- 2017-01-12 Sold (Public Records) $113,650 Public Records
- 2012-04-04 Sold (Public Records) $90,000 Public Records
- 1998-08-05 Sold (Public Records) $69,000 Public Records
Property tax history
+6.6%/yrLatest (2025): $1,015 · +0.0% YoY. Source: county tax records.
Cash-flow waterfall
monthlySold comps — $/sqft
last 12 mo · ≤1 miLoading sold comps…