603 S Walnut St · Stanberry, MO
Flood risk 1/10 · Minimal
- FEMA flood zone
- X (unshaded)
- Chance of flooding over 30 yrs
- 0.0%
- Est. flood insurance / yr
- $507 – $1,088
Fire risk 1/10 · Minimal
- Est. fire insurance / yr
- $1,054 – $1,958
Heat risk 3/10 · Minor
- Hot days now (above 105°F)
- 7 days/yr
- Hot days in 30 yrs
- 15 days/yr
Wind risk 2/10 · Minimal
- Chance of severe wind over 30 yrs
- —
Air-quality risk 2/10 · Minimal
- Unhealthy air days now
- 0 days/yr
- Unhealthy air days in 30 yrs
- 1 days/yr
Risk factors via First Street. Map © Google.
Why this score? — see what drove the C- grade
The composite is a weighted blend of 9 inputs, each scored 0–100. Each bar is that input's sub-score; the figure is the points it added to the 100-point composite (weight × sub-score).
- Cash flow +17.1/30.0
- ARV discount +7.5/15.0
- DSCR +5.3/10.0
- Appreciation +5.0/10.0
- Schools +4.4/10.0
- 1% rule +3.5/10.0
- Livability +3.5/5.0
- Rent growth +2.5/5.0
- Condition / age +2.5/5.0
$124,900
🖨 Deal sheet 📄 Offer letter ✓ Due diligence
Listing remarks
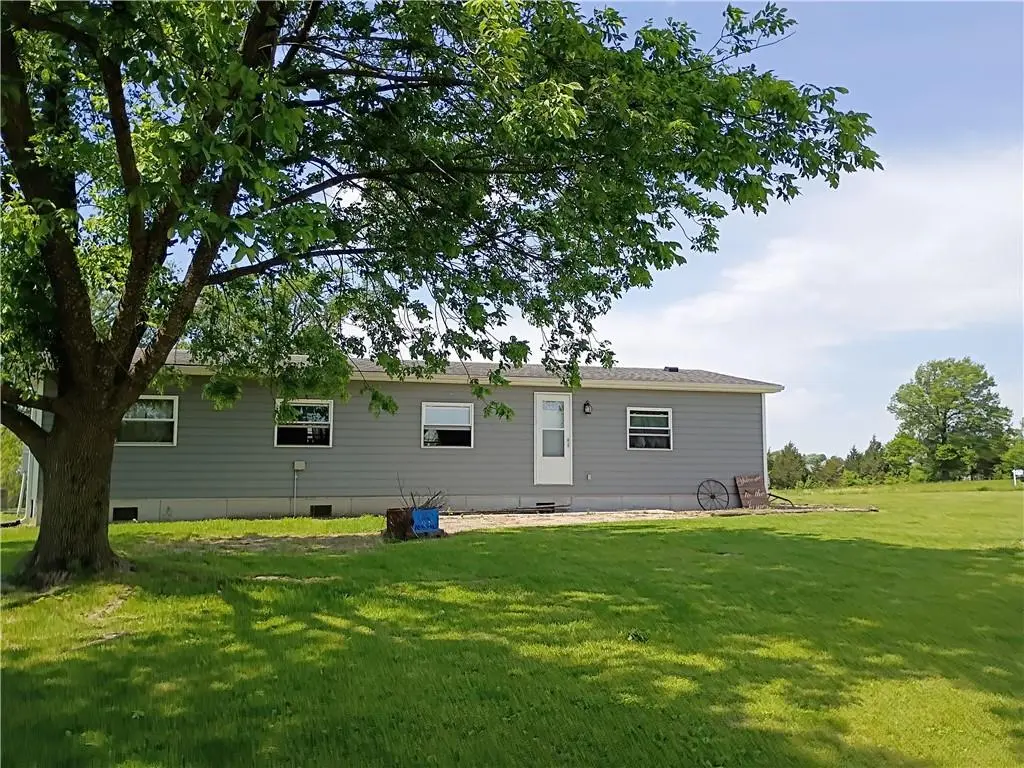
Situated on an oversized 250' x 160' lot, this property offers plenty of space, mature shade trees, and a peaceful setting on a quiet street. The home features 3 bedrooms and 2 bathrooms, along with a spacious 2.5-car garage/workshop—ideal for hobbies, storage, or extra workspace. This double-wide home has already had several major exterior updates, including new smart siding, new roof, and new windows, giving you a solid head start on improvements. Connected to city utilities, the property combines convenience with room to spread out. Inside, the home is in need of repairs and updates, making it a great opportunity for investors, flippers, or buyers ready to add their own finishing t
Key facts
- Quiet street
- New smart siding
- Oversized lot
Tags
Property features AI
Finance
- HOA & community: No association fees
Exterior
- Parking: Detached 2-car garage
- Utilities: Public water; Septic tank sewer
- Home design: Single-family residence; Mobile/manufactured home; Ranch style; One story
- Construction: Frame construction with lap siding; Composition roof; Built approximately 31–40 years ago
- Exterior features: Approximately 250 x 160 ft lot; Not in a flood plain
Interior
- Kitchen: Kitchen
- Bedrooms: 3 bedrooms (primary on main level)
- Bathrooms: 2 full bathrooms
- Heating & cooling: Natural gas heating; Has cooling (no central AC specified)
- Interior features: Ranch floor plan; Crawl space basement
Neighborhood map
What this means for you Summary
Snapshot
- This is a 3-bed/3.0-bath other listed at $125k.
Deal economics
- At list price, monthly cash flow is $87 ($1k/yr) — positive.
- The deal already cash-flows at list — no discount required.
- To meet the 1% rule (rent ≥ 1% of price), the offer needs to be $107k (14.6% below list).
- Recommended offer: $107k (14.6% below list) — sets the bar for 1% rule.
Location & tenants
- Location reads 69/100 on livability (#152 in MO) — a middle-class / working-renter tenant base. Strengths: cost of living A+, housing A+, crime A-; Watch: amenities F, commute F, health & safety F.
- Stanberry R-II (rural): math 50% / reading 50% proficiency, ranked #119 of 535 in MO (top 22%) — acceptable for families but not a draw, mixed tenant base, ~2y average lease.
- Market conditions: 12 active listings in the ZIP; 3 units permitted in Gentry County in 2024 (0 in 5+ unit buildings).
Forward outlook
- In year one you build about $5k of equity ($864 loan paydown + $4k appreciation (3.0% local appreciation)).
- At projected returns (3.0% appreciation + 3.0% rent growth), your $35k cash investment doubles in ~6 years — after that, you're playing with house money.
- By year 8, paydown + projected appreciation supports a ~$34k cash-out refi (75% LTV) — recoverable capital for the next deal without selling this one.
Negotiation context
- Only 2 days on market — expect competitive offers; lowballing is unlikely to land.
Questions for the listing agent
- Is there a deadline driving the sale (1031 exchange, divorce, estate, relocation)? That informs how much negotiation room exists.
- What's the average days-on-market for RENTAL listings here right now (not sales)? A rising rental-DOM trend means longer vacancies and softer asking-rent achievability than the comps imply.
- What's the recent tenant-quality profile in this submarket — average credit score on applications, eviction rate, late-payment / NSF rate, and stable-employment percentage? A property-management company in the area should have these aggregated.
- How much new for-sale + rental construction is in the pipeline within 1–3 miles? Heavy new supply typically softens prices + rents 12–24 months out; constrained supply supports both.
Investment metrics
- 1% rule
- 0.85% ✗
- Cap rate
- 7.13%
- Cash-on-cash
- 2.98%
- DSCR
- 1.13
- GRM
- 9.8
CMA / ARV
No comps found within radius.
Projected returns pro-forma
3.0% appreciation · 3.0% rent growth · sell at horizon
- IRR
- 10.3%
- Equity multiple
- 1.59×
- Total profit
- $20,532
- Equity at exit
- $56,160
- IRR
- 12.5%
- Equity multiple
- 2.87×
- Total profit
- $65,286
- Equity at exit
- $86,550
Cash invested: $34,972 (down + closing). Projections, not guarantees.
Landlord ↔ Tenant lean methodology
- Overall (STATE)
- 81 Strongly Landlord-Friendly
- State Missouri
- 81 Strongly Landlord-Friendly · R+10
- County
- — inherits STATE
- City
- — inherits STATE
ZIP-level market 64489
- Active inventory
- 12
- Price-to-rent
- 9.8×
Monthly cashflow live
- Estimated rent
- $1,067 medium interval (Pro) →
- Mortgage (P&I)
- −$655
- Tax from tax record
- −$49 /mo · $589/yr
- Insurance
- −$52
- HOA
- −$0
- Vacancy / Maint / Mgmt
- −$224
- Net cashflow
- $87
Break-even live
UW: 25.0% down · 7.5% · 30yr · 1.5% tax · 5.0% vac · 8.0% maint · 8.0% mgmt
Financing live
Cash to close
- Down payment
- $31,225
- Closing costs
- $3,747
- Reserves months
- —
- Total cash needed
- —
Loan-product check · same deal, 3 products live
Conventional
25% down · 7.5% · 30yr
- Down + closing
- —
- Monthly P&I
- —
- Monthly cashflow
- —
- DSCR
- —
- Eligible?
- —
Personal DTI + credit; lowest rate.
DSCR
20% down · 8.5% · 30yr
- Down + closing
- —
- Monthly P&I
- —
- Monthly cashflow
- —
- DSCR
- —
- Eligible?
- —
No personal income docs; deal must DSCR.
Hard money
10% down · 12.0% · 12mo
- Down + closing
- —
- Monthly P&I
- —
- Monthly cashflow
- —
- DSCR
- —
- Eligible?
- —
Short-term bridge; refi at stabilization.
Listing history 2 events
-
2026-05-15status Pending
-
2026-05-13$124,900 Active
ⓘ Source: listings_history table (triggers on properties + properties_extension) + one-shot
backfill from property_details.listing_events for pre-trigger history.
Tax reassessment forecast MO · Resets to sale price
- Current annual tax
- $589 · $49/mo
- Projected year-2 tax
- $1,212 · $101/mo
- Expected delta
- +$622/yr (+$52/mo · 105.6%)
ⓘ Screening estimate from a state-policy table — verify with the county assessor before closing.
Climate risk First Street
- Flood 1/10 Low FEMA zone X (unshaded) · 0% chance over 30 yrs
- Wildfire 1/10 Low
- Heat 3/10 Moderate 7 d/yr ≥105°F today · 15 d/yr by 30 yrs out
- Wind 2/10 Low
- Air quality 2/10 Low 0 unhealthy d/yr today · 1 by 30 yrs out
Nearby sold comps map
Loading sold comps map…
Walkable amenities ~0.75 mi
Loading nearby amenities…
Taxation est. · year 1
- Rental income
- $12,806
- − Mortgage interest
- −$6,996
- − Property taxes
- −$589
- − Insurance
- −$624
- − Repairs & maintenance
- −$1,024
- − Management
- −$1,024
- − Depreciation
- −$3,633
- Taxable loss
- −$1,087
- Est. tax savings @ 24.0%
- +$261
- After-tax cash flow
- $1,304/yr
For passive investors: Depreciation is non-cash, so a rental often shows a tax loss while cash-flowing — sheltering income. Rental losses are passive: they offset passive income freely, and up to $25,000/yr can offset ordinary (W-2) income if you actively participate and your MAGI is under $100k (phasing out to $0 by $150k); unused losses carry forward. On sale, claimed depreciation is recaptured at up to 25%, and gains may owe capital-gains tax (a 1031 exchange can defer both). Figures are a year-1 estimate at your 24.0% rate — not tax advice; consult a CPA.
Schools (NCES district)
- District
- Stanberry R-II
- NCES district ID
- 2929340
- Math proficiency
- 50% ▲ 5.00%
- Reading proficiency
- 50% ▬ 0.00%
- Median HH income
- $44,567
- Composite
- 44.29/100
- National rank
- #6164
- State rank
- #119 of 535 in MO
Livability — Stanberry
- Score
- 69/100
- State rank
- #152
- US rank
- #8604
Category grades
Schools grade is shown separately in the Schools card above.
Census & demographics
- Census place
- Stanberry, MO
- Population (ZIP)
- 2,211
Population outlook (Gentry County) Hauer SSP2
- Today (2025)
- 6,612 people
- By 2030
- 6,572 · -0.6%
- By 2040
- 6,521 · -1.4%
- By 2050
- 6,457 · -2.3%
- By 2075
- 6,346 · -4.0%
- By 2100
- 6,036 · -8.7%
Race, ethnicity, and origin ACS 2023
- Neighborhood character
- Predominantly White (95%)
- Race & ethnicity
- White 95% Two or more races 3% Hispanic / Latino 1%
- Common ancestry
- Iranian 3% Italian 2% Slovak 1%
- Foreign-born
- 1% · South Korea
- Languages at home
- 89% English-only · German/W. Germanic 10% Tagalog/Filipino 1%
Political lean MEDSL · Gentry
- 2024 margin
- Solid R (+61.8) · D 18.7% · R 80.5%
- 2008→2024 swing
- -39.7pp toward R · 2008: -22.1pp · 2024: -61.8pp
- All cycles
- 2024: R+61.8 2020: R+60.8 2016: R+56.0 2012: R+35.0 2008: R+22.1
Not yet ingested
- Civics
- —
Market trends
- HPI YoY
- —
- Current HPI
- —
- Rent YoY
- —
- Metro
- —
- State GDP YoY
- ▲ 1.84%
- F500 in state
- 20
Industry mix (Fortune 500 HQ in MO)
| Industry | F500 HQs | Revenue |
|---|---|---|
| Healthcare | 1 | $163B |
|
||
| Insurance | 1 | $21B |
|
||
| Industrial Technology | 1 | $17B |
|
||
| Retail | 1 | $16B |
|
||
| Industrial Distribution | 1 | $10B |
|
||
| Utilities | 1 | $9B |
|
||
Price history
2 events — show timeline
- 2026-05-15 Pending — Heartland MLS as Distributed by MLS Grid
- 2026-05-13 Listed $124,900 Heartland MLS as Distributed by MLS Grid
Property tax history
+1.2%/yrLatest (2025): $589 · +6.8% YoY. Source: county tax records.
Cash-flow waterfall
monthlySold comps — $/sqft
last 12 mo · ≤1 miLoading sold comps…