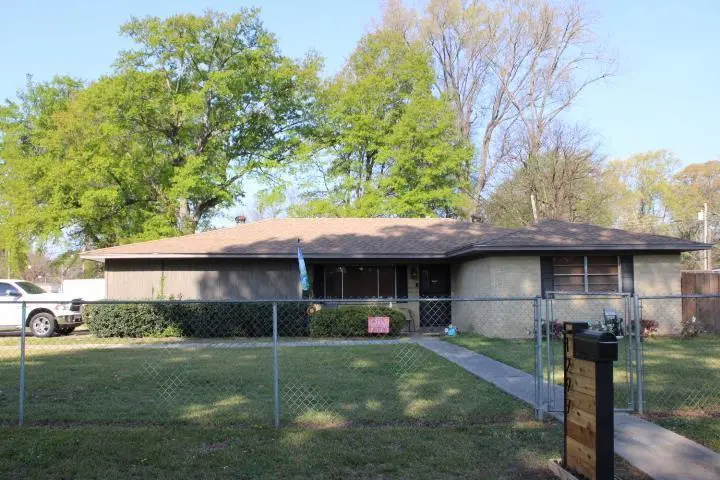
1297 John St · Greenville, MS
Flood risk 1/10 · Minimal
- FEMA flood zone
- X
- Chance of flooding over 30 yrs
- 0.0%
- Est. flood insurance / yr
- $507 – $1,088
Fire risk 1/10 · Minimal
- Est. fire insurance / yr
- $1,241 – $2,305
Heat risk 7/10 · Major
- Hot days now (above 110°F)
- 7 days/yr
- Hot days in 30 yrs
- 21 days/yr
Wind risk 6/10 · Moderate
- Chance of severe wind over 30 yrs
- 37.0%
Air-quality risk 1/10 · Minimal
- Unhealthy air days now
- 0 days/yr
- Unhealthy air days in 30 yrs
- 0 days/yr
Risk factors via First Street. Map © Google.
Why this score? — see what drove the D grade
The composite is a weighted blend of 9 inputs, each scored 0–100. Each bar is that input's sub-score; the figure is the points it added to the 100-point composite (weight × sub-score).
- Cash flow +17.0/30.0
- ARV discount +7.5/15.0
- DSCR +5.3/10.0
- 1% rule +4.1/10.0
- Livability +2.9/5.0
- Rent growth +2.5/5.0
- Condition / age +2.5/5.0
- Schools +0.5/10.0
- Appreciation +0.0/10.0
$125,000
🖨 Deal sheet (PDF) 📄 Offer letter ✓ Due diligence
Listing remarks MLS
ALL OFFERS MUST BE SUBMITTED BY THE BUYER'S AGENT USING THE ONLINE OFFER MANAGEMENT SYSTEM. ACCESS THE SYSTEM VIA THE LINK BELOW. A TECHNOLOGY FEE APPLY TO THE BUYER'S AGENT UPON CONSULTATION OF A SALE. EMPLOYEES AND FAMILY MEMBERS RESIDING WITH EMPLOYEES OF JP MORGAN CHASE BANK, N. A. ITS AFFLIATES OR SUBSIDIARIES ARE STRICTLY PROHIBITED FROM DIRECTLY. SELLER PAID $1,183.00 IN CC.
Key facts
- 8,611 sq ft lot
- Built 1958
- Listed 86 days
Property features AI
Exterior
- Parking: Concrete parking
- Utilities: Public water; Public sewer
- Home design: Residential single family home (Traditional)
- Construction: Brick veneer exterior; Composition roof; Slab foundation; Built as a single-story (traditional) residence
- Exterior features: Patio; Chain link fencing
Interior
- Flooring: Ceramic tile; Hardwood
- Bathrooms: 2 full bathrooms
- Heating & cooling: Central heating; Central air conditioning
- Interior features: Gas water heater
- Laundry & utility: Dedicated laundry room
Neighborhood map
What this means for you Summary
Snapshot
- This is a 3-bed/1.0-bath single-family listed at $125k.
Deal economics
- At list price, monthly cash flow is $85 ($1k/yr) — positive.
- The deal already cash-flows at list — no discount required.
- To meet the 1% rule (rent ≥ 1% of price), the offer needs to be $114k (9.0% below list).
- Recommended offer: $114k (9.0% below list) — sets the bar for 1% rule.
- Cap rate 7.1% vs local median 4.5% in Greenville — top-decile yield for the area; either an underpriced asset or a hidden risk that comps aren't pricing in. Stress-test before assuming the spread holds.
Location & tenants
- Location reads 57/100 on livability (#284 in MS) — a working-class tenant base; expect higher turnover. Strengths: cost of living A+, housing A; Watch: amenities F, commute F, employment F.
- Greenville Public Schools (town): math 4% / reading 11% proficiency, ranked #126 of 130 in MS (top 97%) — low school quality limits family demand, transient renter base, plan for 1-2y turnover; 93% free/reduced lunch — lower-income household profile, screen leases tightly.
- Zoned schools: Boyd Elementary School (math 2% / reading 10%, grade F, #354 of 375 statewide, top 94%, 311 students, 100% FRL); T.L. Weston Middle School (math 5% / reading 12%, grade F, #163 of 179 statewide, top 92%, 428 students, 100% FRL); Greenville High School (math 3% / reading 12%, grade F, #184 of 197 statewide, top 94%, 871 students, 100% FRL).
- Market conditions: 128 active listings in the ZIP; 3 comparable units currently listed for rent nearby; rentals lingering (median 46d on market — plan ~5-8 weeks vacancy on turnover, expect pricing pressure); 100% of comp listings sitting > 30 days — soft ceiling on asking rent; 10 units permitted in Washington County in 2024 (0 in 5+ unit buildings).
Forward outlook
- Local home prices are declining (-3.0%/yr); year-one equity from $864 of loan paydown is wiped out by about $4k of value loss. Plan a longer hold.
- Washington County population projected at -36% by 2050 — secular population decline; favor cash flow + early exit over multi-decade hold.
Negotiation context
- It's been on market 86 days — a 6% lower offer ($118k) is reasonable based on typical stale-listing flexibility.
- 2 sale attempts since 10y ago with the ask held roughly flat each time — persistent listings suggest the price (not the market) is what's stuck; bring a comps-based counter.
- Current owner paid $54k; list at $125k implies a 131% gain — meaningful room to come down on a strong offer.
Risks & watch-outs
- Watch-outs: built in 1958 — expect roof / HVAC / electrical / plumbing capex.
- Climate carrying-cost: major wind risk, 37% chance of damaging wind over 30y; extreme-heat days projected 7→21/yr by 2055 (HVAC capex compounding) — expect insurance premiums to compound above CPI over the hold.
Questions for the listing agent
- It's been on market 86 days. Have you received any prior offers? Is the seller open to a 9% concession, seller financing, or rate buy-down credit?
- Built in 1958 — when were the roof, HVAC, electrical panel, plumbing, and water heater last replaced?
- Why hasn't it sold? Are there any deal-killer items the seller is aware of (foundation, flood, title, zoning, code violations)?
- Is there a deadline driving the sale (1031 exchange, divorce, estate, relocation)? That informs how much negotiation room exists.
- Schools are F-rated, which usually means shorter tenancies and higher turnover. Who's the typical renter profile here, and what's been the actual vacancy rate?
- The area grade is low — what's the realistic commute time and amenity access for the typical tenant pool here? Any planned neighborhood developments (good or bad) we should know about?
- What's the average days-on-market for RENTAL listings here right now (not sales)? A rising rental-DOM trend means longer vacancies and softer asking-rent achievability than the comps imply.
- What's the recent tenant-quality profile in this submarket — average credit score on applications, eviction rate, late-payment / NSF rate, and stable-employment percentage? A property-management company in the area should have these aggregated.
- How much new for-sale + rental construction is in the pipeline within 1–3 miles? Heavy new supply typically softens prices + rents 12–24 months out; constrained supply supports both.
Investment metrics
- 1% rule
- 0.91% ✗
- Cap rate
- 7.11%
- Cash-on-cash
- 2.92%
- DSCR
- 1.13
- GRM
- 9.2
CMA / ARV
- ARV (on-the-fly)
- $72,675
- Comps found
- 9
Show comp detail 9 sales within ~0.75 mi
| Address | Dist | Beds/Ba | Sqft | Sold | Price | $/sf | Match |
|---|---|---|---|---|---|---|---|
| 1044 Baskin Dr | 0.50mi | 3/2.0 | 1,455 (+2%) | 1mo | $80,000 | $55 | 68 |
| 1573 Alden Ln | 0.57mi | 3/2.0 | 1,434 (+1%) | 1mo | $179,900 | $125 | 68 |
| 1315 S Saint Marys Cir | 0.37mi | 3/2.0 | 1,512 (+6%) | 4mo | $57,900 | $38 | 65 |
| 309 Neff St | 0.73mi | 3/1.0 | 1,387 (-3%) | 4mo | $30,000 | $22 | 58 |
| 1617 East David Cir | 0.52mi | 3/1.5 | 1,470 (+3%) | 16mo | $110,250 | $75 | 55 |
| 1427 Genie Fairway | 0.61mi | 3/2.0 | 1,584 (+11%) | 2mo | $145,000 | $92 | 47 |
| 1472 Francis | 0.33mi | 3/1.5 | 1,230 (-14%) | 18mo | $42,500 | $35 | 45 |
| 1237 Longview Dr | 0.54mi | 2/1.0 (-1) | 1,251 (-12%) | 21mo | $60,000 | $48 | 32 |
| 473 Jo Ann Cir | 0.64mi | 3/2.0 | 1,239 (-13%) | 22mo | $63,000 | $51 | 26 |
Match score weights: distance 35% · size 25% · config 20% · recency 20%. Top-matched comps best support the ARV.
Projected returns pro-forma
-3.0% appreciation · 3.0% rent growth · sell at horizon
- IRR
- -11.7%
- Equity multiple
- 0.58×
- Total profit
- $-14,846
- Equity at exit
- $18,638
- IRR
- -2.5%
- Equity multiple
- 0.83×
- Total profit
- $-6,000
- Equity at exit
- $10,808
Cash invested: $35,000 (down + closing). Projections, not guarantees.
Landlord ↔ Tenant lean methodology
- Overall (STATE)
- 90 Strongly Landlord-Friendly
- State Mississippi
- 90 Strongly Landlord-Friendly · R+11
- County
- — inherits STATE
- City
- — inherits STATE
ZIP-level market 38701
- Active inventory
- 128
- Price-to-rent
- 9.2×
Monthly cashflow live
- Estimated rent
- $1,138 medium interval (Pro) →
- Mortgage (P&I)
- −$656
- Tax from tax record
- −$106 /mo · $1,275/yr
- Insurance
- −$52
- HOA
- −$0
- Vacancy / Maint / Mgmt
- −$239
- Net cashflow
- $85
Break-even live
Sensitivity live
| Price | -10% $156 | -5% $121 | +0% $85 | +5% $50 | +10% $14 |
|---|---|---|---|---|---|
| Rent | -10% $-5 | -5% $40 | +0% $85 | +5% $130 | +10% $175 |
| Rate | -1.0pp $148 | -0.5pp $117 | base $85 | +0.5pp $53 | +1.0pp $20 |
UW: 25.0% down · 7.5% · 30yr · 1.5% tax · 5.0% vac · 8.0% maint · 8.0% mgmt
Financing live
Cash to close
- Down payment
- $31,250
- Closing costs
- $3,750
- Reserves months
- —
- Total cash needed
- —
Loan-product check · same deal, 3 products live
Conventional
25% down · 7.5% · 30yr
- Down + closing
- —
- Monthly P&I
- —
- Monthly cashflow
- —
- DSCR
- —
- Eligible?
- —
Personal DTI + credit; lowest rate.
DSCR
20% down · 8.5% · 30yr
- Down + closing
- —
- Monthly P&I
- —
- Monthly cashflow
- —
- DSCR
- —
- Eligible?
- —
No personal income docs; deal must DSCR.
Hard money
10% down · 12.0% · 12mo
- Down + closing
- —
- Monthly P&I
- —
- Monthly cashflow
- —
- DSCR
- —
- Eligible?
- —
Short-term bridge; refi at stabilization.
Rent comps 3 comps
| Address | Beds | Baths | Sqft | Rent | $/sqft | DOM | Units | Dist |
|---|---|---|---|---|---|---|---|---|
| 1462 S Colorado St Greenville, MS | 2.0–3.0 | 2.0 | 1150 | $1,358 | $1.18 | 45d | 4 | 0.57mi |
| 614 Fairview Ave Unit 7 Greenville, MS | 2.0 | 1.0 | 950 | $799 | $0.84 | 45d | 1 | 0.94mi |
| 250 Cypress Ln Greenville, MS | 1.0–2.0 | 1.0–1.5 | 807 | $959 | $1.19 | 45d | 1 | 1.38mi |
Listing history 20 events
-
2026-06-21days on market $125,000 Active 86 DOM
-
2026-06-21days on market $125,000 Active 85 DOM
-
2026-06-18days on market $125,000 Active 83 DOM
-
2026-06-17days on market $125,000 Active 82 DOM
-
2026-06-16days on market $125,000 Active 81 DOM
-
2026-06-15days on market $125,000 Active 80 DOM
-
2026-06-13days on market $125,000 Active 78 DOM
-
2026-06-12days on market $125,000 Active 77 DOM
-
2026-06-09days on market $125,000 Active 74 DOM
-
2026-06-08days on market $125,000 Active 73 DOM
-
2026-06-07days on market $125,000 Active 72 DOM
-
2026-06-04days on market $125,000 Active 68 DOM
-
2026-06-02pricedays on market $125,000 Active 67 DOM
-
2026-06-01days on market $130,000 Active 66 DOM
-
2026-05-31days on market $130,000 Active 65 DOM
-
2026-03-27$130,000 Active
-
2017-07-12soldstatus $54,000
-
2017-02-09soldstatus 384-char remark
Show marketing remark (384 chars)
ALL OFFERS MUST BE SUBMITTED BY THE BUYER'S AGENT USING THE ONLINE OFFER MANAGEMENT SYSTEM. ACCESS THE SYSTEM VIA THE LINK BELOW. A TECHNOLOGY FEE APPLY TO THE BUYER'S AGENT UPON CONSULTATION OF A SALE. EMPLOYEES AND FAMILY MEMBERS RESIDING WITH EMPLOYEES OF JP MORGAN CHASE BANK, N. A. ITS AFFLIATES OR SUBSIDIARIES ARE STRICTLY PROHIBITED FROM DIRECTLY. SELLER PAID $1,183.00 IN CC.
-
2016-12-02$20,800 384-char remark
Show marketing remark (384 chars)
ALL OFFERS MUST BE SUBMITTED BY THE BUYER'S AGENT USING THE ONLINE OFFER MANAGEMENT SYSTEM. ACCESS THE SYSTEM VIA THE LINK BELOW. A TECHNOLOGY FEE APPLY TO THE BUYER'S AGENT UPON CONSULTATION OF A SALE. EMPLOYEES AND FAMILY MEMBERS RESIDING WITH EMPLOYEES OF JP MORGAN CHASE BANK, N. A. ITS AFFLIATES OR SUBSIDIARIES ARE STRICTLY PROHIBITED FROM DIRECTLY. SELLER PAID $1,183.00 IN CC.
-
2004-02-23soldstatus
ⓘ Source: listings_history table (triggers on properties + properties_extension) + one-shot
backfill from property_details.listing_events for pre-trigger history.
Tax reassessment forecast MS · Resets to sale price
- Current annual tax
- $1,275 · $106/mo
- Projected year-2 tax
- $1,275 · $106/mo
- Expected delta
- $0/yr ($0/mo · 0.0%)
ⓘ Screening estimate from a state-policy table — verify with the county assessor before closing.
Climate risk First Street
- Flood 1/10 Low FEMA zone X · 0% chance over 30 yrs
- Wildfire 1/10 Low
- Heat 7/10 Severe 7 d/yr ≥110°F today · 21 d/yr by 30 yrs out
- Wind 6/10 Major 37% chance of damaging wind over 30 yrs
- Air quality 1/10 Low 0 unhealthy d/yr today · 0 by 30 yrs out
Nearby sold comps map
Loading sold comps map…
Walkable amenities ~0.75 mi
Loading nearby amenities…
Taxation est. · year 1
- Rental income
- $13,656
- − Mortgage interest
- −$7,002
- − Property taxes
- −$1,275
- − Insurance
- −$625
- − Repairs & maintenance
- −$1,092
- − Management
- −$1,092
- − Depreciation
- −$3,636
- Taxable loss
- −$1,068
- Est. tax savings @ 24.0%
- +$256
- After-tax cash flow
- $1,278/yr
For passive investors: Depreciation is non-cash, so a rental often shows a tax loss while cash-flowing — sheltering income. Rental losses are passive: they offset passive income freely, and up to $25,000/yr can offset ordinary (W-2) income if you actively participate and your MAGI is under $100k (phasing out to $0 by $150k); unused losses carry forward. On sale, claimed depreciation is recaptured at up to 25%, and gains may owe capital-gains tax (a 1031 exchange can defer both). Figures are a year-1 estimate at your 24.0% rate — not tax advice; consult a CPA.
Schools (NCES district)
- District
- Greenville Public Schools
- NCES district ID
- 2801620
- Math proficiency
- 4% ▼ -20.00%
- Reading proficiency
- 11% ▼ -12.00%
- Median HH income
- $26,432
- Composite
- 5.27/100
- National rank
- #10035
- State rank
- #126 of 130 in MS
Livability — Greenville
- Score
- 57/100
- State rank
- #284
- US rank
- #21778
Category grades
Schools grade is shown separately in the Schools card above.
Census & demographics
- Census place
- Greenville, MS
- Population (ZIP)
- 21,260
Population outlook (Washington County) Hauer SSP2
- Today (2025)
- 41,424 people
- By 2030
- 38,061 · -8.1%
- By 2040
- 31,752 · -23.3%
- By 2050
- 26,394 · -36.3%
- By 2075
- 17,180 · -58.5%
- By 2100
- 12,936 · -68.8%
Race, ethnicity, and origin ACS 2023
- Neighborhood character
- Predominantly Black (73%)
- Race & ethnicity
- Black 73% White 24% Asian 2%
- Common ancestry
- Lithuanian 1%
- Foreign-born
- 1%
- Languages at home
- 96% English-only · Spanish 1% Other Indo-European 1%
Political lean MEDSL · Washington
- 2024 margin
- Solid D (+35.0) · D 67.0% · R 32.0% · Other 1.1%
- 2008→2024 swing
- +0.2pp no change · 2008: 34.7pp · 2024: 35.0pp
- All cycles
- 2024: D+35.0 2020: D+40.0 2016: D+36.4 2012: D+42.7 2008: D+34.7
Not yet ingested
- Civics
- —
Market trends
- HPI YoY
- ▼ -102.75%
- Current HPI
- 52.6126
- Rent YoY
- —
- Metro
- —
- State GDP YoY
- —
- F500 in state
- 0
Price history
+525.0% since first listed5 events — show timeline
- 2026-03-27 Listed $130,000 Greenville Area MLS
- 2017-07-12 Sold (Public Records) $54,000 Public Records
- 2017-02-09 Sold (MLS) — Greenville Area MLS
- 2016-12-02 Listed $20,800 Greenville Area MLS
- 2004-02-23 Sold (Public Records) — Public Records
Property tax history
+2.9%/yrLatest (2025): $1,275 · +5.0% YoY. Source: county tax records.
Cash-flow waterfall
monthlySold comps — $/sqft
last 12 mo · ≤1 miLoading sold comps…