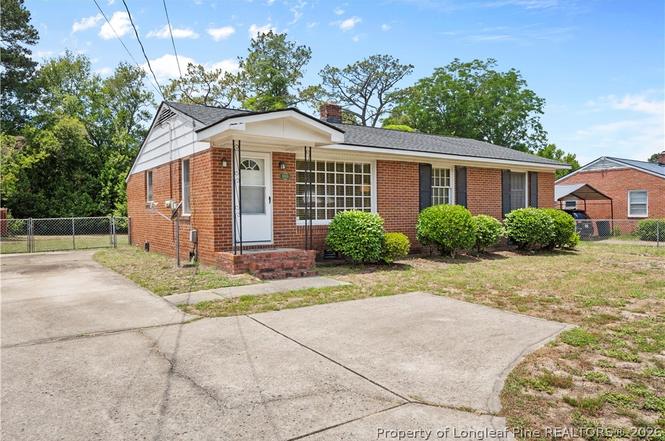
1910 Ireland Dr · Fayetteville, NC
Flood risk 1/10 · Minimal
- FEMA flood zone
- X (unshaded)
- Chance of flooding over 30 yrs
- 0.0%
- Est. flood insurance / yr
- $507 – $1,088
Fire risk 4/10 · Minor
- Est. fire insurance / yr
- $906 – $1,684
Heat risk 7/10 · Major
- Hot days now (above 106°F)
- 7 days/yr
- Hot days in 30 yrs
- 16 days/yr
Wind risk 8/10 · Major
- Chance of severe wind over 30 yrs
- 80.0%
Air-quality risk 1/10 · Minimal
- Unhealthy air days now
- 0 days/yr
- Unhealthy air days in 30 yrs
- 0 days/yr
Risk factors via First Street. Map © Google.
Why this score? — see what drove the D+ grade
The composite is a weighted blend of 9 inputs, each scored 0–100. Each bar is that input's sub-score; the figure is the points it added to the 100-point composite (weight × sub-score).
- Cash flow +15.4/30.0
- ARV discount +12.9/15.0
- DSCR +4.7/10.0
- 1% rule +3.9/10.0
- Livability +3.8/5.0
- Rent growth +3.3/5.0
- Schools +3.1/10.0
- Condition / age +2.5/5.0
- Appreciation +0.0/10.0
$175,000
🖨 Deal sheet (PDF) 📄 Offer letter ✓ Due diligence
Listing remarks
* * * $10,000 in seller concessions * * This cute starter home is everything you need. Large fenced in backyard. Plenty of parking. Large family room as soon as you walk in, Kitchen has plenty of room for a large table. Three cozy bedrooms to finish off this sweet home. This home is two minutes from Cape Fear valley and seconds from everything you could need. Perfect for you settle in and learn Fayetteville.
Key facts
- Large family room
- Fenced in backyard
- Built 1960
Tags
Property features AI
Finance
- Other: Listed by Longleaf Pine Realtors
Exterior
- Utilities: Public water; Public sewer
- Home design: Single-family residential property
- Construction: Brick construction
- Exterior features: Fenced yard; Subdivision: WELMAR HEIGHTS; GPS-friendly directions
Interior
- Bedrooms: Total of 5 rooms (bedroom count not specified separately)
- Flooring: Carpet; Vinyl
- Bathrooms: 1 full bathroom; 1 half bathroom
- Heating & cooling: Central air conditioning; Has cooling
- Interior features: Carpet and vinyl flooring; No fireplace; Crawl space basement
Neighborhood map
What this means for you Summary
Snapshot
- This is a 3-bed/2.0-bath single-family listed at $175k.
Deal economics
- At list price, monthly cash flow is $67 ($798/yr) — positive.
- The deal already cash-flows at list — no discount required.
- To meet the 1% rule (rent ≥ 1% of price), the offer needs to be $156k (11.1% below list).
- Recommended offer: $156k (11.1% below list) — sets the bar for 1% rule.
- Cap rate 6.7% vs local median 4.8% in Fayetteville — top-decile yield for the area; either an underpriced asset or a hidden risk that comps aren't pricing in. Stress-test before assuming the spread holds.
Location & tenants
- Location reads 75/100 on livability (#45 in NC, #4,031 nationally) — a middle-class / working-renter tenant base. Strengths: commute A+, cost of living A+, housing A+; Watch: crime F, employment D-.
- Cumberland County Schools (urban): math 32% / reading 41% proficiency, ranked #126 of 178 in NC (top 71%) — families likely to look elsewhere, expect single-tenant / working-renter base with shorter leases.
- Zoned schools: Mary Mcarthur Elementary (math 17% / reading 27%, grade F, #1,190 of 1,410 statewide, top 86%, 371 students, 99% FRL); Douglas Byrd Middle (math 13% / reading 30%, grade F, #422 of 475 statewide, top 89%, 935 students, 100% FRL); Douglas Byrd High (math 22% / reading 42%, grade F, #445 of 535 statewide, top 84%, 940 students, 99% FRL) — zoned schools average 99% FRL vs 55% district-wide (45 pts higher); higher-poverty schools than district average — tighter screening recommended.
- Market conditions: Rents rising (+3.2%/yr); 308 active listings in the ZIP; 31 comparable units currently listed for rent nearby; rentals at typical pace (median 26d on market — plan ~3-4 weeks tenant-placement turnaround); 1,125 units permitted in Cumberland County in 2024 (104 in 5+ unit buildings).
- This rent runs 32% of the median local income ($59k/yr) — at the standard rent-burdened threshold; future hikes will face affordability resistance.
Forward outlook
- Local home prices are declining (-3.0%/yr); year-one equity from $1k of loan paydown is wiped out by about $5k of value loss. Plan a longer hold.
Negotiation context
- Only 1 days on market — expect competitive offers; lowballing is unlikely to land.
Risks & watch-outs
- Climate carrying-cost: severe wind risk, 80% chance of damaging wind over 30y; extreme-heat days projected 7→16/yr by 2055 (HVAC capex compounding) — expect insurance premiums to compound above CPI over the hold.
Questions for the listing agent
- Built in 1960 — when were the roof, HVAC, electrical panel, plumbing, and water heater last replaced?
- Is there a deadline driving the sale (1031 exchange, divorce, estate, relocation)? That informs how much negotiation room exists.
- Crime grade is F in this area — have there been break-ins, vandalism, or insurance claims at this property in the last 3 years? What carrier currently insures it and at what premium?
- The area grade is low — what's the realistic commute time and amenity access for the typical tenant pool here? Any planned neighborhood developments (good or bad) we should know about?
- What's the average days-on-market for RENTAL listings here right now (not sales)? A rising rental-DOM trend means longer vacancies and softer asking-rent achievability than the comps imply.
- What's the recent tenant-quality profile in this submarket — average credit score on applications, eviction rate, late-payment / NSF rate, and stable-employment percentage? A property-management company in the area should have these aggregated.
- How much new for-sale + rental construction is in the pipeline within 1–3 miles? Heavy new supply typically softens prices + rents 12–24 months out; constrained supply supports both.
Investment metrics
- 1% rule
- 0.89% ✗
- Cap rate
- 6.75%
- Cash-on-cash
- 1.63%
- DSCR
- 1.07
- GRM
- 9.4
CMA / ARV
- ARV (on-the-fly)
- $198,660
- Comps found
- 12
Show comp detail 12 sales within ~0.75 mi
| Address | Dist | Beds/Ba | Sqft | Sold | Price | $/sf | Match |
|---|---|---|---|---|---|---|---|
| 1726 Martindale Dr | 0.41mi | 3/2.5 | 1,311 (+2%) | 2mo | $223,000 | $170 | 75 |
| 2205 Dixie Trl | 0.39mi | 3/2.0 | 1,399 (+8%) | 2mo | $203,000 | $145 | 66 |
| 1914 Wyatt St | 0.33mi | 3/2.0 | 1,431 (+11%) | 1mo | $205,000 | $143 | 66 |
| 1939 Crestview Dr | 0.18mi | 3/1.0 | 1,100 (-15%) | 1mo | $169,500 | $154 | 62 |
| 4148 Village Dr | 0.48mi | 3/2.0 | 1,157 (-10%) | 2mo | $197,500 | $171 | 59 |
| 1810 Ashton Rd | 0.66mi | 3/1.5 | 1,348 (+4%) | 2mo | $204,900 | $152 | 58 |
| 1910 Stockton Dr | 0.46mi | 3/1.5 | 1,157 (-10%) | 2mo | $177,500 | $153 | 58 |
| 3315 Nato Rd | 0.66mi | 3/1.5 | 1,224 (-5%) | 2mo | $167,500 | $137 | 57 |
| 4212 Forest View Dr | 0.37mi | 3/1.0 | 1,098 (-15%) | 1mo | $164,900 | $150 | 53 |
| 4521 Park Knoll Ln | 0.73mi | 3/2.0 | 1,182 (-8%) | 0mo | $200,000 | $169 | 52 |
| 1209 Martindale Dr | 0.50mi | 3/1.0 | 1,132 (-12%) | 1mo | $175,000 | $155 | 51 |
| 1707 Camelot Dr | 0.74mi | 3/2.0 | 1,116 (-14%) | 2mo | $204,000 | $183 | 42 |
Match score weights: distance 35% · size 25% · config 20% · recency 20%. Top-matched comps best support the ARV.
Projected returns pro-forma
-3.0% appreciation · 3.17% rent growth · sell at horizon
- IRR
- -13.5%
- Equity multiple
- 0.51×
- Total profit
- $-23,860
- Equity at exit
- $26,093
- IRR
- -4.4%
- Equity multiple
- 0.71×
- Total profit
- $-14,247
- Equity at exit
- $15,131
Cash invested: $49,000 (down + closing). Projections, not guarantees.
Landlord ↔ Tenant lean methodology
- Overall (STATE)
- 85 Strongly Landlord-Friendly
- State North Carolina
- 85 Strongly Landlord-Friendly · R+3
- County
- — inherits STATE
- City
- — inherits STATE
ZIP-level market 28304
- Home prices YoY
- -21.7%
- Rents YoY
- 3.2%
- Active inventory
- 308
- Price-to-rent
- 9.4×
Monthly cashflow live
- Estimated rent
- $1,555 high interval (Pro) →
- Mortgage (P&I)
- −$918
- Tax from tax record
- −$172 /mo · $2,059/yr
- Insurance
- −$73
- HOA
- −$0
- Lot rent
- −$0
- Vacancy / Maint / Mgmt
- −$327
- Net cashflow
- $67
Break-even live
Sensitivity live
| Price | -10% $166 | -5% $116 | +0% $67 | +5% $17 | +10% $-33 |
|---|---|---|---|---|---|
| Rent | -10% $-56 | -5% $5 | +0% $67 | +5% $128 | +10% $189 |
| Rate | -1.0pp $155 | -0.5pp $111 | base $67 | +0.5pp $21 | +1.0pp $-25 |
UW: 25.0% down · 7.5% · 30yr · 1.5% tax · 5.0% vac · 8.0% maint · 8.0% mgmt
Financing live
Cash to close
- Down payment
- $43,750
- Closing costs
- $5,250
- Reserves months
- —
- Total cash needed
- —
Loan-product check · same deal, 3 products live
Conventional
25% down · 7.5% · 30yr
- Down + closing
- —
- Monthly P&I
- —
- Monthly cashflow
- —
- DSCR
- —
- Eligible?
- —
Personal DTI + credit; lowest rate.
DSCR
20% down · 8.5% · 30yr
- Down + closing
- —
- Monthly P&I
- —
- Monthly cashflow
- —
- DSCR
- —
- Eligible?
- —
No personal income docs; deal must DSCR.
Hard money
10% down · 12.0% · 12mo
- Down + closing
- —
- Monthly P&I
- —
- Monthly cashflow
- —
- DSCR
- —
- Eligible?
- —
Short-term bridge; refi at stabilization.
Rent comps 31 comps
| Address | Beds | Baths | Sqft | Rent | $/sqft | DOM | Units | Dist |
|---|---|---|---|---|---|---|---|---|
| 1805 Wayne Ln Fayetteville, NC | 3.0 | 1.0 | 975 | $2,400 | $2.46 | 25d | 1 | 0.28mi |
| 3325 Boone Trl Fayetteville, NC | 4.0 | 2.0 | 1494 | $1,960 | $1.31 | 16d | 1 | 0.54mi |
| 4101 Coventry Rd Fayetteville, NC | 3.0 | 1.0 | 1132 | $1,150 | $1.02 | 16d | 1 | 0.56mi |
| 3526 Furman Dr Fayetteville, NC | 3.0 | 1.5 | 1050 | $1,500 | $1.43 | 25d | 1 | 0.64mi |
| 3918 Donna St Fayetteville, NC | 3.0 | 1.0 | 1000 | $1,350 | $1.35 | 25d | 1 | 0.79mi |
| 3120 Phillies Cir Fayetteville, NC | 3.0 | 1.5 | 1418 | $1,650 | $1.16 | 23d | 1 | 0.81mi |
| 910 Miller Ave Unit 910 Fayetteville, NC | 2.0 | 2.0 | 1000 | $1,250 | $1.25 | 25d | 1 | 0.84mi |
| 2690 Belhaven Rd Fayetteville, NC | 3.0 | 1.0 | 1264 | $1,350 | $1.07 | 25d | 1 | 0.87mi |
| 4630 Canterbury Rd Fayetteville, NC | 3.0 | 2.0 | 1250 | $1,350 | $1.08 | 25d | 1 | 0.93mi |
| 1819 Cawdor Dr Fayetteville, NC | 3.0 | 2.5 | 1572 | $1,600 | $1.02 | 16d | 1 | 0.94mi |
| 600 Faison Ave Fayetteville, NC | 3.0 | 2.0 | 1802 | $1,495 | $0.83 | 25d | 1 | 1.03mi |
| 1313 Ireland Dr Unit B Fayetteville, NC | 2.0 | 1.5 | 900 | $1,000 | $1.11 | 25d | 1 | 1.14mi |
| 5032 Shimmer Dr Fayetteville, NC | 4.0 | 2.0 | 1473 | $1,700 | $1.15 | 16d | 1 | 1.15mi |
| 5032 Shimmer Dr Fayetteville, NC | 4.0 | 2.0 | 1473 | $1,750 | $1.19 | 25d | 1 | 1.15mi |
| 1309 Ireland Dr Fayetteville, NC | 2.0 | 1.5 | 900 | $1,000 | $1.11 | 16d | 1 | 1.15mi |
| 400 Roxie Ave Fayetteville, NC | 2.0 | 2.0 | 1162 | $1,700 | $1.46 | 16d | 1 | 1.16mi |
| 395 Hicks Ave Fayetteville, NC | 3.0 | 2.5 | 1519 | $1,550 | $1.02 | 25d | 1 | 1.19mi |
| 2207 Puffin Pl Fayetteville, NC | 3.0 | 2.0 | 1214 | $1,950 | $1.61 | 16d | 1 | 1.20mi |
| 4909 Walnut Dr Fayetteville, NC | 3.0 | 2.0 | 1188 | $1,500 | $1.26 | 25d | 1 | 1.30mi |
| 1214 Berkshire Rd Fayetteville, NC | 4.0 | 2.0 | 1668 | $800 | $0.48 | 25d | 1 | 1.30mi |
| 1401 Habersham Dr Fayetteville, NC | 3.0 | 2.0 | 1250 | $1,700 | $1.36 | 25d | 1 | 1.31mi |
| 2809 Trentwood Ct Fayetteville, NC | 3.0 | 2.0 | 1550 | $1,595 | $1.03 | 25d | 1 | 1.31mi |
| 1813 Stetson Ln Fayetteville, NC | 3.0 | 2.0 | 1730 | $2,095 | $1.21 | 16d | 1 | 1.33mi |
| 4935 Walnut Dr Fayetteville, NC | 3.0 | 1.5 | 1024 | $1,200 | $1.17 | 16d | 1 | 1.38mi |
| 1209 Snowy Egret Dr Fayetteville, NC | 3.0 | 2.5 | 1470 | $1,800 | $1.22 | 25d | 1 | 1.39mi |
| 2808 Player Ave Fayetteville, NC | 3.0 | 2.0 | 1546 | $1,600 | $1.03 | 25d | 1 | 1.42mi |
| 4810 Alamance Rd Fayetteville, NC | 1.0–2.0 | 1.0–2.0 | 827 | $1,200 | $1.45 | 25d | 1 | 1.45mi |
| 1008 Ancestry Dr Fayetteville, NC | 2.0 | 2.5 | 1200 | $1,045 | $0.87 | 25d | 1 | 1.46mi |
| 2219 Gray Goose Loop Fayetteville, NC | 3.0 | 2.5 | 1799 | $1,900 | $1.06 | 23d | 1 | 1.46mi |
| 821 Sandalwood Dr Fayetteville, NC | 3.0 | 1.0 | 1204 | $1,200 | $1.00 | 16d | 1 | 1.48mi |
| 1031 Ancestry Dr Fayetteville, NC | 2.0 | 2.0 | 950 | $935 | $0.98 | 25d | 1 | 1.50mi |
Listing history 2 events
-
2026-06-21remarks 416-char remark
-
2026-06-21$175,000 Active 1 DOM
ⓘ Source: listings_history table (triggers on properties + properties_extension) + one-shot
backfill from property_details.listing_events for pre-trigger history.
Tax reassessment forecast NC · Resets to sale price
- Current annual tax
- $2,059 · $172/mo
- Projected year-2 tax
- $2,059 · $172/mo
- Expected delta
- $0/yr ($0/mo · 0.0%)
ⓘ Screening estimate from a state-policy table — verify with the county assessor before closing.
Climate risk First Street
- Flood 1/10 Low FEMA zone X (unshaded) · 0% chance over 30 yrs
- Wildfire 4/10 Moderate
- Heat 7/10 Severe 7 d/yr ≥106°F today · 16 d/yr by 30 yrs out
- Wind 8/10 Severe 80% chance of damaging wind over 30 yrs
- Air quality 1/10 Low 0 unhealthy d/yr today · 0 by 30 yrs out
Nearby sold comps map
Loading sold comps map…
Walkable amenities ~0.75 mi
Loading nearby amenities…
Taxation est. · year 1
- Rental income
- $18,664
- − Mortgage interest
- −$9,803
- − Property taxes
- −$2,059
- − Insurance
- −$875
- − Repairs & maintenance
- −$1,493
- − Management
- −$1,493
- − Depreciation
- −$5,091
- Taxable loss
- −$2,150
- Est. tax savings @ 24.0%
- +$516
- After-tax cash flow
- $1,314/yr
For passive investors: Depreciation is non-cash, so a rental often shows a tax loss while cash-flowing — sheltering income. Rental losses are passive: they offset passive income freely, and up to $25,000/yr can offset ordinary (W-2) income if you actively participate and your MAGI is under $100k (phasing out to $0 by $150k); unused losses carry forward. On sale, claimed depreciation is recaptured at up to 25%, and gains may owe capital-gains tax (a 1031 exchange can defer both). Figures are a year-1 estimate at your 24.0% rate — not tax advice; consult a CPA.
Schools (NCES district)
- District
- Cumberland County Schools
- NCES district ID
- 3700011
- Math proficiency
- 32% ▼ -2.00%
- Reading proficiency
- 41% ▼ -1.00%
- Median HH income
- $44,168
- Composite
- 31.0/100
- National rank
- #6096
- State rank
- #126 of 178 in NC
Livability — Fayetteville
- Score
- 75/100
- State rank
- #45
- US rank
- #4031
Category grades
Schools grade is shown separately in the Schools card above.
Census & demographics
- Census place
- Fayetteville, NC
- County
- Cumberland County · 265,314 people
- City population
- 226,118
- Metro
- Fayetteville, NC
- Population (ZIP)
- 37,140
- Household income
- $58,563
- Rent vs Own
- Severe rent burden
- 1667.0
Population outlook (Cumberland County) Hauer SSP2
- Today (2025)
- 330,855 people
- By 2030
- 333,523 · +0.8%
- By 2040
- 335,583 · +1.4%
- By 2050
- 335,325 · +1.4%
- By 2075
- 342,853 · +3.6%
- By 2100
- 340,698 · +3.0%
Race, ethnicity, and origin ACS 2023
- Neighborhood character
- Highly diverse neighborhood (Simpson 0.70)
- Race & ethnicity
- Black 39% White 36% Hispanic / Latino 14% Two or more races 12% Asian 3% Native American 1%
- Hispanic origin (detail)
- Mexican 5% Puerto Rican 5%
- Common ancestry
- Slovak 2% Italian 1% Serbian 1%
- Foreign-born
- 8% · Canada, South Korea, Vietnam
- Languages at home
- 87% English-only · Spanish 9% Tagalog/Filipino 1% French/Haitian/Cajun 1%
Political lean MEDSL · Cumberland
- 2024 margin
- D (+13.4) · D 56.1% · R 42.7% · Other 1.2%
- 2008→2024 swing
- -4.3pp toward R · 2008: 17.7pp · 2024: 13.4pp
- All cycles
- 2024: D+13.4 2020: D+16.6 2016: D+16.0 2012: D+19.7 2008: D+17.7
Not yet ingested
- Civics
- —
Market trends
- HPI YoY
- ▼ -59.90%
- Current HPI
- 215.927
- Rent YoY
- ▲ 3.17%
- Metro
- Fayetteville, NC
- State GDP YoY
- ▲ 3.28%
- F500 in state
- 26
Industry mix (Fortune 500 HQ in NC)
| Industry | F500 HQs | Revenue |
|---|---|---|
| Financial Services | 2 | $213B |
|
||
| Retail | 2 | $95B |
|
||
| Industrial Conglomerate | 1 | $38B |
|
||
| Metals / Steel | 1 | $35B |
|
||
| Utilities | 1 | $30B |
|
||
| Industrial Machinery | 1 | $19B |
|
||
Price history
1 event — show timeline
- 2026-06-20 Listed $175,000 LPRMLS
Property tax history
+6.1%/yrLatest (2025): $2,059 · +54.0% YoY. Source: county tax records.
Cash-flow waterfall
monthlySold comps — $/sqft
last 12 mo · ≤1 miLoading sold comps…