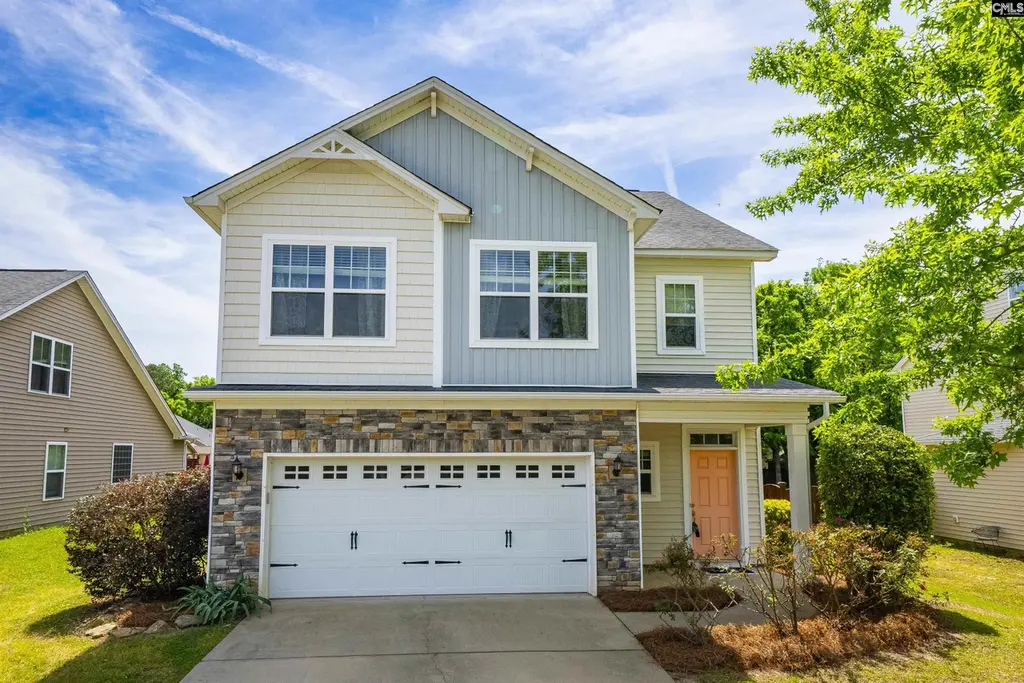
162 Wingspan Way · Lake Murray of Richland, SC
Flood risk 1/10 · Minimal
- FEMA flood zone
- X (unshaded)
- Chance of flooding over 30 yrs
- 0.0%
- Est. flood insurance / yr
- $507 – $1,088
Fire risk 4/10 · Minor
- Est. fire insurance / yr
- $783 – $1,453
Heat risk 7/10 · Major
- Hot days now (above 108°F)
- 7 days/yr
- Hot days in 30 yrs
- 17 days/yr
Wind risk 6/10 · Moderate
- Chance of severe wind over 30 yrs
- 56.0%
Air-quality risk 3/10 · Minor
- Unhealthy air days now
- 2 days/yr
- Unhealthy air days in 30 yrs
- 3 days/yr
Risk factors via First Street. Map © Google.
Why this score? — see what drove the D grade
The composite is a weighted blend of 9 inputs, each scored 0–100. Each bar is that input's sub-score; the figure is the points it added to the 100-point composite (weight × sub-score).
- Cash flow +13.5/30.0
- ARV discount +7.5/15.0
- Schools +4.5/10.0
- DSCR +4.1/10.0
- Livability +3.4/5.0
- 1% rule +2.9/10.0
- Rent growth +2.5/5.0
- Condition / age +2.5/5.0
- Appreciation +0.0/10.0
$315,000
🖨 Deal sheet (PDF) 📄 Offer letter ✓ Due diligence
Listing remarks
Back on the market at NO fault of Sellers! Welcome home to this beautiful 2.5-story, 4-bedroom, 2.5-bath home offering 2,300 square feet of thoughtfully designed open-concept living space that perfectly blends comfort, functionality, and style. Situated on a spacious, fully fenced 0.23-acre lot, this home provides both privacy and plenty of room to relax or entertain outdoors. Step inside to find newly installed durable and stylish LVP flooring flowing throughout the main living areas, where the open-concept layout connects the living room, dining area, and kitchen, ideal for both everyday living and hosting guests. The updated kitchen features stainless steel appliances, granite counterto
Key facts
- Modern kitchen
- Granite countertops
- Fully fenced lot
Tags
Property features AI
Finance
- Other: Community pool
- HOA & community: Homeowners association (includes common area maintenance and pool access)
Exterior
- Parking: Attached garage with 2 garage spaces (4 total parking spaces); Garage entry at main level
- Utilities: Public water; Public sewer
- Home design: Two-and-a-half story single-family home; Exterior finished in stone and vinyl
- Construction: Slab foundation
- Exterior features: Covered front porch; Patio; Full gutters; Privacy wood fence in rear
Interior
- Kitchen: Granite countertops; Wood stained cabinets; Kitchen bar; Pantry; Dishwasher; Disposal; Microwave above stove
- Bedrooms: Primary suite with double vanity, garden tub, separate shower, private bath and walk-in closet (located on second level); Bedroom 2 with shared bath and tub/shower (second level); Bedroom 3 with shared bath and tub/shower (second level); Bedroom 4 with carpeted floors (third level)
- Flooring: Carpet in bedrooms
- Bathrooms: Two full bathrooms; One half bathroom; Two additional full secondary baths
- Heating & cooling: Central heating (electric); Central cooling with heat pump serving the first level
- Interior features: Attic storage with pull-down access; Ceiling fans; Garage door opener; Smoke detectors; One fireplace; Free‑standing smooth-surface range
- Laundry & utility: Electric laundry in utility room (washer/dryer room located on second level); Tankless hot water system
Neighborhood map
What this means for you Summary
Snapshot
- This is a 3-bed/2.5-bath single-family listed at $315k.
Deal economics
- At list price, monthly cash flow is $11 ($132/yr) — positive.
- The deal already cash-flows at list — no discount required.
- To meet the 1% rule (rent ≥ 1% of price), the offer needs to be $247k (21.4% below list).
- Recommended offer: $247k (21.4% below list) — sets the bar for 1% rule.
Location & tenants
- Location reads 67/100 on livability (#102 in SC) — a middle-class / working-renter tenant base. Strengths: crime A+, employment A+, housing A+; Watch: amenities F, commute F, cost of living F.
- Lexington 05 (suburban): math 47% / reading 55% proficiency, ranked #5 of 80 in SC (top 6%) — acceptable for families but not a draw, mixed tenant base, ~2y average lease.
- Zoned schools: Chapin Elementary (math 53% / reading 51%, grade C-, #145 of 597 statewide, top 26%, 790 students, 34% FRL); Chapin Middle (math 50% / reading 57%, grade C+, #29 of 229 statewide, top 13%, 991 students, 27% FRL); Chapin High (math 82% / reading 91%, grade A, #7 of 196 statewide, top 4%, 1,615 students, 100% FRL) — zoned schools average 54% FRL vs 27% district-wide (26 pts higher); higher-poverty schools than district average — tighter screening recommended.
- Zoned-school proficiency averages 64% at this address vs 51% district-wide (+13 pts) — the actual schools serving this property are materially stronger than the Lexington 05 average implies; a family-tenant draw the district grade alone would hide.
- Market conditions: 443 active listings in the ZIP; 1 comparable units currently listed for rent nearby; high-income renter base; 1,712 units permitted in Lexington County in 2024 (0 in 5+ unit buildings).
Forward outlook
- Local home prices are declining (-3.0%/yr); year-one equity from $2k of loan paydown is wiped out by about $9k of value loss. Plan a longer hold.
- Lexington County population projected at +26% by 2050 — long-run rental-demand tailwind backs the buy-and-hold thesis.
Negotiation context
- It's been on market 65 days — a 6% lower offer ($296k) is reasonable based on typical stale-listing flexibility.
- 5 sale attempts since 5y ago with the ask held roughly flat each time — persistent listings suggest the price (not the market) is what's stuck; bring a comps-based counter.
- Current owner paid $255k; 24% above their basis — modest negotiation headroom, anchor on the comps not their cost.
Risks & watch-outs
- Climate carrying-cost: major wind risk, 56% chance of damaging wind over 30y; extreme-heat days projected 7→17/yr by 2055 (HVAC capex compounding) — expect insurance premiums to compound above CPI over the hold.
Questions for the listing agent
- It's been on market 65 days. Have you received any prior offers? Is the seller open to a 21% concession, seller financing, or rate buy-down credit?
- What does the HOA fee cover, when was the last increase, and are there any pending special assessments or reserve-fund shortfalls?
- Why hasn't it sold? Are there any deal-killer items the seller is aware of (foundation, flood, title, zoning, code violations)?
- Is there a deadline driving the sale (1031 exchange, divorce, estate, relocation)? That informs how much negotiation room exists.
- Schools are D-rated, which usually means shorter tenancies and higher turnover. Who's the typical renter profile here, and what's been the actual vacancy rate?
- The area grade is low — what's the realistic commute time and amenity access for the typical tenant pool here? Any planned neighborhood developments (good or bad) we should know about?
- What's the average days-on-market for RENTAL listings here right now (not sales)? A rising rental-DOM trend means longer vacancies and softer asking-rent achievability than the comps imply.
- What's the recent tenant-quality profile in this submarket — average credit score on applications, eviction rate, late-payment / NSF rate, and stable-employment percentage? A property-management company in the area should have these aggregated.
- How much new for-sale + rental construction is in the pipeline within 1–3 miles? Heavy new supply typically softens prices + rents 12–24 months out; constrained supply supports both.
Investment metrics
- 1% rule
- 0.79% ✗
- Cap rate
- 6.33%
- Cash-on-cash
- 0.15%
- DSCR
- 1.01
- GRM
- 10.6
CMA / ARV
No comps found within radius.
Projected returns pro-forma
-3.0% appreciation · 3.0% rent growth · sell at horizon
- IRR
- -16.1%
- Equity multiple
- 0.43×
- Total profit
- $-50,451
- Equity at exit
- $46,968
- IRR
- -7.8%
- Equity multiple
- 0.51×
- Total profit
- $-43,463
- Equity at exit
- $27,235
Cash invested: $88,200 (down + closing). Projections, not guarantees.
Landlord ↔ Tenant lean methodology
- Overall (STATE)
- 90 Strongly Landlord-Friendly
- State South Carolina
- 90 Strongly Landlord-Friendly · R+6
- County
- — inherits STATE
- City
- — inherits STATE
ZIP-level market 29036
- Active inventory
- 443
- Price-to-rent
- 10.6×
Monthly cashflow live
- Estimated rent
- $2,475 medium interval (Pro) →
- Mortgage (P&I)
- −$1,652
- Tax from tax record
- −$130 /mo · $1,561/yr
- Insurance
- −$131
- HOA
- −$31
- Vacancy / Maint / Mgmt
- −$520
- Net cashflow
- $11
Break-even live
Sensitivity live
| Price | -10% $189 | -5% $100 | +0% $11 | +5% $-78 | +10% $-167 |
|---|---|---|---|---|---|
| Rent | -10% $-185 | -5% $-87 | +0% $11 | +5% $109 | +10% $206 |
| Rate | -1.0pp $170 | -0.5pp $91 | base $11 | +0.5pp $-71 | +1.0pp $-154 |
UW: 25.0% down · 7.5% · 30yr · 1.5% tax · 5.0% vac · 8.0% maint · 8.0% mgmt
Financing live
Cash to close
- Down payment
- $78,750
- Closing costs
- $9,450
- Reserves months
- —
- Total cash needed
- —
Loan-product check · same deal, 3 products live
Conventional
25% down · 7.5% · 30yr
- Down + closing
- —
- Monthly P&I
- —
- Monthly cashflow
- —
- DSCR
- —
- Eligible?
- —
Personal DTI + credit; lowest rate.
DSCR
20% down · 8.5% · 30yr
- Down + closing
- —
- Monthly P&I
- —
- Monthly cashflow
- —
- DSCR
- —
- Eligible?
- —
No personal income docs; deal must DSCR.
Hard money
10% down · 12.0% · 12mo
- Down + closing
- —
- Monthly P&I
- —
- Monthly cashflow
- —
- DSCR
- —
- Eligible?
- —
Short-term bridge; refi at stabilization.
Rent comps 1 comps
| Address | Beds | Baths | Sqft | Rent | $/sqft | DOM | Units | Dist |
|---|---|---|---|---|---|---|---|---|
| 280 Walkbridge Way Chapin, SC | 4.0 | 3.0 | 2041 | $2,500 | $1.22 | 4d | 1 | 0.85mi |
HOA detail
- Monthly dues
- $31 · $372/yr
Listing history 30 events
-
2026-06-18statusdays on market $315,000 Pending 65 DOM
-
2026-06-17days on market $315,000 Active - Contingent 64 DOM
-
2026-06-16days on market $315,000 Active - Contingent 63 DOM
-
2026-06-15days on market $315,000 Active - Contingent 62 DOM
-
2026-06-14days on market $315,000 Active - Contingent 60 DOM
-
2026-06-13days on market $315,000 Active - Contingent 59 DOM
-
2026-06-10days on market $315,000 Active - Contingent 57 DOM
-
2026-06-09days on market $315,000 Active - Contingent 56 DOM
-
2026-06-08days on market $315,000 Active - Contingent 55 DOM
-
2026-06-07statusdays on market $315,000 Active - Contingent 54 DOM
-
2026-06-03days on market $315,000 Active 50 DOM
-
2026-06-03days on market $315,000 Active 49 DOM
-
2026-06-01days on market $315,000 Active 48 DOM
-
2026-05-31days on market $315,000 Active 47 DOM
-
2026-05-20price $315,000
-
2026-05-19status Active
-
2026-05-07historical Active - Contingent
-
2026-04-30price $318,000
-
2026-04-23price $319,000
-
2026-04-14$320,000 Active
-
2025-03-22historical $2,195
-
2025-03-12$2,195
-
2025-01-23historical $2,395
-
2025-01-11price $2,395
-
2024-11-09$2,450
-
2021-09-08soldstatus $255,000
-
2021-08-04historical
-
2021-08-02$250,000 Active
-
2016-08-15soldstatus $179,000
-
2016-05-31price $183,000
ⓘ Source: listings_history table (triggers on properties + properties_extension) + one-shot
backfill from property_details.listing_events for pre-trigger history.
Tax reassessment forecast SC · Resets to sale price
- Current annual tax
- $1,561 · $130/mo
- Projected year-2 tax
- $1,796 · $150/mo
- Expected delta
- +$235/yr (+$20/mo · 15.1%)
ⓘ Screening estimate from a state-policy table — verify with the county assessor before closing.
Climate risk First Street
- Flood 1/10 Low FEMA zone X (unshaded) · 0% chance over 30 yrs
- Wildfire 4/10 Moderate
- Heat 7/10 Severe 7 d/yr ≥108°F today · 17 d/yr by 30 yrs out
- Wind 6/10 Major 56% chance of damaging wind over 30 yrs
- Air quality 3/10 Moderate 2 unhealthy d/yr today · 3 by 30 yrs out
Nearby sold comps map
Loading sold comps map…
Walkable amenities ~0.75 mi
Loading nearby amenities…
Taxation est. · year 1
- Rental income
- $29,698
- − Mortgage interest
- −$17,645
- − Property taxes
- −$1,561
- − Insurance
- −$1,575
- − Repairs & maintenance
- −$2,376
- − Management
- −$2,376
- − HOA
- −$372
- − Depreciation
- −$9,164
- Taxable loss
- −$5,369
- Est. tax savings @ 24.0%
- +$1,289
- After-tax cash flow
- $1,420/yr
For passive investors: Depreciation is non-cash, so a rental often shows a tax loss while cash-flowing — sheltering income. Rental losses are passive: they offset passive income freely, and up to $25,000/yr can offset ordinary (W-2) income if you actively participate and your MAGI is under $100k (phasing out to $0 by $150k); unused losses carry forward. On sale, claimed depreciation is recaptured at up to 25%, and gains may owe capital-gains tax (a 1031 exchange can defer both). Figures are a year-1 estimate at your 24.0% rate — not tax advice; consult a CPA.
Schools (NCES district)
- District
- Lexington 05
- NCES district ID
- 4502820
- Math proficiency
- 47% ▼ -7.00%
- Reading proficiency
- 55% ▼ -4.00%
- Median HH income
- $67,732
- Composite
- 45.28/100
- National rank
- #2656
- State rank
- #5 of 80 in SC
Livability — Lake Murray of Richland
- Score
- 67/100
- State rank
- #102
- US rank
- #10903
Category grades
Schools grade is shown separately in the Schools card above.
Census & demographics
- County
- Lexington County · 232,571 people
- City population
- 179
- Metro
- Columbia, SC
- Population (ZIP)
- 26,620
- Household income
- $113,986
- Rent vs Own
- Severe rent burden
- 212.0
Population outlook (Lexington County) Hauer SSP2
- Today (2025)
- 322,999 people
- By 2030
- 342,356 · +6.0%
- By 2040
- 377,715 · +16.9%
- By 2050
- 406,984 · +26.0%
- By 2075
- 465,447 · +44.1%
- By 2100
- 485,674 · +50.4%
Race, ethnicity, and origin ACS 2023
- Neighborhood character
- Predominantly White (86%)
- Race & ethnicity
- White 86% Asian 5% Two or more races 4% Black 3% Hispanic / Latino 3%
- Common ancestry
- Lithuanian 4% Slovak 4% Italian 2%
- Foreign-born
- 6% · Canada, South Korea, China
- Languages at home
- 95% English-only · Other Indo-European 2% Spanish 1% Korean 1%
Political lean MEDSL · Lexington
- 2024 margin
- Solid R (+33.5) · D 32.5% · R 66.0% · Other 1.4%
- 2008→2024 swing
- +4.6pp toward D · 2008: -38.0pp · 2024: -33.5pp
- All cycles
- 2024: R+33.5 2020: R+30.1 2016: R+36.7 2012: R+37.8 2008: R+38.0
Not yet ingested
- Civics
- —
Market trends
- HPI YoY
- ▼ -134.76%
- Current HPI
- 248.3807
- Rent YoY
- —
- Metro
- Columbia, SC
- State GDP YoY
- ▲ 4.51%
- F500 in state
- 2
Industry mix (Fortune 500 HQ in SC)
| Industry | F500 HQs | Revenue |
|---|---|---|
| Packaging | 1 | $7B |
|
||
Price history
+72.1% since first listed16 events — show timeline
- 2026-05-20 Price Changed $315,000 Consolidated MLS
- 2026-05-19 Relisted — Consolidated MLS
- 2026-05-07 Contingent — Consolidated MLS
- 2026-04-30 Price Changed $318,000 Consolidated MLS
- 2026-04-23 Price Changed $319,000 Consolidated MLS
- 2026-04-14 Listed $320,000 Consolidated MLS
- 2025-03-22 Rental Removed $2,195 RENT.
- 2025-03-12 Listed for Rent $2,195 RENT.
- 2025-01-23 Rental Removed $2,395 RENT.
- 2025-01-11 Price Changed $2,395 RENT.
- 2024-11-09 Listed for Rent $2,450 RENT.
- 2021-09-08 Sold (Public Records) $255,000 Public Records
- 2021-08-04 Delisted — Consolidated MLS
- 2021-08-02 Listed $250,000 Consolidated MLS
- 2016-08-15 Sold (Public Records) $179,000 Public Records
- 2016-05-31 Price Changed $183,000 Consolidated MLS
Property tax history
-5.2%/yrLatest (2024): $1,561 · +0.9% YoY. Source: county tax records.
Cash-flow waterfall
monthlySold comps — $/sqft
last 12 mo · ≤1 miLoading sold comps…