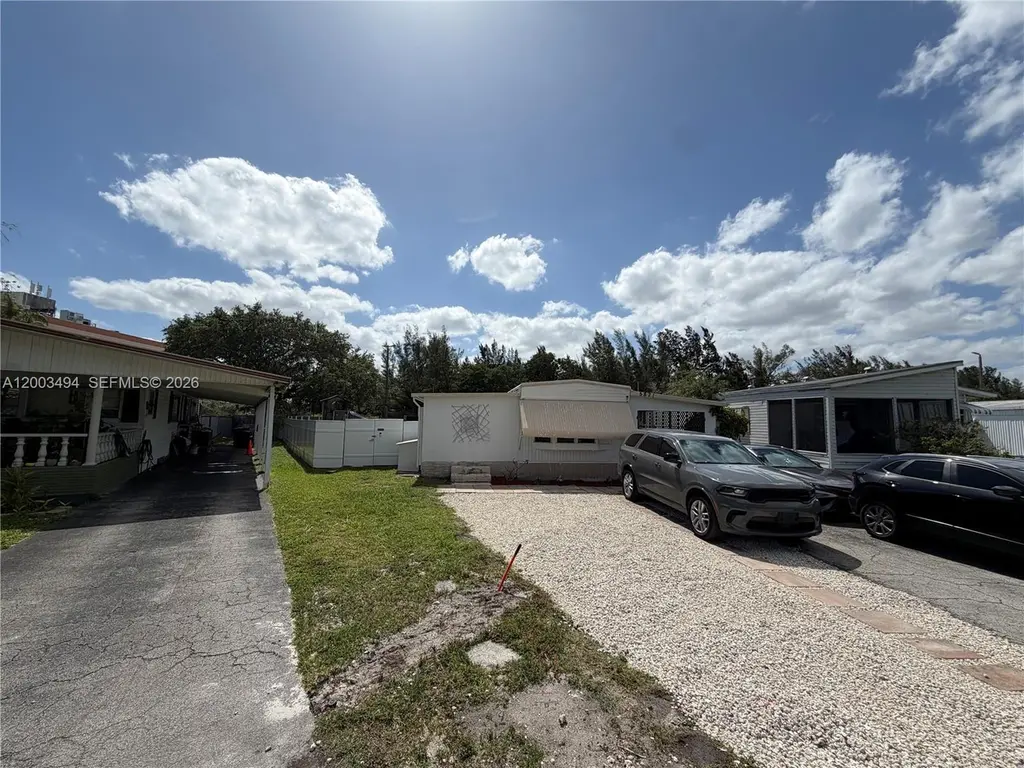
5871 SW 29th Ave · Dania Beach, FL
Flood risk 1/10 · Minimal
- FEMA flood zone
- X (shaded)
- Chance of flooding over 30 yrs
- 0.0%
- Est. flood insurance / yr
- $507 – $1,088
Fire risk 1/10 · Minimal
- Est. fire insurance / yr
- $947 – $1,759
Heat risk 10/10 · Severe
- Hot days now (above 105°F)
- 7 days/yr
- Hot days in 30 yrs
- 26 days/yr
Wind risk 10/10 · Severe
- Chance of severe wind over 30 yrs
- 99.0%
Air-quality risk 2/10 · Minimal
- Unhealthy air days now
- 2 days/yr
- Unhealthy air days in 30 yrs
- 2 days/yr
Risk factors via First Street. Map © Google.
Why this score? — see what drove the C- grade
The composite is a weighted blend of 9 inputs, each scored 0–100. Each bar is that input's sub-score; the figure is the points it added to the 100-point composite (weight × sub-score).
- Cash flow +24.1/30.0
- DSCR +7.8/10.0
- 1% rule +7.0/10.0
- Schools +4.1/10.0
- Livability +3.9/5.0
- Rent growth +2.8/5.0
- ARV discount +2.6/15.0
- Condition / age +2.5/5.0
- Appreciation +0.0/10.0
$180,000
🖨 Deal sheet 📄 Offer letter ✓ Due diligence
Listing remarks
Spacious 2-bedroom, 2-bath mobile home located on a 5,256 sq ft oversized lot in Ravenswood Estates & Marina, an all-ages community where you own the land. Enjoy access to resort-style amenities including a pool, tennis courts, fitness center, & more. Built in 1987, this home offers a great opportunity for buyers to update and make it their own or purchase for the lot and add a new home. Features include an aluminum roof, Florida room, and a dedicated utility/laundry area, providing a functional starting point for renovation or future plans. The spacious lot offers plenty of room to enhance and create your ideal outdoor space. No rentals permitted during the first 3 years of owne
Key facts
- Aluminum roof
- Florida room
- Ideal outdoor space
Tags
Property features AI
Finance
- Financial info: Pets allowed with restrictions or possible restrictions
- HOA & community: Monthly association fee of $115 covering common area maintenance; Community clubhouse, fitness center, maintained common areas, pool, tennis courts, street lights
Exterior
- Parking: Driveway
- Utilities: Public water; Public sewer; Cable available
- Home design: Manufactured home; Single-story; North-facing
- Construction: Aluminum roof
- Exterior features: Exterior lighting; Community pool
Interior
- Kitchen: Refrigerator
- Bedrooms: Primary bedroom on main level
- Flooring: Laminate flooring
- Bathrooms: 2 full bathrooms
- Heating & cooling: Electric heating; Electric cooling
- Interior features: Closet cabinetry; First-floor entry; Open living/dining area; Main-level primary bedroom
Neighborhood map
What this means for you Summary
Snapshot
- This is a 2-bed/2.0-bath manufactured listed at $180k.
Deal economics
- At list price, monthly cash flow is $355 ($4k/yr) — positive.
- The deal already cash-flows at list — no discount required.
- Meets the 1% rule at list price ($2k rent vs $180k).
- Recommended offer: $175k (3.0% below list) — sets the bar for market timing.
- Cap rate 8.7% vs local median 3.9% in Dania Beach — top-decile yield for the area; either an underpriced asset or a hidden risk that comps aren't pricing in. Stress-test before assuming the spread holds.
Location & tenants
- Location reads 77/100 on livability (#180 in FL, #2,806 nationally) — a middle-class / working-renter tenant base. Strengths: commute A+, cost of living A, housing A; Watch: schools D, employment D, amenities F.
- Broward (suburban): math 42% / reading 53% proficiency, ranked #46 of 73 in FL (top 63%) — families likely to look elsewhere, expect single-tenant / working-renter base with shorter leases.
- Market conditions: Rents rising (+1.3%/yr); 412 active listings in the ZIP; 22 comparable units currently listed for rent nearby; rentals at typical pace (median 19d on market — plan ~3-4 weeks tenant-placement turnaround); solid renter incomes; 2,111 units permitted in Broward County in 2024 (1,265 in 5+ unit buildings).
- This rent runs 34% of the median local income ($76k/yr) — at the standard rent-burdened threshold; future hikes will face affordability resistance.
Forward outlook
- Local home prices are declining (-3.0%/yr); year-one equity from $1k of loan paydown is wiped out by about $5k of value loss. Plan a longer hold.
- Broward County population projected at +34% by 2050 — long-run rental-demand tailwind backs the buy-and-hold thesis.
Negotiation context
- It's been on market 38 days — a 3% lower offer ($175k) is reasonable based on typical stale-listing flexibility.
- 2 sale attempts; this cycle's ask has dropped $20k (10%) from the opening price — seller is motivated, your offer sets the floor, not the list.
- Current owner paid $64k; list at $180k implies a 181% gain — meaningful room to come down on a strong offer.
Risks & watch-outs
- Climate carrying-cost: severe wind risk, 99% chance of damaging wind over 30y; extreme-heat days projected 7→26/yr by 2055 (HVAC capex compounding) — expect insurance premiums to compound above CPI over the hold.
Questions for the listing agent
- It's been on market 38 days. Have you received any prior offers? Is the seller open to a 3% concession, seller financing, or rate buy-down credit?
- What does the HOA fee cover, when was the last increase, and are there any pending special assessments or reserve-fund shortfalls?
- Is there a deadline driving the sale (1031 exchange, divorce, estate, relocation)? That informs how much negotiation room exists.
- Schools are D-rated, which usually means shorter tenancies and higher turnover. Who's the typical renter profile here, and what's been the actual vacancy rate?
- What's the average days-on-market for RENTAL listings here right now (not sales)? A rising rental-DOM trend means longer vacancies and softer asking-rent achievability than the comps imply.
- What's the recent tenant-quality profile in this submarket — average credit score on applications, eviction rate, late-payment / NSF rate, and stable-employment percentage? A property-management company in the area should have these aggregated.
- How much new for-sale + rental construction is in the pipeline within 1–3 miles? Heavy new supply typically softens prices + rents 12–24 months out; constrained supply supports both.
Investment metrics
- 1% rule
- 1.20% ✓
- Cap rate
- 8.66%
- Cash-on-cash
- 8.45%
- DSCR
- 1.38
- GRM
- 7.0
CMA / ARV
- ARV (on-the-fly)
- $162,316
- Comps found
- 1
Show comp detail 1 sale within ~0.75 mi
| Address | Dist | Beds/Ba | Sqft | Sold | Price | $/sf | Match |
|---|---|---|---|---|---|---|---|
| 2851 W Marina Dr | 0.19mi | 2/1.0 | 760 (+2%) | 3mo | $165,000 | $217 | 82 |
Match score weights: distance 35% · size 25% · config 20% · recency 20%. Top-matched comps best support the ARV.
Projected returns pro-forma
-3.0% appreciation · 1.3% rent growth · sell at horizon
- IRR
- -5.5%
- Equity multiple
- 0.80×
- Total profit
- $-10,078
- Equity at exit
- $26,839
- IRR
- 1.9%
- Equity multiple
- 1.13×
- Total profit
- $6,376
- Equity at exit
- $15,563
Cash invested: $50,400 (down + closing). Projections, not guarantees.
Landlord ↔ Tenant lean methodology
- Overall (STATE)
- 87 Strongly Landlord-Friendly
- State Florida
- 87 Strongly Landlord-Friendly · R+3
- County
- — inherits STATE
- City
- — inherits STATE
ZIP-level market 33312
- Rents YoY
- 1.3%
- Active inventory
- 412
- Price-to-rent
- 7.0×
Monthly cashflow live
- Estimated rent
- $2,151 high interval (Pro) →
- Mortgage (P&I)
- −$944
- Tax from tax record
- −$211 /mo · $2,528/yr
- Insurance
- −$75
- HOA
- −$115
- Vacancy / Maint / Mgmt
- −$452
- Net cashflow
- $355
Break-even live
UW: 25.0% down · 7.5% · 30yr · 1.5% tax · 5.0% vac · 8.0% maint · 8.0% mgmt
Financing live
Cash to close
- Down payment
- $45,000
- Closing costs
- $5,400
- Reserves months
- —
- Total cash needed
- —
Loan-product check · same deal, 3 products live
Conventional
25% down · 7.5% · 30yr
- Down + closing
- —
- Monthly P&I
- —
- Monthly cashflow
- —
- DSCR
- —
- Eligible?
- —
Personal DTI + credit; lowest rate.
DSCR
20% down · 8.5% · 30yr
- Down + closing
- —
- Monthly P&I
- —
- Monthly cashflow
- —
- DSCR
- —
- Eligible?
- —
No personal income docs; deal must DSCR.
Hard money
10% down · 12.0% · 12mo
- Down + closing
- —
- Monthly P&I
- —
- Monthly cashflow
- —
- DSCR
- —
- Eligible?
- —
Short-term bridge; refi at stabilization.
Rent comps 22 comps
| Address | Beds | Baths | Sqft | Rent | $/sqft | DOM | Units | Dist |
|---|---|---|---|---|---|---|---|---|
| 4951 SW 28th Ter Unit 2 Fort Lauderdale, FL | 2.0 | 1.0 | 700 | $2,600 | $3.71 | 24d | 1 | 0.77mi |
| 4940 SW 28th Ter Fort Lauderdale, FL | 2.0 | 1.0 | 640 | $2,000 | $3.12 | 24d | 1 | 0.79mi |
| 4910 SW 28th Ter #3 Fort Lauderdale, FL | 1.0 | 1.0 | 650 | $1,699 | $2.61 | 24d | 1 | 0.82mi |
| 3265 Griffin Rd #206 Fort Lauderdale, FL | 1.0 | 1.0 | 713 | $1,700 | $2.38 | 17d | 1 | 1.02mi |
| Fort Lauderdale Fort Lauderdale, FL | 1.0 | 1.0 | 400 | $1,500 | $3.75 | 24d | 1 | 1.20mi |
| 3211 SW 44th St #117 Fort Lauderdale, FL | 1.0 | 1.0 | 400 | $1,480 | $3.70 | 10d | 1 | 1.29mi |
| 3071 SW 45th St Fort Lauderdale, FL | 1.0 | 1.0 | 700 | $2,000 | $2.86 | 17d | 1 | 1.29mi |
| 3251 SW 44th St Fort Lauderdale, FL | 1.0 | 1.0 | 372 | $1,425 | $3.83 | 14d | 2 | 1.29mi |
| 2200 Park Ln #109 Hollywood, FL | 1.0 | 1.5 | 727 | $1,650 | $2.27 | 3d | 1 | 1.30mi |
| 2223 Park Ln #306 Hollywood, FL | 1.0 | 1.0 | 703 | $1,825 | $2.60 | 24d | 1 | 1.32mi |
| 4000 N 56th Ave Hollywood, FL | 2.0 | 1.0–2.0 | 776 | $2,195 | $2.83 | 2d | 7 | 1.37mi |
| 3610 N 56th Ave Hollywood, FL | 1.0–2.0 | 1.0 | 771 | $2,100 | $2.72 | 7d | 2 | 1.37mi |
| 5050 SW 40th Ave Unit 4 Fort Lauderdale, FL | 2.0 | 1.0 | 750 | $1,800 | $2.40 | 18d | 1 | 1.38mi |
| 3640 N 56th Ave #401 Hollywood, FL | 2.0 | 1.0 | 749 | $1,900 | $2.54 | 20d | 1 | 1.39mi |
| 3640 N 56th Ave #401 Hollywood, FL | 2.0 | 1.0 | 749 | $1,900 | $2.54 | 2d | 1 | 1.39mi |
| 3650 N 56th Ave #520 Hollywood, FL | 1.0 | 1.0 | 659 | $1,700 | $2.58 | 18d | 1 | 1.42mi |
| 121 N Compass Way Dania, FL | 1.0–2.0 | 1.0–2.0 | 871 | $3,010 | $3.45 | 24d | 3 | 1.44mi |
| 3660 N 56th Ave #609 Hollywood, FL | 1.0 | 1.0 | 659 | $1,725 | $2.62 | 17d | 1 | 1.46mi |
| 3700 N 56th Ave Hollywood, FL | 1.0–2.0 | 1.0 | 704 | $2,100 | $2.98 | 24d | 3 | 1.47mi |
| 3700 N 56th Ave #1015 Hollywood, FL | 1.0 | 1.0 | 659 | $1,900 | $2.88 | 7d | 1 | 1.47mi |
| 3690 N 56th Ave Hollywood, FL | 1.0–2.0 | 1.0 | 771 | $2,200 | $2.85 | 3d | 2 | 1.48mi |
| 120 N Compass Way Dania, FL | 1.0–3.0 | 1.0–2.0 | 982 | $2,819 | $2.87 | 24d | 1 | 1.48mi |
HOA detail
- Monthly dues
- $115 · $1,380/yr
- Likely covers
- poolgym
Listing history 7 events
-
2026-05-18price $180,000
-
2026-05-15status Active
-
2026-05-11historical Active Under Contract
-
2026-04-20$200,000 Active
-
2006-08-23soldstatus $64,000
-
1990-07-23soldstatus $45,000
-
1981-04-01soldstatus $13,500
ⓘ Source: listings_history table (triggers on properties + properties_extension) + one-shot
backfill from property_details.listing_events for pre-trigger history.
Tax reassessment forecast FL · Resets to sale price
- Current annual tax
- $2,528 · $211/mo
- Projected year-2 tax
- $2,528 · $211/mo
- Expected delta
- $0/yr ($0/mo · 0.0%)
ⓘ Screening estimate from a state-policy table — verify with the county assessor before closing.
Climate risk First Street
- Flood 1/10 Low FEMA zone X (shaded) · 0% chance over 30 yrs
- Wildfire 1/10 Low
- Heat 10/10 Extreme 7 d/yr ≥105°F today · 26 d/yr by 30 yrs out
- Wind 10/10 Extreme 99% chance of damaging wind over 30 yrs
- Air quality 2/10 Low 2 unhealthy d/yr today · 2 by 30 yrs out
Nearby sold comps map
Loading sold comps map…
Walkable amenities ~0.75 mi
Loading nearby amenities…
Taxation est. · year 1
- Rental income
- $25,818
- − Mortgage interest
- −$10,083
- − Property taxes
- −$2,528
- − Insurance
- −$900
- − Repairs & maintenance
- −$2,065
- − Management
- −$2,065
- − HOA
- −$1,380
- − Depreciation
- −$5,236
- Taxable income
- $1,560
- Est. tax owed @ 24.0%
- −$374
- After-tax cash flow
- $3,886/yr
For passive investors: Depreciation is non-cash, so a rental often shows a tax loss while cash-flowing — sheltering income. Rental losses are passive: they offset passive income freely, and up to $25,000/yr can offset ordinary (W-2) income if you actively participate and your MAGI is under $100k (phasing out to $0 by $150k); unused losses carry forward. On sale, claimed depreciation is recaptured at up to 25%, and gains may owe capital-gains tax (a 1031 exchange can defer both). Figures are a year-1 estimate at your 24.0% rate — not tax advice; consult a CPA.
Schools (NCES district)
- District
- Broward
- NCES district ID
- 1200180
- Math proficiency
- 42% ▼ -18.00%
- Reading proficiency
- 53% ▼ -5.00%
- Median HH income
- $52,139
- Composite
- 40.88/100
- National rank
- #3621
- State rank
- #46 of 73 in FL
Livability — Dania Beach
- Score
- 77/100
- State rank
- #180
- US rank
- #2806
Category grades
Schools grade is shown separately in the Schools card above.
Census & demographics
- Census place
- Dania Beach, FL
- County
- Broward County · 1,963,430 people
- City population
- 17,094
- Metro
- Miami-Fort Lauderdale-Pompano Beach, FL
- Population (ZIP)
- 52,798
- Household income
- $75,952
- Rent vs Own
- Severe rent burden
- 1903.0
Population outlook (Broward County) Hauer SSP2
- Today (2025)
- 2,207,033 people
- By 2030
- 2,360,704 · +7.0%
- By 2040
- 2,661,208 · +20.6%
- By 2050
- 2,946,698 · +33.5%
- By 2075
- 3,602,273 · +63.2%
- By 2100
- 3,970,984 · +79.9%
Race, ethnicity, and origin ACS 2023
- Neighborhood character
- Highly diverse neighborhood (Simpson 0.70)
- Race & ethnicity
- White 34% Hispanic / Latino 32% Black 29% Two or more races 20% Asian 2%
- Hispanic origin (detail)
- Mexican 2% Puerto Rican 5% Cuban 6% Salvadoran 1%
- Common ancestry
- Hispanic 6% Romanian 3% Italian 1%
- Foreign-born
- 33% · Canada, Jamaica, Dominican Republic
- Languages at home
- 59% English-only · Spanish 29% French/Haitian/Cajun 7% Other Indo-European 2%
Political lean MEDSL · Broward
- 2024 margin
- D (+17.0) · D 58.0% · R 41.0%
- 2008→2024 swing
- -17.8pp toward R · 2008: 34.7pp · 2024: 17.0pp
- All cycles
- 2024: D+17.0 2020: D+29.8 2016: D+35.0 2012: D+34.9 2008: D+34.7
Not yet ingested
- Civics
- —
Market trends
- HPI YoY
- ▼ -323.99%
- Current HPI
- 382.6298
- Rent YoY
- ▲ 1.30%
- Metro
- Miami-Fort Lauderdale-Pompano Beach, FL
- State GDP YoY
- ▲ 3.28%
- F500 in state
- 36
Industry mix (Fortune 500 HQ in FL)
| Industry | F500 HQs | Revenue |
|---|---|---|
| Industrial Technology | 2 | $29B |
|
||
| Insurance | 2 | $17B |
|
||
| Retail | 1 | $60B |
|
||
| Technology Distribution | 1 | $58B |
|
||
| Homebuilding | 1 | $35B |
|
||
| Technology Manufacturing | 1 | $35B |
|
||
Price history
+1233.3% since first listed7 events — show timeline
- 2026-05-18 Price Changed $180,000 MARMLS
- 2026-05-15 Relisted — MARMLS
- 2026-05-11 Contingent — MARMLS
- 2026-04-20 Listed $200,000 MARMLS
- 2006-08-23 Sold (Public Records) $64,000 Public Records
- 1990-07-23 Sold (Public Records) $45,000 Public Records
- 1981-04-01 Sold (Public Records) $13,500 Public Records
Property tax history
+10.3%/yrLatest (2025): $2,528 · +4.4% YoY. Source: county tax records.
Cash-flow waterfall
monthlySold comps — $/sqft
last 12 mo · ≤1 miLoading sold comps…