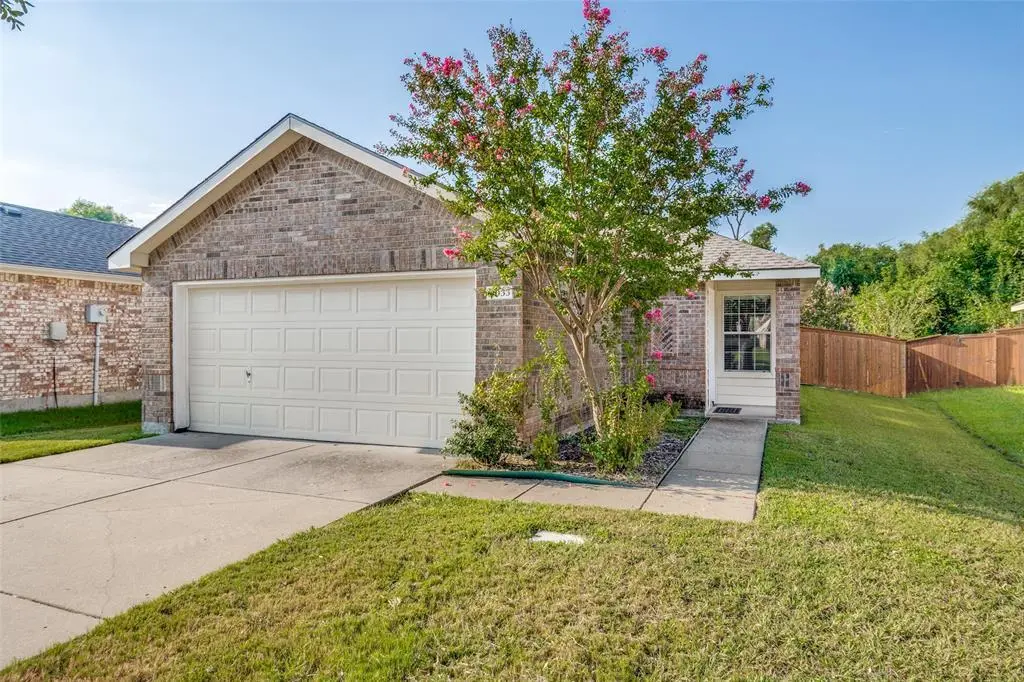
4033 Shawnee Trl · Heartland, TX
Flood risk 1/10 · Minimal
- FEMA flood zone
- X (unshaded)
- Chance of flooding over 30 yrs
- 0.0%
- Est. flood insurance / yr
- $507 – $1,088
Fire risk 5/10 · Moderate
- Est. fire insurance / yr
- $1,222 – $2,270
Heat risk 7/10 · Major
- Hot days now (above 110°F)
- 7 days/yr
- Hot days in 30 yrs
- 24 days/yr
Wind risk 6/10 · Moderate
- Chance of severe wind over 30 yrs
- 27.0%
Air-quality risk 2/10 · Minimal
- Unhealthy air days now
- 1 days/yr
- Unhealthy air days in 30 yrs
- 1 days/yr
Risk factors via First Street. Map © Google.
Why this score? — see what drove the D grade
The composite is a weighted blend of 9 inputs, each scored 0–100. Each bar is that input's sub-score; the figure is the points it added to the 100-point composite (weight × sub-score).
- ARV discount +14.6/15.0
- Cash flow +7.8/30.0
- 1% rule +4.5/10.0
- Schools +3.6/10.0
- Rent growth +2.9/5.0
- Livability +2.5/5.0
- Condition / age +2.5/5.0
- DSCR +1.9/10.0
- Appreciation +0.0/10.0
$195,000
🖨 Deal sheet (PDF) 📄 Offer letter ✓ Due diligence
Listing remarks
This charming two-bedroom, two-bathroom home in the growing Heartland community offers a spacious floor plan, inviting atmosphere, and exceptional value. Recent improvements include fresh interior paint, a newer roof, and fence repairs, reflecting the pride of ownership and care that has gone into maintaining this home. The property features a generous front yard and backyard, providing plenty of space for entertaining, relaxing, or enjoying outdoor activities. Beautiful crepe myrtle trees add charm and curb appeal to the property and surrounding area. This home has been well maintained, and the sellers have proactively addressed major items that arose during previous inspections. The inspe
Key facts
- Newer roof
- Generous front yard
- Recent improvements
Tags
Property features AI
Finance
- Other: Association management: CCMC - Heartland Community Association
- Financial info: Loan types accepted: Cash, Conventional, FHA
- HOA & community: Mandatory association; Semi-annual association fee (front yard maintenance included)
Exterior
- Parking: Driveway; Covered parking for 2 vehicles; Attached 2-car garage with garage door opener
- Utilities: City water; City sewer; Not in a municipal utility district
- Home design: Single-family residence; Built in 2006; Preowned; Property not attached; Does not include accessory unit; Subdivision: Heartland Tr B Ph 1a
- Construction: Brick, concrete, and siding construction; Asphalt composition roof; Slab foundation
- Exterior features: Back yard with fencing; Fenced yard; Exterior lighting; Easements for electric and water lines
Interior
- Kitchen: Electric cooktop and electric oven/range; Microwave; Built-in cabinets; Pantry; Water line to refrigerator; Dishwasher; Disposal
- Bedrooms: Primary bedroom (level 1) — approx. 14 x 11; Additional bedroom (level 1) — approx. 10 x 11
- Flooring: Laminate flooring
- Bathrooms: Two full bathrooms; Primary bathroom with medicine cabinet; Additional bathroom with medicine cabinet
- Heating & cooling: Central heating; Central air; Ceiling fan(s)
- Interior features: Cable TV available; High-speed internet available; Pantry; Room count: 6; One living area; One dining area; Levels: One
- Laundry & utility: Dryer included; TV antenna
Neighborhood map
What this means for you Summary
Snapshot
- This is a 2-bed/2.0-bath single-family listed at $195k.
Deal economics
- At list price, monthly cash flow is $-212 ($-3k/yr) — negative.
- To cash-flow at today's rent, offer at most $157k (19.3% below list).
- To meet the 1% rule (rent ≥ 1% of price), the offer needs to be $184k (5.5% below list).
- Recommended offer: $157k (19.3% below list) — sets the bar for cash-flow.
Location & tenants
- Location reads: area grade D — affects rentability + tenant quality, not the cash-flow math above.
- Crandall ISD (rural): math 36% / reading 42% proficiency, ranked #351 of 826 in TX (top 42%) — families likely to look elsewhere, expect single-tenant / working-renter base with shorter leases.
- Zoned schools: Hollis T Dietz El (math 32% / reading 40%, grade F, #1,921 of 4,322 statewide, top 45%, 815 students, 60% FRL) — zoned schools average 60% FRL vs 41% district-wide (19 pts higher); higher-poverty schools than district average — tighter screening recommended.
- Market conditions: Rents rising (+1.4%/yr); 2179 active listings in the ZIP; 6 comparable units currently listed for rent nearby; rentals lingering (median 45d on market — plan ~5-8 weeks vacancy on turnover, expect pricing pressure); 50% of comp listings sitting > 30 days — soft ceiling on asking rent; solid renter incomes; 1,747 units permitted in Kaufman County in 2024 (180 in 5+ unit buildings).
Forward outlook
- Local home prices are declining (-3.0%/yr); year-one equity from $1k of loan paydown is wiped out by about $6k of value loss. Plan a longer hold.
- Kaufman County population projected at +43% by 2050 — long-run rental-demand tailwind backs the buy-and-hold thesis.
Negotiation context
- Only 12 days on market — expect competitive offers; lowballing is unlikely to land.
- 11 sale attempts since 20y ago with the ask held roughly flat each time — persistent listings suggest the price (not the market) is what's stuck; bring a comps-based counter.
Risks & watch-outs
- Watch-outs: property tax is 3.1% of price.
- Climate carrying-cost: major wind risk, 27% chance of damaging wind over 30y; moderate wildfire risk; extreme-heat days projected 7→24/yr by 2055 (HVAC capex compounding) — expect insurance premiums to compound above CPI over the hold.
Questions for the listing agent
- What do current leases actually rent for vs. the listed asking? Can we see a recent rent roll and the last 12 months of T-12 income?
- Property tax is high relative to price — has the assessment been appealed recently, and will the sale trigger a re-assessment?
- What does the HOA fee cover, when was the last increase, and are there any pending special assessments or reserve-fund shortfalls?
- Is there a deadline driving the sale (1031 exchange, divorce, estate, relocation)? That informs how much negotiation room exists.
- The area grade is low — what's the realistic commute time and amenity access for the typical tenant pool here? Any planned neighborhood developments (good or bad) we should know about?
- What's the average days-on-market for RENTAL listings here right now (not sales)? A rising rental-DOM trend means longer vacancies and softer asking-rent achievability than the comps imply.
- What's the recent tenant-quality profile in this submarket — average credit score on applications, eviction rate, late-payment / NSF rate, and stable-employment percentage? A property-management company in the area should have these aggregated.
- How much new for-sale + rental construction is in the pipeline within 1–3 miles? Heavy new supply typically softens prices + rents 12–24 months out; constrained supply supports both.
Investment metrics
- 1% rule
- 0.95% ✗
- Cap rate
- 4.99%
- Cash-on-cash
- -4.67%
- DSCR
- 0.79
- GRM
- 8.8
CMA / ARV
- ARV (median comp)
- $231,239
- List price
- $195,000
- Delta
- -15.67%
- Verdict
- UNDERPRICED
- Comps
- 19 within 1.0 mi
Projected returns pro-forma
-3.0% appreciation · 1.42% rent growth · sell at horizon
- IRR
- -26.3%
- Equity multiple
- 0.12×
- Total profit
- $-47,792
- Equity at exit
- $29,075
- IRR
- -31.1%
- Equity multiple
- -0.27×
- Total profit
- $-69,597
- Equity at exit
- $16,860
Cash invested: $54,600 (down + closing). Projections, not guarantees.
Landlord ↔ Tenant lean methodology
- Overall (STATE)
- 87 Strongly Landlord-Friendly
- State Texas
- 87 Strongly Landlord-Friendly · R+5
- County
- — inherits STATE
- City
- — inherits STATE
ZIP-level market 75126
- Rents YoY
- 1.4%
- Active inventory
- 2179
- Price-to-rent
- 8.8×
Monthly cashflow live
- Estimated rent
- $1,843 high interval (Pro) →
- Mortgage (P&I)
- −$1,023
- Tax from tax record
- −$509 /mo · $6,106/yr
- Insurance
- −$81
- HOA
- −$56
- Vacancy / Maint / Mgmt
- −$387
- Net cashflow
- $-212
Break-even live
Sensitivity live
| Price | -10% $-102 | -5% $-157 | +0% $-212 | +5% $-268 | +10% $-323 |
|---|---|---|---|---|---|
| Rent | -10% $-358 | -5% $-285 | +0% $-212 | +5% $-140 | +10% $-67 |
| Rate | -1.0pp $-114 | -0.5pp $-163 | base $-212 | +0.5pp $-263 | +1.0pp $-314 |
UW: 25.0% down · 7.5% · 30yr · 1.5% tax · 5.0% vac · 8.0% maint · 8.0% mgmt
Financing live
Cash to close
- Down payment
- $48,750
- Closing costs
- $5,850
- Reserves months
- —
- Total cash needed
- —
Loan-product check · same deal, 3 products live
Conventional
25% down · 7.5% · 30yr
- Down + closing
- —
- Monthly P&I
- —
- Monthly cashflow
- —
- DSCR
- —
- Eligible?
- —
Personal DTI + credit; lowest rate.
DSCR
20% down · 8.5% · 30yr
- Down + closing
- —
- Monthly P&I
- —
- Monthly cashflow
- —
- DSCR
- —
- Eligible?
- —
No personal income docs; deal must DSCR.
Hard money
10% down · 12.0% · 12mo
- Down + closing
- —
- Monthly P&I
- —
- Monthly cashflow
- —
- DSCR
- —
- Eligible?
- —
Short-term bridge; refi at stabilization.
Rent comps 6 comps
| Address | Beds | Baths | Sqft | Rent | $/sqft | DOM | Units | Dist |
|---|---|---|---|---|---|---|---|---|
| 2015 Angel Way Heartland, TX | 3.0 | 2.0 | 1408 | $1,671 | $1.19 | 22d | 1 | 0.06mi |
| 4009 Freedom St Heartland, TX | 3.0 | 2.0 | 1419 | $1,800 | $1.27 | 45d | 1 | 0.12mi |
| 4032 Eagle Dr Forney, TX | 3.0 | 2.0 | 1456 | $1,775 | $1.22 | 5d | 1 | 0.23mi |
| 2038 Allyson Dr Heartland, TX | 3.0 | 2.0 | 1496 | $1,900 | $1.27 | 44d | 1 | 0.34mi |
| 4002 Bighorn Dr Forney, TX | 3.0 | 2.0 | 1365 | $2,120 | $1.55 | 2d | 1 | 1.12mi |
| 2919 Cascade Ln Forney, TX | 3.0 | 2.0 | 1481 | $2,200 | $1.49 | 44d | 1 | 1.15mi |
HOA detail
- Monthly dues
- $56 · $672/yr
Listing history 43 events
-
2026-06-18days on market $195,000 Active 12 DOM
-
2026-06-17days on market $195,000 Active 11 DOM
-
2026-06-16days on market $195,000 Active 10 DOM
-
2026-06-15days on market $195,000 Active 9 DOM
-
2026-06-13days on market $195,000 Active 7 DOM
-
2026-06-09days on market $195,000 Active 3 DOM
-
2026-06-08days on market $195,000 Active 2 DOM
-
2026-06-07remarks 699-char remark
-
2026-06-07days on market $195,000 Active 1 DOM
-
2026-04-11$195,000 Active 711-char remark
-
2025-09-27historical
-
2025-09-09price $190,000
-
2025-08-24$215,000 Active
-
2025-08-18historical
-
2025-05-31price $205,000
-
2025-04-15price $209,000
-
2025-04-08price $211,000
-
2025-03-13price $215,000
-
2025-03-04price $220,000
-
2025-02-15$230,000 Active
-
2024-07-05price $210,000
-
2024-06-21$230,000 Active
-
2021-06-07historical
-
2021-06-01$200,000 Active
-
2018-10-30soldstatus
-
2018-10-26soldstatus Sold
-
2018-10-02status Pending
-
2018-09-29historical Active Option Contract
-
2018-09-15$144,000 Active
-
2013-12-18soldstatus Closed
-
2013-12-09status Pending
-
2013-12-09status Active
-
2013-12-05status Pending
-
2013-12-04status Active
-
2013-11-24status Pending
-
2013-10-31price $80,000
-
2013-10-01price $85,000
-
2013-09-13price $95,000
-
2013-08-14price $99,900
-
2013-07-08$105,000 Active
-
2007-03-16soldstatus
-
2007-03-03historical
-
2006-12-11$107,490
ⓘ Source: listings_history table (triggers on properties + properties_extension) + one-shot
backfill from property_details.listing_events for pre-trigger history.
Tax reassessment forecast TX · Resets to sale price
- Current annual tax
- $6,106 · $509/mo
- Projected year-2 tax
- $6,106 · $509/mo
- Expected delta
- $0/yr ($0/mo · 0.0%)
ⓘ Screening estimate from a state-policy table — verify with the county assessor before closing.
Climate risk First Street
- Flood 1/10 Low FEMA zone X (unshaded) · 0% chance over 30 yrs
- Wildfire 5/10 Major
- Heat 7/10 Severe 7 d/yr ≥110°F today · 24 d/yr by 30 yrs out
- Wind 6/10 Major 27% chance of damaging wind over 30 yrs
- Air quality 2/10 Low 1 unhealthy d/yr today · 1 by 30 yrs out
Nearby sold comps map
Loading sold comps map…
Walkable amenities ~0.75 mi
Loading nearby amenities…
Taxation est. · year 1
- Rental income
- $22,120
- − Mortgage interest
- −$10,923
- − Property taxes
- −$6,106
- − Insurance
- −$975
- − Repairs & maintenance
- −$1,770
- − Management
- −$1,770
- − HOA
- −$672
- − Depreciation
- −$5,673
- Taxable loss
- −$5,768
- Est. tax savings @ 24.0%
- +$1,384
- After-tax cash flow
- $-1,165/yr
For passive investors: Depreciation is non-cash, so a rental often shows a tax loss while cash-flowing — sheltering income. Rental losses are passive: they offset passive income freely, and up to $25,000/yr can offset ordinary (W-2) income if you actively participate and your MAGI is under $100k (phasing out to $0 by $150k); unused losses carry forward. On sale, claimed depreciation is recaptured at up to 25%, and gains may owe capital-gains tax (a 1031 exchange can defer both). Figures are a year-1 estimate at your 24.0% rate — not tax advice; consult a CPA.
Schools (NCES district)
- District
- Crandall ISD
- NCES district ID
- 4815510
- Math proficiency
- 36% ▼ -13.00%
- Reading proficiency
- 42% ▼ -8.00%
- Median HH income
- $70,076
- Composite
- 35.57/100
- National rank
- #4901
- State rank
- #351 of 826 in TX
Livability — Heartland
No livability data for this city. (Only ~50 U.S. cities are tracked.)
Census & demographics
- Census place
- Heartland, TX
- County
- Kaufman County · 122,338 people
- Metro
- Dallas-Fort Worth-Arlington, TX
- Population (ZIP)
- 84,799
- Household income
- $103,673
- Rent vs Own
- Severe rent burden
- 1306.0
Population outlook (Kaufman County) Hauer SSP2
- Today (2025)
- 138,716 people
- By 2030
- 150,815 · +8.7%
- By 2040
- 174,877 · +26.1%
- By 2050
- 198,020 · +42.8%
- By 2075
- 251,908 · +81.6%
- By 2100
- 285,325 · +105.7%
Race, ethnicity, and origin ACS 2023
- Neighborhood character
- Diverse neighborhood (Simpson 0.68)
- Race & ethnicity
- White 45% Black 25% Hispanic / Latino 23% Two or more races 14% Asian 3%
- Hispanic origin (detail)
- Mexican 18% Puerto Rican 1%
- Common ancestry
- Italian 2% Slovak 1% Portuguese 1%
- Foreign-born
- 12% · Canada, Vietnam
- Languages at home
- 79% English-only · Spanish 14% Arabic 1% Vietnamese 1%
Political lean MEDSL · Kaufman
- 2024 margin
- Strong R (+27.9) · D 35.6% · R 63.5%
- 2008→2024 swing
- +7.9pp toward D · 2008: -35.8pp · 2024: -27.9pp
- All cycles
- 2024: R+27.9 2020: R+33.9 2016: R+47.0 2012: R+44.4 2008: R+35.8
Not yet ingested
- Civics
- —
Market trends
- HPI YoY
- ▼ -102.93%
- Current HPI
- 148.5749
- Rent YoY
- ▲ 1.42%
- Metro
- Dallas-Fort Worth-Arlington, TX
- State GDP YoY
- ▲ 3.95%
- F500 in state
- 110
Industry mix (Fortune 500 HQ in TX)
| Industry | F500 HQs | Revenue |
|---|---|---|
| Energy | 16 | $1,198B |
|
||
| Technology | 5 | $198B |
|
||
| Engineering / Construction | 4 | $72B |
|
||
| Energy Services | 3 | $60B |
|
||
| Utilities | 3 | $41B |
|
||
| Healthcare | 2 | $330B |
|
||
Price history
+81.4% since first listed36 events — show timeline
- 2026-06-06 Listed $195,000 NTREIS
- 2026-05-27 Listing Removed — NTREIS
- 2026-04-11 Listed $195,000 NTREIS
- 2025-09-27 Listing Removed — NTREIS
- 2025-09-09 Price Changed $190,000 NTREIS
- 2025-08-24 Listed $215,000 NTREIS
- 2025-08-18 Listing Removed — NTREIS
- 2025-05-31 Price Changed $205,000 NTREIS
- 2025-04-15 Price Changed $209,000 NTREIS
- 2025-04-08 Price Changed $211,000 NTREIS
- 2025-03-13 Price Changed $215,000 NTREIS
- 2025-03-04 Price Changed $220,000 NTREIS
- 2025-02-15 Listed $230,000 NTREIS
- 2024-07-05 Price Changed $210,000 NTREIS
- 2024-06-21 Listed $230,000 NTREIS
- 2021-06-07 Listing Removed — NTREIS
- 2021-06-01 Listed $200,000 NTREIS
- 2018-10-30 Sold (Public Records) — Public Records
- 2018-10-26 Sold (MLS) — NTREIS
- 2018-10-02 Pending — NTREIS
- 2018-09-29 Contingent — NTREIS
- 2018-09-15 Listed $144,000 NTREIS
- 2013-12-18 Sold (MLS) — NTREIS
- 2013-12-09 Pending — NTREIS
- 2013-12-09 Relisted — NTREIS
- 2013-12-05 Pending — NTREIS
- 2013-12-04 Relisted — NTREIS
- 2013-11-24 Pending — NTREIS
- 2013-10-31 Price Changed $80,000 NTREIS
- 2013-10-01 Price Changed $85,000 NTREIS
- 2013-09-13 Price Changed $95,000 NTREIS
- 2013-08-14 Price Changed $99,900 NTREIS
- 2013-07-08 Listed $105,000 NTREIS
- 2007-03-16 Sold (MLS) — NTREIS
- 2007-03-03 Listing Removed — NTREIS
- 2006-12-11 Listed $107,490 NTREIS
Property tax history
+4.8%/yrLatest (2025): $6,106 · +0.1% YoY. Source: county tax records.
Cash-flow waterfall
monthlySold comps — $/sqft
last 12 mo · ≤1 miLoading sold comps…