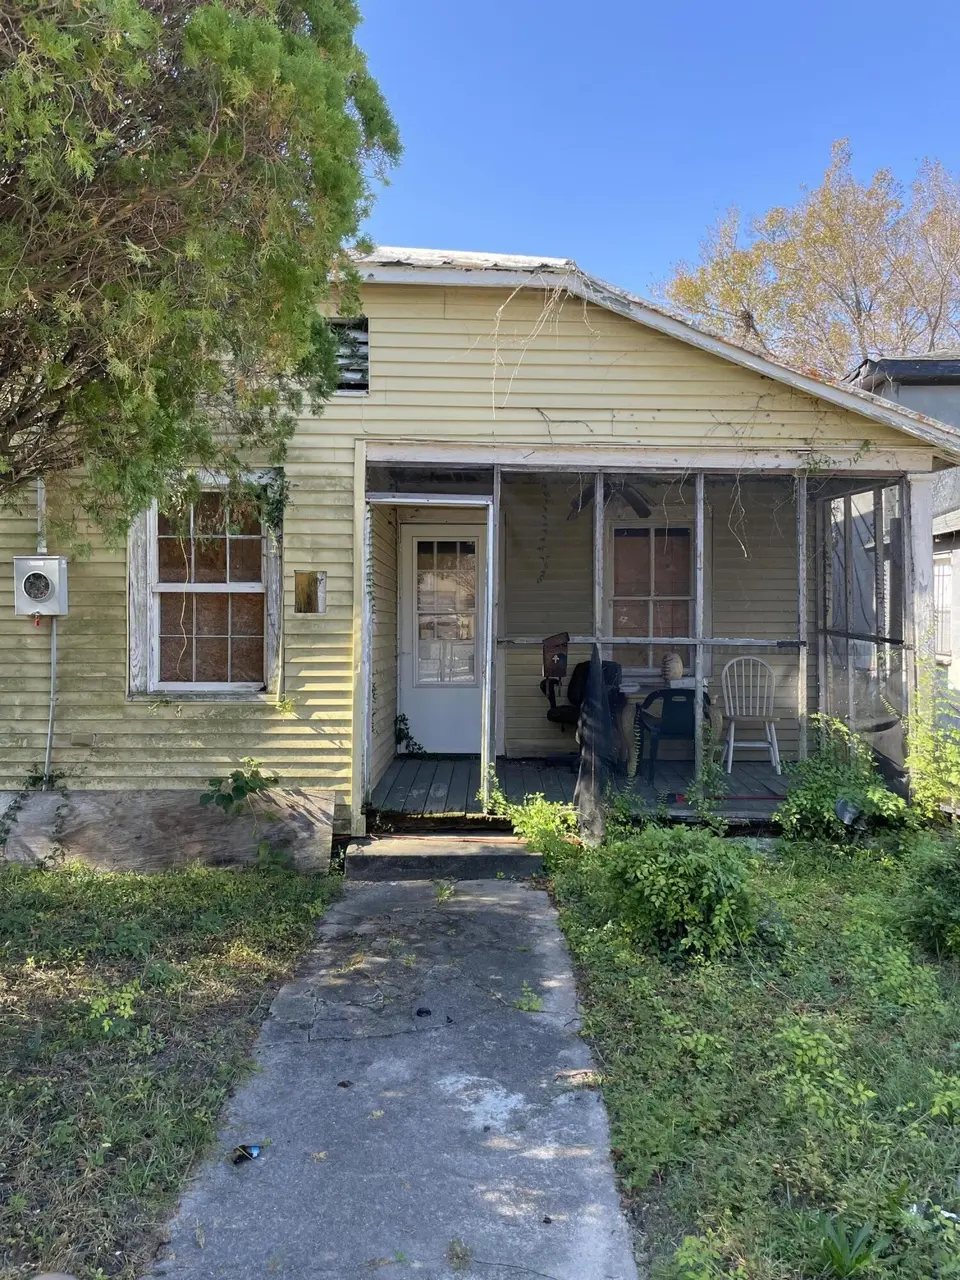
431 N Hanover St · Charleston, SC
Flood risk 9/10 · Severe
- FEMA flood zone
- AE
- Chance of flooding over 30 yrs
- 0.99%
- Est. flood insurance / yr
- $1,737 – $8,500
Fire risk 3/10 · Minor
- Est. fire insurance / yr
- $783 – $1,453
Heat risk 10/10 · Severe
- Hot days now (above 105°F)
- 7 days/yr
- Hot days in 30 yrs
- 18 days/yr
Wind risk 9/10 · Severe
- Chance of severe wind over 30 yrs
- 99.0%
Air-quality risk 3/10 · Minor
- Unhealthy air days now
- 3 days/yr
- Unhealthy air days in 30 yrs
- 3 days/yr
Risk factors via First Street. Map © Google.
Why this score? — see what drove the B- grade
The composite is a weighted blend of 9 inputs, each scored 0–100. Each bar is that input's sub-score; the figure is the points it added to the 100-point composite (weight × sub-score).
- Cash flow +29.3/30.0
- DSCR +10.0/10.0
- ARV discount +7.5/15.0
- 1% rule +6.8/10.0
- Schools +4.3/10.0
- Livability +3.8/5.0
- Rent growth +3.6/5.0
- Condition / age +2.5/5.0
- Appreciation +0.0/10.0
$365,000
🖨 Deal sheet (PDF) 📄 Offer letter ✓ Due diligence
Listing remarks
Welcome to 431 N Hanover Street. .. A place you can put your personal stamp on and call YOURS. Nestled within the progressive end of Downtown Charleston, this home features a charming front porch, a fenced front yard, and more than 1700 square feet of home to redesign to your liking. The property is located near the Arthur Ravenel Bridge, the Charleston Port for commercial cruises, and is walking distance to 45 Romney which has a host of restaurants and bars. Schedule your showing TODAY. .. YOU DON'T WANT TO MISS OUT ON THIS HOME! Home sold AS-IS WHERE IS. Agent is related to the owner.
Key facts
- 3,484 sq ft lot
- Built 1935
- Listed 5 days
Neighborhood map
What this means for you Summary
Snapshot
- This is a 4-bed/1.0-bath single-family listed at $365k.
Deal economics
- At list price, monthly cash flow is $856 ($10k/yr) — positive.
- The deal already cash-flows at list — no discount required.
- Meets the 1% rule at list price ($4k rent vs $365k).
- Cap rate 10.5% vs local median 2.4% in Charleston — top-decile yield for the area; either an underpriced asset or a hidden risk that comps aren't pricing in. Stress-test before assuming the spread holds.
Location & tenants
- Location reads 76/100 on livability (#22 in SC, #3,336 nationally) — a middle-class / working-renter tenant base. Strengths: amenities A+, housing A+, health & safety A+; Watch: crime D+, commute F, cost of living D-.
- Charleston 01 (urban): math 48% / reading 53% proficiency, ranked #7 of 80 in SC (top 9%) — acceptable for families but not a draw, mixed tenant base, ~2y average lease.
- Zoned schools: Sanders-Clyde Elementary (math 12% / reading 12%, grade F, #572 of 597 statewide, top 97%, 390 students, 100% FRL); Simmons Pinckney Middle (math 3% / reading 13%, grade F, #226 of 229 statewide, top 99%, 219 students, 100% FRL); Burke High (math 32% / reading 67%, grade D, #151 of 196 statewide, top 79%, 352 students, 100% FRL) — zoned schools average 100% FRL vs 44% district-wide (56 pts higher); higher-poverty schools than district average — tighter screening recommended.
- Zoned-school proficiency averages 23% at this address vs 50% district-wide (-27 pts) — the specific schools serving this property underperform the Charleston 01 average; the district grade overstates school quality for this exact location.
- Market conditions: Rents rising fast (+4.6%/yr); 151 active listings in the ZIP; 40 comparable units currently listed for rent nearby; rentals at typical pace (median 23d on market — plan ~3-4 weeks tenant-placement turnaround); 4,156 units permitted in Charleston County in 2024 (857 in 5+ unit buildings).
- At $4,324/mo this rent would consume 78% of the median local household income ($67k/yr) (locally 2319% of renters already pay >50% of income on rent) — very limited rent-growth headroom before tenants either downsize or default.
Forward outlook
- Local home prices are declining (-3.0%/yr); year-one equity from $3k of loan paydown is wiped out by about $11k of value loss. Plan a longer hold.
- Charleston County population projected at +44% by 2050 — long-run rental-demand tailwind backs the buy-and-hold thesis.
- At projected returns (-3.0% appreciation + 4.6% rent growth), your $102k cash investment doubles in ~9 years — after that, you're playing with house money.
Negotiation context
- Only 5 days on market — expect competitive offers; lowballing is unlikely to land.
- 3 sale attempts since 15y ago with the ask held roughly flat each time — persistent listings suggest the price (not the market) is what's stuck; bring a comps-based counter.
Risks & watch-outs
- Watch-outs: flood insurance adds $427/mo; built in 1935 — expect roof / HVAC / electrical / plumbing capex.
- Climate carrying-cost: in FEMA flood zone AE (mandatory federal flood insurance); severe wind risk, 99% chance of damaging wind over 30y; extreme-heat days projected 7→18/yr by 2055 (HVAC capex compounding) — expect insurance premiums to compound above CPI over the hold.
Questions for the listing agent
- Built in 1935 — when were the roof, HVAC, electrical panel, plumbing, and water heater last replaced?
- What's the actual annual flood-insurance premium (NFIP or private), and is the property in a SFHA with mandatory coverage?
- Is there a deadline driving the sale (1031 exchange, divorce, estate, relocation)? That informs how much negotiation room exists.
- Schools are A-rated — typically a magnet for longer-tenancy family renters. What's the average tenant stay here, and is there a school-zone premium baked into asking?
- Crime grade is D in this area — have there been break-ins, vandalism, or insurance claims at this property in the last 3 years? What carrier currently insures it and at what premium?
- What's the average days-on-market for RENTAL listings here right now (not sales)? A rising rental-DOM trend means longer vacancies and softer asking-rent achievability than the comps imply.
- What's the recent tenant-quality profile in this submarket — average credit score on applications, eviction rate, late-payment / NSF rate, and stable-employment percentage? A property-management company in the area should have these aggregated.
- How much new for-sale + rental construction is in the pipeline within 1–3 miles? Heavy new supply typically softens prices + rents 12–24 months out; constrained supply supports both.
Investment metrics
- 1% rule
- 1.18% ✓
- Cap rate
- 10.51%
- Cash-on-cash
- 15.06%
- DSCR
- 1.67
- GRM
- 7.0
CMA / ARV
- ARV (on-the-fly)
- $981,924
- Comps found
- 12
Show comp detail 12 sales within ~0.75 mi
| Address | Dist | Beds/Ba | Sqft | Sold | Price | $/sf | Match |
|---|---|---|---|---|---|---|---|
| 4 Poplar St | 0.24mi | 4/2.0 | 1,729 (-1%) | 3mo | $520,000 | $301 | 81 |
| 60 Cypress St | 0.39mi | 3/2.5 (-1) | 1,751 (+1%) | 0mo | $1,176,255 | $672 | 70 |
| 1130 King St | 0.30mi | 3/1.5 (-1) | 1,583 (-9%) | 1mo | $675,000 | $426 | 63 |
| 995 Ashley Ave | 0.68mi | 4/3.5 | 1,744 (+0%) | 1mo | $1,920,000 | $1,101 | 57 |
| 16 N Enston Ave | 0.46mi | 3/1.5 (-1) | 1,549 (-11%) | 1mo | $1,125,000 | $726 | 52 |
| 2 F St | 0.72mi | 3/2.5 (-1) | 1,770 (+2%) | 2mo | $875,000 | $494 | 51 |
| 152 Grove St | 0.73mi | 3/2.0 (-1) | 1,800 (+3%) | 0mo | $1,260,000 | $700 | 51 |
| 14 F St Unit B | 0.69mi | 3/2.5 (-1) | 1,676 (-4%) | 2mo | $800,000 | $477 | 48 |
| 668 Rutledge Ave | 0.66mi | 3/1.5 (-1) | 1,620 (-7%) | 3mo | $799,999 | $494 | 48 |
| 8 Homel Pl | 0.61mi | 3/2.5 (-1) | 1,936 (+11%) | 1mo | $1,505,000 | $777 | 41 |
| 6 F St | 0.72mi | 3/2.5 (-1) | 1,553 (-11%) | 2mo | $815,000 | $525 | 36 |
| 16 Cleveland St #300 | 0.55mi | 3/3.5 (-1) | 1,489 (-14%) | 2mo | $840,000 | $564 | 34 |
Match score weights: distance 35% · size 25% · config 20% · recency 20%. Top-matched comps best support the ARV.
Projected returns pro-forma
-3.0% appreciation · 4.58% rent growth · sell at horizon
- IRR
- 0.6%
- Equity multiple
- 1.02×
- Total profit
- $2,468
- Equity at exit
- $54,423
- IRR
- 11.8%
- Equity multiple
- 2.00×
- Total profit
- $102,331
- Equity at exit
- $31,559
Cash invested: $102,200 (down + closing). Projections, not guarantees.
Landlord ↔ Tenant lean methodology
- Overall (STATE)
- 90 Strongly Landlord-Friendly
- State South Carolina
- 90 Strongly Landlord-Friendly · R+6
- County
- — inherits STATE
- City
- — inherits STATE
ZIP-level market 29403
- Rents YoY
- 4.6%
- Active inventory
- 151
- Price-to-rent
- 7.0×
Monthly cashflow live
- Estimated rent
- $4,324 high interval (Pro) →
- Mortgage (P&I)
- −$1,914
- Tax from tax record
- −$67 /mo · $804/yr
- Insurance
- −$152
- Flood insurance flood zone
- −$427 /mo · $5,118/yr
- HOA
- −$0
- Vacancy / Maint / Mgmt
- −$908
- Net cashflow
- $856
Break-even live
Sensitivity live
| Price | -10% $1,063 | -5% $960 | +0% $856 | +5% $753 | +10% $650 |
|---|---|---|---|---|---|
| Rent | -10% $515 | -5% $686 | +0% $856 | +5% $1,027 | +10% $1,198 |
| Rate | -1.0pp $1,040 | -0.5pp $949 | base $856 | +0.5pp $762 | +1.0pp $666 |
UW: 25.0% down · 7.5% · 30yr · 1.5% tax · 5.0% vac · 8.0% maint · 8.0% mgmt
Financing live
Cash to close
- Down payment
- $91,250
- Closing costs
- $10,950
- Reserves months
- —
- Total cash needed
- —
Loan-product check · same deal, 3 products live
Conventional
25% down · 7.5% · 30yr
- Down + closing
- —
- Monthly P&I
- —
- Monthly cashflow
- —
- DSCR
- —
- Eligible?
- —
Personal DTI + credit; lowest rate.
DSCR
20% down · 8.5% · 30yr
- Down + closing
- —
- Monthly P&I
- —
- Monthly cashflow
- —
- DSCR
- —
- Eligible?
- —
No personal income docs; deal must DSCR.
Hard money
10% down · 12.0% · 12mo
- Down + closing
- —
- Monthly P&I
- —
- Monthly cashflow
- —
- DSCR
- —
- Eligible?
- —
Short-term bridge; refi at stabilization.
Rent comps 40 comps
| Address | Beds | Baths | Sqft | Rent | $/sqft | DOM | Units | Dist |
|---|---|---|---|---|---|---|---|---|
| 30 Isabella St Unit 30 Charleston, SC | 3.0 | 2.5 | 1400 | $4,150 | $2.96 | 13d | 1 | 0.06mi |
| 87 Romney St Charleston, SC | 3.0 | 2.5 | 2038 | $3,695 | $1.81 | 25d | 1 | 0.20mi |
| 35 Cypress St Charleston, SC | 4.0 | 3.5 | 2064 | $5,900 | $2.86 | 25d | 1 | 0.28mi |
| 1195 King St Charleston, SC | 3.0 | 2.0 | 1700 | $3,700 | $2.18 | 23d | 1 | 0.37mi |
| 1000 King St Charleston, SC | 2.0–3.0 | 1.0–2.0 | 975 | $2,800 | $2.87 | 4d | 9 | 0.46mi |
| 925 Rutledge Ave Charleston, SC | 3.0 | 1.0 | 1302 | $2,800 | $2.15 | 16d | 1 | 0.57mi |
| 6 Maverick St Charleston, SC | 4.0 | 2.0 | 1170 | $3,750 | $3.21 | 4d | 1 | 0.58mi |
| 16 Gordon St Charleston, SC | 3.0 | 1.5 | 1344 | $3,800 | $2.83 | 13d | 1 | 0.62mi |
| 931 Ashley Ave Charleston, SC | 3.0 | 3.0 | 1794 | $4,049 | $2.26 | 4d | 1 | 0.63mi |
| 838 Morrison Dr Charleston, SC | 3.0 | 1.0–2.0 | 984 | $4,929 | $5.01 | 4d | 28 | 0.66mi |
| 40 H St Charleston, SC | 3.0 | 2.0 | 1317 | $3,930 | $2.98 | 16d | 1 | 0.68mi |
| 1 Piedmont Ave Charleston, SC | 3.0 | 3.0 | 1810 | $6,500 | $3.59 | 25d | 1 | 0.69mi |
| 201 Nassau St Charleston, SC | 3.0 | 2.0 | 1188 | $3,800 | $3.20 | 4d | 1 | 0.75mi |
| 6 F St Charleston, SC | 3.0 | 2.5 | 1553 | $5,600 | $3.61 | 25d | 1 | 0.75mi |
| 13 H St Charleston, SC | 3.0 | 2.5 | 1201 | $6,000 | $5.00 | 4d | 1 | 0.75mi |
| 105 Cooper St Charleston, SC | 3.0 | 2.0 | 1056 | $2,750 | $2.60 | 25d | 1 | 0.86mi |
| 73 Cooper St Charleston, SC | 3.0 | 3.0 | 1450 | $6,000 | $4.14 | 25d | 1 | 0.86mi |
| 76 Alberta Ave Charleston, SC | 3.0 | 2.5 | 1551 | $5,730 | $3.69 | 25d | 1 | 0.91mi |
| 18 Line St Unit C Charleston, SC | 3.0 | 2.0 | 1300 | $3,281 | $2.52 | 16d | 1 | 0.93mi |
| 70 Carolina St Unit 301 Charleston, SC | 3.0 | 3.0 | 1415 | $5,400 | $3.82 | 25d | 1 | 0.95mi |
| 272 Coming St Unit C Charleston, SC | 3.0 | 3.5 | 1514 | $5,000 | $3.30 | 25d | 1 | 0.99mi |
| 78 Nassau St Charleston, SC | 3.0 | 2.0 | 1068 | $4,500 | $4.21 | 4d | 1 | 1.00mi |
| 16 Nats Ct Charleston, SC | 3.0 | 2.5 | 1400 | $4,875 | $3.48 | 16d | 1 | 1.08mi |
| 9 Bogard St Apt C Charleston, SC | 3.0 | 2.5 | 1339 | $5,400 | $4.03 | 25d | 1 | 1.10mi |
| 16 Porters Ct Charleston, SC | 3.0 | 2.0 | 1175 | $3,500 | $2.98 | 25d | 1 | 1.13mi |
| 655 E Bay St Charleston, SC | 3.0 | 1.0–2.0 | 1353 | $5,004 | $3.70 | 4d | 5 | 1.15mi |
| 250 Rutledge Ave Unit B Charleston, SC | 3.0 | 2.0 | 1100 | $4,500 | $4.09 | 16d | 1 | 1.18mi |
| 28 Woolfe St Unit 1523764P Charleston, SC | 4.0 | 4.0 | 1539 | $4,100 | $2.66 | 23d | 1 | 1.19mi |
| 28 Woolfe St Unit 1523766P Charleston, SC | 3.0 | 3.0 | 1356 | $3,326 | $2.45 | 16d | 1 | 1.19mi |
| 19 Amherst St Charleston, SC | 4.0 | 2.0 | 1399 | $3,999 | $2.86 | 25d | 1 | 1.20mi |
| 19 Amherst St Unit 1 Charleston, SC | 3.0 | 1.5 | 1350 | $3,299 | $2.44 | 25d | 1 | 1.20mi |
| 49 America St Charleston, SC | 4.0 | 2.0 | 2180 | $6,000 | $2.75 | 23d | 1 | 1.21mi |
| 189 3rd Ave Charleston, SC | 3.0 | 2.0 | 1420 | $5,800 | $4.08 | 13d | 1 | 1.22mi |
| 16 Reid St Unit 1 Charleston, SC | 3.0 | 1.5 | 1300 | $2,999 | $2.31 | 25d | 1 | 1.22mi |
| 61 Reid St Unit C Charleston, SC | 4.0 | 2.5 | 1654 | $6,000 | $3.63 | 23d | 1 | 1.23mi |
| 39 America St Unit A Charleston, SC | 3.0 | 1.0 | 1200 | $2,600 | $2.17 | 25d | 1 | 1.25mi |
| 3 Carrere Ct Charleston, SC | 3.0 | 2.5 | 1469 | $6,000 | $4.08 | 4d | 1 | 1.38mi |
| 45 Morris St Unit A Charleston, SC | 3.0 | 2.5 | 1449 | $5,300 | $3.66 | 4d | 1 | 1.38mi |
| 9 Allway St Charleston, SC | 3.0 | 2.0 | 1109 | $2,700 | $2.43 | 16d | 1 | 1.43mi |
| 1837 Doscher Ave North Charleston, SC | 4.0 | 1.0 | 1299 | $2,000 | $1.54 | 25d | 1 | 1.45mi |
Listing history 8 events
-
2022-11-30status Pending
-
2022-11-21status Pending
-
2022-11-21historical
-
2022-11-18status Active
-
2022-11-14status Pending
-
2022-11-12$365,000 Active
-
2015-02-06historical
-
2011-01-21$90,000
ⓘ Source: listings_history table (triggers on properties + properties_extension) + one-shot
backfill from property_details.listing_events for pre-trigger history.
Tax reassessment forecast SC · Resets to sale price
- Current annual tax
- $804 · $67/mo
- Projected year-2 tax
- $2,080 · $173/mo
- Expected delta
- +$1,277/yr (+$106/mo · 158.9%)
ⓘ Screening estimate from a state-policy table — verify with the county assessor before closing.
Climate risk First Street
- Flood 9/10 Extreme FEMA zone AE · 99% chance over 30 yrs
- Wildfire 3/10 Moderate
- Heat 10/10 Extreme 7 d/yr ≥105°F today · 18 d/yr by 30 yrs out
- Wind 9/10 Extreme 99% chance of damaging wind over 30 yrs
- Air quality 3/10 Moderate 3 unhealthy d/yr today · 3 by 30 yrs out
Nearby sold comps map
Loading sold comps map…
Walkable amenities ~0.75 mi
Loading nearby amenities…
Taxation est. · year 1
- Rental income
- $51,890
- − Mortgage interest
- −$20,446
- − Property taxes
- −$804
- − Insurance
- −$6,944
- − Repairs & maintenance
- −$4,151
- − Management
- −$4,151
- − Depreciation
- −$10,618
- Taxable income
- $4,776
- Est. tax owed @ 24.0%
- −$1,146
- After-tax cash flow
- $9,130/yr
For passive investors: Depreciation is non-cash, so a rental often shows a tax loss while cash-flowing — sheltering income. Rental losses are passive: they offset passive income freely, and up to $25,000/yr can offset ordinary (W-2) income if you actively participate and your MAGI is under $100k (phasing out to $0 by $150k); unused losses carry forward. On sale, claimed depreciation is recaptured at up to 25%, and gains may owe capital-gains tax (a 1031 exchange can defer both). Figures are a year-1 estimate at your 24.0% rate — not tax advice; consult a CPA.
Schools (NCES district)
- District
- Charleston 01
- NCES district ID
- 4501440
- Math proficiency
- 48% ▼ -2.00%
- Reading proficiency
- 53% ▬ 0.00%
- Median HH income
- $52,376
- Composite
- 43.41/100
- National rank
- #3018
- State rank
- #7 of 80 in SC
Livability — Charleston
- Score
- 76/100
- State rank
- #22
- US rank
- #3336
Category grades
Schools grade is shown separately in the Schools card above.
Census & demographics
- Census place
- Charleston, SC
- County
- Charleston County · 366,793 people
- City population
- 200,573
- Metro
- Charleston-North Charleston, SC
- Population (ZIP)
- 22,533
- Household income
- $66,944
- Rent vs Own
- Severe rent burden
- 2319.0
Population outlook (Charleston County) Hauer SSP2
- Today (2025)
- 480,562 people
- By 2030
- 525,921 · +9.4%
- By 2040
- 612,189 · +27.4%
- By 2050
- 691,627 · +43.9%
- By 2075
- 847,979 · +76.5%
- By 2100
- 926,482 · +92.8%
Race, ethnicity, and origin ACS 2023
- Neighborhood character
- Majority White (58%)
- Race & ethnicity
- White 58% Black 34% Hispanic / Latino 4% Two or more races 3% Asian 1%
- Common ancestry
- Slovak 2% Italian 2% Romanian 1%
- Foreign-born
- 3% · Canada, Dominican Republic, China
- Languages at home
- 96% English-only · Spanish 1% French/Haitian/Cajun 1% Other Indo-European 1%
Political lean MEDSL · Charleston
- 2024 margin
- Lean D (+5.7) · D 51.9% · R 46.3% · Other 1.8%
- 2008→2024 swing
- -2.7pp toward R · 2008: 8.3pp · 2024: 5.7pp
- All cycles
- 2024: D+5.7 2020: D+12.9 2016: D+7.9 2012: D+2.4 2008: D+8.3
Not yet ingested
- Civics
- —
Market trends
- HPI YoY
- ▼ -471.75%
- Current HPI
- 585.4871
- Rent YoY
- ▲ 4.58%
- Metro
- Charleston-North Charleston, SC
- State GDP YoY
- ▲ 4.51%
- F500 in state
- 2
Industry mix (Fortune 500 HQ in SC)
| Industry | F500 HQs | Revenue |
|---|---|---|
| Packaging | 1 | $7B |
|
||
Price history
+305.6% since first listed8 events — show timeline
- 2022-11-30 Pending — Charleston Trident MLS
- 2022-11-21 Pending — Charleston Trident MLS
- 2022-11-21 Listing Removed — Charleston Trident MLS
- 2022-11-18 Relisted — Charleston Trident MLS
- 2022-11-14 Pending — Charleston Trident MLS
- 2022-11-12 Listed $365,000 Charleston Trident MLS
- 2015-02-06 Listing Removed — Charleston Trident MLS
- 2011-01-21 Listed $90,000 Charleston Trident MLS
Property tax history
+12.0%/yrLatest (2020): $804 · +76.0% YoY. Source: county tax records.
Cash-flow waterfall
monthlySold comps — $/sqft
last 12 mo · ≤1 miLoading sold comps…