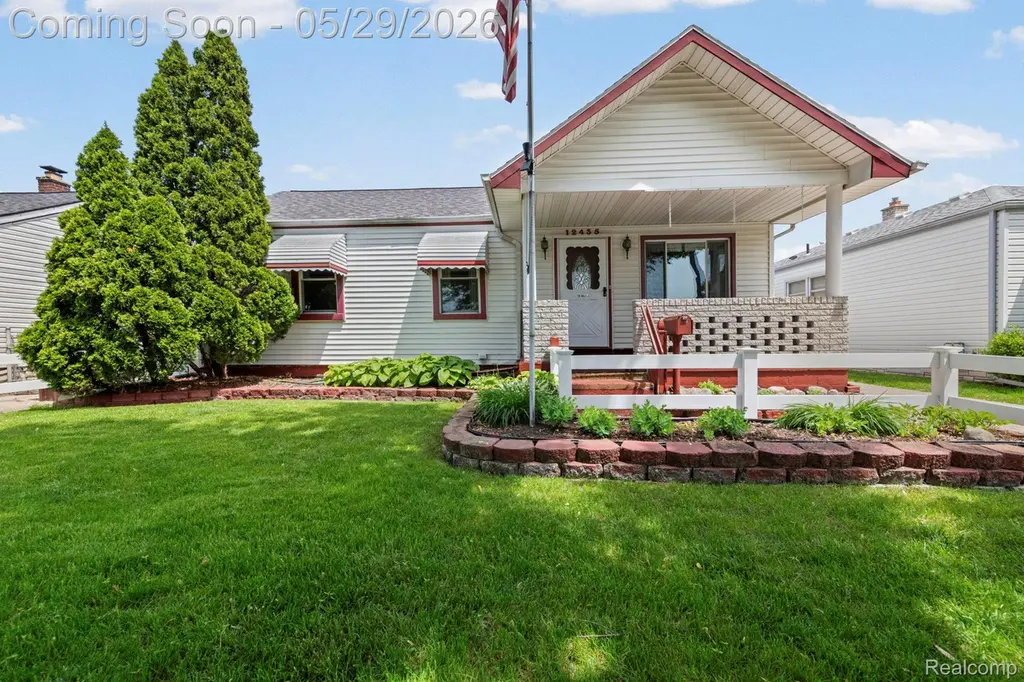
12435 Agnes St · Southgate, MI
Flood risk 1/10 · Minimal
- FEMA flood zone
- X (unshaded)
- Chance of flooding over 30 yrs
- 0.0%
- Est. flood insurance / yr
- $473 – $860
Fire risk 1/10 · Minimal
- Est. fire insurance / yr
- $784 – $1,456
Heat risk 3/10 · Minor
- Hot days now (above 96°F)
- 7 days/yr
- Hot days in 30 yrs
- 15 days/yr
Wind risk 2/10 · Minimal
- Chance of severe wind over 30 yrs
- —
Air-quality risk 3/10 · Minor
- Unhealthy air days now
- 3 days/yr
- Unhealthy air days in 30 yrs
- 5 days/yr
Risk factors via First Street. Map © Google.
Why this score? — see what drove the D- grade
The composite is a weighted blend of 9 inputs, each scored 0–100. Each bar is that input's sub-score; the figure is the points it added to the 100-point composite (weight × sub-score).
- Cash flow +14.8/30.0
- DSCR +4.5/10.0
- Livability +4.2/5.0
- 1% rule +3.9/10.0
- Rent growth +3.5/5.0
- ARV discount +2.9/15.0
- Schools +2.5/10.0
- Condition / age +2.5/5.0
- Appreciation +0.0/10.0
$199,900
🖨 Deal sheet 📄 Offer letter ✓ Due diligence
Listing remarks MLS
Beautifully maintained ranch offering incredible space, character, and functionality throughout. Pride of ownership is evident from the beautifully kept exterior and landscaping to the spacious interior featuring a huge open kitchen and huge addition with dining area, oversized family room with brick accent wall and fireplace, finished basement with additional full bath, and an enormous garage/workshop space perfect for hobbies, storage, or entertaining. Original finishes have been exceptionally cared for, giving you the opportunity to move right in or personalize over time. Additional features include a covered side patio/storage area, vinyl privacy fencing, plenty of storage, and excellent curb appeal. Solid home with great bones and endless potential! Nothing to do here but move right in!
Key facts
- 5,663 sq ft lot
- 2 garage spots
- Built 1948
Property features AI
Exterior
- Parking: Detached 2-car garage
- Utilities: Public water; Public sewer
- Home design: Single-family residence; One level; Ground-level entry with steps
- Construction: Vinyl siding; Asphalt roof; Built with foundation and finished basement
- Exterior features: Porch; Fenced yard; Shed(s)
Interior
- Kitchen: Free-standing gas range; Free-standing refrigerator; Dishwasher; Disposal; Microwave
- Bathrooms: 2 full bathrooms
- Heating & cooling: Forced air heating (natural gas); Wood stove; Central air conditioning; Ceiling fans
- Interior features: Finished basement; Wood burning stove fireplace in family room; Fireplace included; 6 total rooms
- Laundry & utility: Washer and dryer included; Gas dryer hookup; Gas water heater
Neighborhood map
What this means for you Summary
Snapshot
- This is a 3-bed/1.0-bath single-family listed at $200k.
Deal economics
- At list price, monthly cash flow is $54 ($649/yr) — positive.
- The deal already cash-flows at list — no discount required.
- To meet the 1% rule (rent ≥ 1% of price), the offer needs to be $177k (11.3% below list).
- Recommended offer: $177k (11.3% below list) — sets the bar for 1% rule.
- Cap rate 6.6% vs local median 5.2% in Southgate — meaningfully above typical; check what's discounted (condition, days-on-market, listing class) to confirm the premium yield is real.
Location & tenants
- Location reads 85/100 on livability (#29 in MI, #582 nationally) — a professional / high-income tenant draw. Strengths: amenities A+, commute A+, cost of living A+; Watch: schools D, crime D-.
- Southgate Community School District (suburban): math 21% / reading 36% proficiency, ranked #379 of 540 in MI (top 70%) — low school quality limits family demand, transient renter base, plan for 1-2y turnover.
- Market conditions: Rents rising fast (+4.0%/yr); 115 active listings in the ZIP; 11 comparable units currently listed for rent nearby; rentals at typical pace (median 18d on market — plan ~3-4 weeks tenant-placement turnaround); 2,639 units permitted in Wayne County in 2024 (1,216 in 5+ unit buildings).
- This rent runs 32% of the median local income ($66k/yr) — at the standard rent-burdened threshold; future hikes will face affordability resistance.
Forward outlook
- Local home prices are declining (-3.0%/yr); year-one equity from $1k of loan paydown is wiped out by about $6k of value loss. Plan a longer hold.
- Wayne County population projected at -17% by 2050 — secular population decline; favor cash flow + early exit over multi-decade hold.
Negotiation context
- It's been on market 18 days — a 2% lower offer ($197k) is reasonable based on typical stale-listing flexibility.
- 2 sale attempts with the ask held roughly flat each time — persistent listings suggest the price (not the market) is what's stuck; bring a comps-based counter.
Risks & watch-outs
- Watch-outs: built in 1948 — expect roof / HVAC / electrical / plumbing capex.
Questions for the listing agent
- Built in 1948 — when were the roof, HVAC, electrical panel, plumbing, and water heater last replaced?
- Is there a deadline driving the sale (1031 exchange, divorce, estate, relocation)? That informs how much negotiation room exists.
- Schools are D-rated, which usually means shorter tenancies and higher turnover. Who's the typical renter profile here, and what's been the actual vacancy rate?
- Crime grade is D in this area — have there been break-ins, vandalism, or insurance claims at this property in the last 3 years? What carrier currently insures it and at what premium?
- The area grade is low — what's the realistic commute time and amenity access for the typical tenant pool here? Any planned neighborhood developments (good or bad) we should know about?
- What's the average days-on-market for RENTAL listings here right now (not sales)? A rising rental-DOM trend means longer vacancies and softer asking-rent achievability than the comps imply.
- What's the recent tenant-quality profile in this submarket — average credit score on applications, eviction rate, late-payment / NSF rate, and stable-employment percentage? A property-management company in the area should have these aggregated.
- How much new for-sale + rental construction is in the pipeline within 1–3 miles? Heavy new supply typically softens prices + rents 12–24 months out; constrained supply supports both.
Investment metrics
- 1% rule
- 0.89% ✗
- Cap rate
- 6.62%
- Cash-on-cash
- 1.16%
- DSCR
- 1.05
- GRM
- 9.4
CMA / ARV
- ARV (on-the-fly)
- $181,440
- Comps found
- 12
Show comp detail 12 sales within ~0.75 mi
| Address | Dist | Beds/Ba | Sqft | Sold | Price | $/sf | Match |
|---|---|---|---|---|---|---|---|
| 13800 Birrell St | 0.14mi | 3/1.0 | 1,423 (-1%) | 2mo | $139,000 | $98 | 90 |
| 13656 Ward St | 0.24mi | 2/1.0 (-1) | 1,416 (-2%) | 2mo | $155,000 | $109 | 80 |
| 13522 Netherwood St | 0.34mi | 3/1.0 | 1,477 (+3%) | 2mo | $186,000 | $126 | 78 |
| 13683 Callender St | 0.30mi | 3/1.0 | 1,378 (-4%) | 4mo | $185,000 | $134 | 75 |
| 13144 Wesley St | 0.55mi | 3/1.0 | 1,412 (-2%) | 2mo | $184,900 | $131 | 69 |
| 14712 Malcolm St | 0.36mi | 3/1.5 | 1,327 (-8%) | 0mo | $234,999 | $177 | 68 |
| 13105 Oakdale St | 0.58mi | 3/1.5 | 1,474 (+2%) | 1mo | $275,000 | $187 | 66 |
| 13470 Agnes St | 0.52mi | 2/2.0 (-1) | 1,445 (+0%) | 2mo | $165,000 | $114 | 64 |
| 4019 Fordline Rd | 0.61mi | 3/2.0 | 1,386 (-4%) | 2mo | $165,000 | $119 | 60 |
| 2162 Leblanc St | 0.69mi | 3/1.0 | 1,335 (-7%) | 3mo | $135,000 | $101 | 53 |
| 4022 Helen Ave | 0.60mi | 3/2.0 | 1,285 (-11%) | 2mo | $185,000 | $144 | 48 |
| 1835 Ford Blvd | 0.60mi | 2/2.0 (-1) | 1,250 (-13%) | 4mo | $122,500 | $98 | 38 |
Match score weights: distance 35% · size 25% · config 20% · recency 20%. Top-matched comps best support the ARV.
Projected returns pro-forma
-3.0% appreciation · 4.04% rent growth · sell at horizon
- IRR
- -13.3%
- Equity multiple
- 0.52×
- Total profit
- $-27,066
- Equity at exit
- $29,806
- IRR
- -2.9%
- Equity multiple
- 0.80×
- Total profit
- $-11,250
- Equity at exit
- $17,284
Cash invested: $55,972 (down + closing). Projections, not guarantees.
Landlord ↔ Tenant lean methodology
- Overall (STATE)
- 62 Landlord-Friendly
- State Michigan
- 62 Landlord-Friendly · EVEN
- County
- — inherits STATE
- City
- — inherits STATE
ZIP-level market 48195
- Rents YoY
- 4.0%
- Active inventory
- 115
- Price-to-rent
- 9.4×
Monthly cashflow live
- Estimated rent
- $1,774 high interval (Pro) →
- Mortgage (P&I)
- −$1,048
- Tax from tax record
- −$215 /mo · $2,585/yr
- Insurance
- −$83
- HOA
- −$0
- Vacancy / Maint / Mgmt
- −$372
- Net cashflow
- $54
Break-even live
UW: 25.0% down · 7.5% · 30yr · 1.5% tax · 5.0% vac · 8.0% maint · 8.0% mgmt
Financing live
Cash to close
- Down payment
- $49,975
- Closing costs
- $5,997
- Reserves months
- —
- Total cash needed
- —
Loan-product check · same deal, 3 products live
Conventional
25% down · 7.5% · 30yr
- Down + closing
- —
- Monthly P&I
- —
- Monthly cashflow
- —
- DSCR
- —
- Eligible?
- —
Personal DTI + credit; lowest rate.
DSCR
20% down · 8.5% · 30yr
- Down + closing
- —
- Monthly P&I
- —
- Monthly cashflow
- —
- DSCR
- —
- Eligible?
- —
No personal income docs; deal must DSCR.
Hard money
10% down · 12.0% · 12mo
- Down + closing
- —
- Monthly P&I
- —
- Monthly cashflow
- —
- DSCR
- —
- Eligible?
- —
Short-term bridge; refi at stabilization.
Rent comps 11 comps
| Address | Beds | Baths | Sqft | Rent | $/sqft | DOM | Units | Dist |
|---|---|---|---|---|---|---|---|---|
| 4163 Burns Ave Lincoln Park, MI | 3.0 | 1.0 | 900 | $1,500 | $1.67 | 2d | 1 | 0.48mi |
| 11400 Fordline St Allen Park, MI | 1.0–2.0 | 1.0 | 880 | $1,400 | $1.59 | 2d | 1 | 0.63mi |
| 13020 Pullman St Southgate, MI | 4.0 | 1.0 | 1050 | $1,550 | $1.48 | 3d | 1 | 0.67mi |
| 13165 Turnberry Ct Southgate, MI | 2.0 | 2.0 | 1275 | $1,795 | $1.41 | 5d | 1 | 0.71mi |
| 13165 Turnberry Ct Southgate, MI | 2.0 | 2.0 | 1275 | $1,795 | $1.41 | 44d | 1 | 0.71mi |
| 12939 Devoe St Southgate, MI | 3.0 | 1.0 | 1177 | $1,695 | $1.44 | 44d | 1 | 0.86mi |
| 13750 Village Green Blvd Southgate, MI | 1.0–2.0 | 1.0 | 862 | $1,625 | $1.88 | 2d | 9 | 0.96mi |
| 1650 19th St Wyandotte, MI | 3.0 | 2.0 | 1100 | $1,899 | $1.73 | 18d | 1 | 1.05mi |
| 1163 17th St Wyandotte, MI | 3.0 | 1.0 | 1010 | $1,695 | $1.68 | 44d | 1 | 1.20mi |
| 854 Harrison Blvd Lincoln Park, MI | 3.0 | 1.0 | 1410 | $1,750 | $1.24 | 44d | 1 | 1.27mi |
| 13185 Sycamore St Southgate, MI | 3.0 | 1.0 | 1080 | $1,700 | $1.57 | 24d | 1 | 1.31mi |
Listing history 15 events
-
2026-06-18days on market $199,900 Active 18 DOM
-
2026-06-17days on market $199,900 Active 17 DOM
-
2026-06-16days on market $199,900 Active 16 DOM
-
2026-06-15days on market $199,900 Active 15 DOM
-
2026-06-13statusdays on market $199,900 Active 13 DOM
-
2026-06-08statusdays on market $199,900 Pending 11 DOM
-
2026-06-07days on market $199,900 Active 10 DOM
-
2026-06-04days on market $199,900 Active 7 DOM
-
2026-06-03days on market $199,900 Active 6 DOM
-
2026-06-02days on market $199,900 Active 5 DOM
-
2026-06-01days on market $199,900 Active 4 DOM
-
2026-05-31days on market $199,900 Active 3 DOM
-
2026-05-29$199,900 Active 802-char remark
Show marketing remark (802 chars)
Beautifully maintained ranch offering incredible space, character, and functionality throughout. Pride of ownership is evident from the beautifully kept exterior and landscaping to the spacious interior featuring a huge open kitchen and huge addition with dining area, oversized family room with brick accent wall and fireplace, finished basement with additional full bath, and an enormous garage/workshop space perfect for hobbies, storage, or entertaining. Original finishes have been exceptionally cared for, giving you the opportunity to move right in or personalize over time. Additional features include a covered side patio/storage area, vinyl privacy fencing, plenty of storage, and excellent curb appeal. Solid home with great bones and endless potential! Nothing to do here but move right in!
-
2026-05-29$199,900 Active
Show marketing remark (802 chars)
Beautifully maintained ranch offering incredible space, character, and functionality throughout. Pride of ownership is evident from the beautifully kept exterior and landscaping to the spacious interior featuring a huge open kitchen and huge addition with dining area, oversized family room with brick accent wall and fireplace, finished basement with additional full bath, and an enormous garage/workshop space perfect for hobbies, storage, or entertaining. Original finishes have been exceptionally cared for, giving you the opportunity to move right in or personalize over time. Additional features include a covered side patio/storage area, vinyl privacy fencing, plenty of storage, and excellent curb appeal. Solid home with great bones and endless potential! Nothing to do here but move right in!
-
2026-05-28historical $199,900 802-char remark
Show marketing remark (802 chars)
Beautifully maintained ranch offering incredible space, character, and functionality throughout. Pride of ownership is evident from the beautifully kept exterior and landscaping to the spacious interior featuring a huge open kitchen and huge addition with dining area, oversized family room with brick accent wall and fireplace, finished basement with additional full bath, and an enormous garage/workshop space perfect for hobbies, storage, or entertaining. Original finishes have been exceptionally cared for, giving you the opportunity to move right in or personalize over time. Additional features include a covered side patio/storage area, vinyl privacy fencing, plenty of storage, and excellent curb appeal. Solid home with great bones and endless potential! Nothing to do here but move right in!
ⓘ Source: listings_history table (triggers on properties + properties_extension) + one-shot
backfill from property_details.listing_events for pre-trigger history.
Tax reassessment forecast MI · Partial reset (capped growth)
- Current annual tax
- $2,585 · $215/mo
- Projected year-2 tax
- $2,832 · $236/mo
- Expected delta
- +$247/yr (+$21/mo · 9.6%)
ⓘ Screening estimate from a state-policy table — verify with the county assessor before closing.
Climate risk First Street
- Flood 1/10 Low FEMA zone X (unshaded) · 0% chance over 30 yrs
- Wildfire 1/10 Low
- Heat 3/10 Moderate 7 d/yr ≥96°F today · 15 d/yr by 30 yrs out
- Wind 2/10 Low
- Air quality 3/10 Moderate 3 unhealthy d/yr today · 5 by 30 yrs out
Nearby sold comps map
Loading sold comps map…
Walkable amenities ~0.75 mi
Loading nearby amenities…
Taxation est. · year 1
- Rental income
- $21,282
- − Mortgage interest
- −$11,198
- − Property taxes
- −$2,585
- − Insurance
- −$1,000
- − Repairs & maintenance
- −$1,703
- − Management
- −$1,703
- − Depreciation
- −$5,815
- Taxable loss
- −$2,720
- Est. tax savings @ 24.0%
- +$653
- After-tax cash flow
- $1,302/yr
For passive investors: Depreciation is non-cash, so a rental often shows a tax loss while cash-flowing — sheltering income. Rental losses are passive: they offset passive income freely, and up to $25,000/yr can offset ordinary (W-2) income if you actively participate and your MAGI is under $100k (phasing out to $0 by $150k); unused losses carry forward. On sale, claimed depreciation is recaptured at up to 25%, and gains may owe capital-gains tax (a 1031 exchange can defer both). Figures are a year-1 estimate at your 24.0% rate — not tax advice; consult a CPA.
Schools (NCES district)
- District
- Southgate Community School District
- NCES district ID
- 2632340
- Math proficiency
- 21% ▼ -8.00%
- Reading proficiency
- 36% ▬ 0.00%
- Median HH income
- $49,234
- Composite
- 24.83/100
- National rank
- #7591
- State rank
- #379 of 540 in MI
Livability — Southgate
- Score
- 85/100
- State rank
- #29
- US rank
- #582
Category grades
Schools grade is shown separately in the Schools card above.
Census & demographics
- Census place
- Southgate, MI
- County
- Wayne County · 1,562,939 people
- City population
- 29,366
- Metro
- Detroit-Warren-Dearborn, MI
- Population (ZIP)
- 29,366
- Household income
- $66,118
- Rent vs Own
- Severe rent burden
- 727.0
Population outlook (Wayne County) Hauer SSP2
- Today (2025)
- 1,675,273 people
- By 2030
- 1,620,300 · -3.3%
- By 2040
- 1,502,341 · -10.3%
- By 2050
- 1,384,039 · -17.4%
- By 2075
- 1,124,592 · -32.9%
- By 2100
- 881,193 · -47.4%
Race, ethnicity, and origin ACS 2023
- Neighborhood character
- Predominantly White (75%)
- Race & ethnicity
- White 75% Hispanic / Latino 11% Black 8% Two or more races 8% Asian 3%
- Hispanic origin (detail)
- Mexican 8% Puerto Rican 1%
- Common ancestry
- Romanian 9% Lithuanian 3% Slovak 3%
- Foreign-born
- 6% · Canada, China
- Languages at home
- 90% English-only · Other Indo-European 4% Spanish 3% Other Asian/Pacific 1%
Political lean MEDSL · Wayne
- 2024 margin
- Strong D (+29.0) · D 62.7% · R 33.7% · Other 3.6%
- 2008→2024 swing
- -20.5pp toward R · 2008: 49.5pp · 2024: 29.0pp
- All cycles
- 2024: D+29.0 2020: D+38.1 2016: D+37.3 2012: D+46.9 2008: D+49.5
Not yet ingested
- Civics
- —
Market trends
- HPI YoY
- ▼ -187.28%
- Current HPI
- 207.9776
- Rent YoY
- ▲ 4.04%
- Metro
- Detroit-Warren-Dearborn, MI
- State GDP YoY
- ▲ 1.37%
- F500 in state
- 28
Industry mix (Fortune 500 HQ in MI)
| Industry | F500 HQs | Revenue |
|---|---|---|
| Automotive Parts | 3 | $48B |
|
||
| Automotive | 2 | $372B |
|
||
| Chemicals | 1 | $45B |
|
||
| Automotive Retail | 1 | $29B |
|
||
| Healthcare / Medical Devices | 1 | $23B |
|
||
| Automotive Technology | 1 | $20B |
|
||
Price history
+0.0% since first listed3 events — show timeline
- 2026-05-29 Listed $199,900 MiRealSource-MiMLS
- 2026-05-29 Listed $199,900 REALCOMP
- 2026-05-28 Coming Soon $199,900 MiRealSource-MiMLS
Property tax history
+1.2%/yrLatest (2025): $2,585 · -18.0% YoY. Source: county tax records.
Cash-flow waterfall
monthlySold comps — $/sqft
last 12 mo · ≤1 miLoading sold comps…