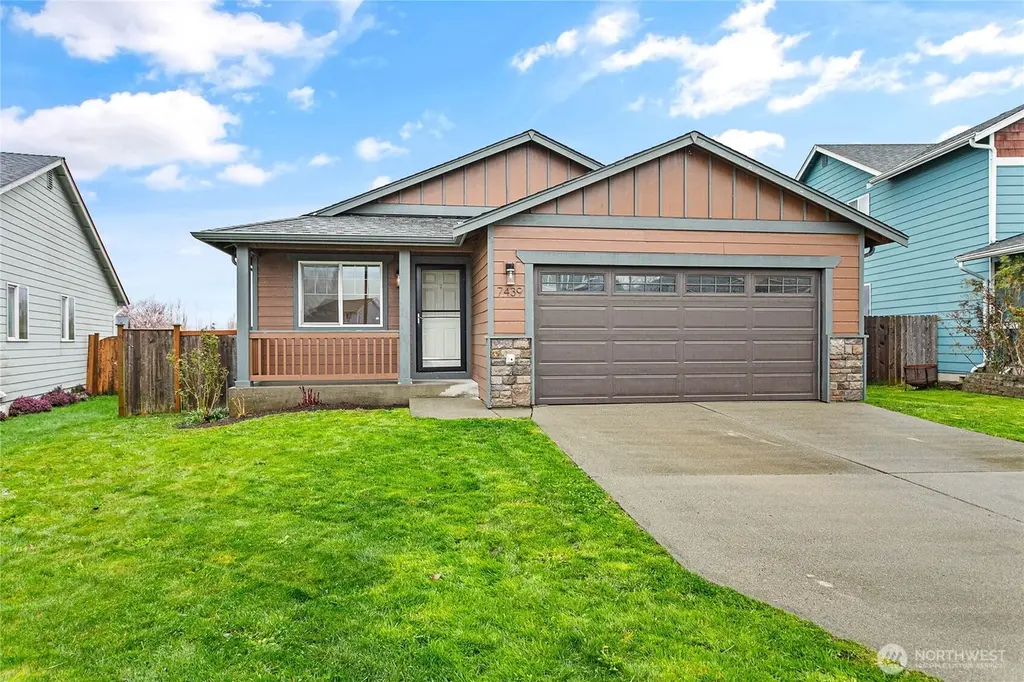
7439 Clamdigger Dr · Birch Bay, WA
Flood risk 1/10 · Minimal
- FEMA flood zone
- X (unshaded)
- Chance of flooding over 30 yrs
- 0.0%
- Est. flood insurance / yr
- $507 – $1,088
Fire risk 3/10 · Minor
- Est. fire insurance / yr
- $604 – $1,122
Heat risk 3/10 · Minor
- Hot days now (above 81°F)
- 8 days/yr
- Hot days in 30 yrs
- 20 days/yr
Wind risk 1/10 · Minimal
- Chance of severe wind over 30 yrs
- —
Air-quality risk 6/10 · Moderate
- Unhealthy air days now
- 7 days/yr
- Unhealthy air days in 30 yrs
- 10 days/yr
Risk factors via First Street. Map © Google.
Why this score? — see what drove the D grade
The composite is a weighted blend of 9 inputs, each scored 0–100. Each bar is that input's sub-score; the figure is the points it added to the 100-point composite (weight × sub-score).
- Appreciation +10.0/10.0
- ARV discount +9.5/15.0
- Cash flow +6.6/30.0
- Schools +4.7/10.0
- Rent growth +3.3/5.0
- Livability +3.1/5.0
- Condition / age +2.5/5.0
- DSCR +0.9/10.0
- 1% rule +0.8/10.0
$425,000
🖨 Deal sheet (PDF) 📄 Offer letter ✓ Due diligence
Listing remarks
Recently updated 3-bedroom, 2-bath home in the desirable Bay Crest South neighborhood of Blaine offers comfortable single-level living at an exceptional starter price. Backing to a greenbelt, this property provides added privacy and a relaxed coastal lifestyle just minutes from Birch Bay. The bright and inviting living room features vaulted ceilings, recessed lighting, and a blend of hardwood and laminate flooring. Recent updates include fresh interior paint, new vinyl flooring, new carpet, and an updated kitchen with brand-new stainless appliances, including a gas range, refrigerator, dishwasher, and microwave. The kitchen flows seamlessly into the dining area with direct access to the bac
Key facts
- Large utility shed
- Updated kitchen
- 5,227 sq ft lot
Tags
Neighborhood map
What this means for you Summary
Snapshot
- This is a 3-bed/2.0-bath single-family listed at $425k.
Deal economics
- At list price, monthly cash flow is $-702 ($-8k/yr) — negative.
- To cash-flow at today's rent, offer at most $301k (29.2% below list).
- To meet the 1% rule (rent ≥ 1% of price), the offer needs to be $248k (41.7% below list).
- Recommended offer: $248k (41.7% below list) — sets the bar for 1% rule.
- Cap rate 4.3% vs local median 2.6% in Birch Bay — top-decile yield for the area; either an underpriced asset or a hidden risk that comps aren't pricing in. Stress-test before assuming the spread holds.
Location & tenants
- Location reads 62/100 on livability (#406 in WA) — a middle-class / working-renter tenant base. Strengths: housing A; Watch: cost of living D+, health & safety D, amenities F.
- Blaine School District (town): math 49% / reading 55% proficiency, ranked #120 of 291 in WA (top 41%) — acceptable for families but not a draw, mixed tenant base, ~2y average lease.
- Zoned schools: Blaine Elementary School (463 students, 54% FRL); Blaine Middle School (459 students, 54% FRL); Blaine High School (609 students, 46% FRL) — zoned schools average 51% FRL vs 33% district-wide (18 pts higher); higher-poverty schools than district average — tighter screening recommended.
- Market conditions: Rents rising (+3.1%/yr); 461 active listings in the ZIP; 1 comparable units currently listed for rent nearby; solid renter incomes; 1,190 units permitted in Whatcom County in 2024 (327 in 5+ unit buildings).
- This rent runs 34% of the median local income ($87k/yr) — at the standard rent-burdened threshold; future hikes will face affordability resistance.
Forward outlook
- In year one you build about $45k of equity ($3k loan paydown + $42k appreciation (10.0% local appreciation)).
- Whatcom County population projected at +28% by 2050 — long-run rental-demand tailwind backs the buy-and-hold thesis.
- By year 2, paydown + projected appreciation supports a ~$73k cash-out refi (75% LTV) — recoverable capital for the next deal without selling this one.
Negotiation context
- It's been on market 93 days — a 9% lower offer ($387k) is reasonable based on typical stale-listing flexibility.
- 4 sale attempts since 21y ago; this cycle's ask has dropped $40k (9%) from the opening price — seller is motivated, your offer sets the floor, not the list.
- Current owner paid $342k; 24% above their basis — modest negotiation headroom, anchor on the comps not their cost.
Questions for the listing agent
- What do current leases actually rent for vs. the listed asking? Can we see a recent rent roll and the last 12 months of T-12 income?
- It's been on market 93 days. Have you received any prior offers? Is the seller open to a 42% concession, seller financing, or rate buy-down credit?
- Why hasn't it sold? Are there any deal-killer items the seller is aware of (foundation, flood, title, zoning, code violations)?
- Is there a deadline driving the sale (1031 exchange, divorce, estate, relocation)? That informs how much negotiation room exists.
- Schools are F-rated, which usually means shorter tenancies and higher turnover. Who's the typical renter profile here, and what's been the actual vacancy rate?
- The area grade is low — what's the realistic commute time and amenity access for the typical tenant pool here? Any planned neighborhood developments (good or bad) we should know about?
- What's the average days-on-market for RENTAL listings here right now (not sales)? A rising rental-DOM trend means longer vacancies and softer asking-rent achievability than the comps imply.
- What's the recent tenant-quality profile in this submarket — average credit score on applications, eviction rate, late-payment / NSF rate, and stable-employment percentage? A property-management company in the area should have these aggregated.
- How much new for-sale + rental construction is in the pipeline within 1–3 miles? Heavy new supply typically softens prices + rents 12–24 months out; constrained supply supports both.
Investment metrics
- 1% rule
- 0.58% ✗
- Cap rate
- 4.31%
- Cash-on-cash
- -7.08%
- DSCR
- 0.69
- GRM
- 14.3
CMA / ARV
- ARV (median comp)
- $445,213
- List price
- $425,000
- Delta
- -4.54%
- Verdict
- FAIR
- Comps
- 20 within 1.0 mi
Show comp detail 12 sales within ~0.75 mi
| Address | Dist | Beds/Ba | Sqft | Sold | Price | $/sf | Match |
|---|---|---|---|---|---|---|---|
| 4728 Rock Crab Dr | 0.18mi | 3/2.0 | 1,014 (0%) | 2mo | $445,000 | $439 | 90 |
| 7514 Seashell Way | 0.09mi | 3/2.0 | 1,014 (0%) | 9mo | $440,500 | $434 | 88 |
| 7334 Yellow Fin Ct | 0.28mi | 3/2.0 | 1,014 (0%) | 3mo | $454,500 | $448 | 85 |
| 7337 Yellow Fin Ct | 0.25mi | 2/2.0 (-1) | 1,014 (0%) | 1mo | $460,000 | $454 | 82 |
| 7482 Sole Dr | 0.17mi | 3/2.0 | 1,014 (0%) | 12mo | $410,000 | $404 | 82 |
| 7379 Yellow Fin Ct | 0.16mi | 3/2.0 | 1,014 (0%) | 13mo | $449,000 | $443 | 81 |
| 4836 Willow Dr | 0.38mi | 3/1.5 | 1,064 (+5%) | 1mo | $435,000 | $409 | 72 |
| 4656 Bay Rd | 0.41mi | 3/1.0 | 1,068 (+5%) | 9mo | $875,000 | $819 | 60 |
| 7417 Birch Bay Dr | 0.46mi | 3/1.5 | 1,116 (+10%) | 1mo | $915,000 | $820 | 59 |
| 7567 Morrison Ave | 0.40mi | 3/1.5 | 1,092 (+8%) | 14mo | $429,000 | $393 | 55 |
| 7315 Jackson Rd | 0.49mi | 2/1.0 (-1) | 1,050 (+4%) | 13mo | $515,000 | $490 | 52 |
| 7631 Parkland Dr | 0.51mi | 2/1.0 (-1) | 1,156 (+14%) | 3mo | $415,000 | $359 | 41 |
Match score weights: distance 35% · size 25% · config 20% · recency 20%. Top-matched comps best support the ARV.
Projected returns pro-forma
10.0% appreciation · 3.1% rent growth · sell at horizon
- IRR
- 19.3%
- Equity multiple
- 2.57×
- Total profit
- $186,871
- Equity at exit
- $382,874
- IRR
- 17.8%
- Equity multiple
- 5.92×
- Total profit
- $585,708
- Equity at exit
- $825,682
Cash invested: $119,000 (down + closing). Projections, not guarantees.
Landlord ↔ Tenant lean methodology
- Overall (STATE)
- 28 Tenant-Leaning
- State Washington
- 28 Tenant-Leaning · D+8
- County
- — inherits STATE
- City
- — inherits STATE
ZIP-level market 98230
- Home prices YoY
- 14.0%
- Rents YoY
- 3.1%
- Active inventory
- 461
- Price-to-rent
- 14.3×
Monthly cashflow live
- Estimated rent
- $2,478 medium interval (Pro) →
- Mortgage (P&I)
- −$2,229
- Tax from tax record
- −$254 /mo · $3,044/yr
- Insurance
- −$177
- HOA
- −$0
- Vacancy / Maint / Mgmt
- −$520
- Net cashflow
- $-702
Break-even live
Sensitivity live
| Price | -10% $-461 | -5% $-582 | +0% $-702 | +5% $-822 | +10% $-943 |
|---|---|---|---|---|---|
| Rent | -10% $-898 | -5% $-800 | +0% $-702 | +5% $-604 | +10% $-506 |
| Rate | -1.0pp $-488 | -0.5pp $-594 | base $-702 | +0.5pp $-812 | +1.0pp $-924 |
UW: 25.0% down · 7.5% · 30yr · 1.5% tax · 5.0% vac · 8.0% maint · 8.0% mgmt
Financing live
Cash to close
- Down payment
- $106,250
- Closing costs
- $12,750
- Reserves months
- —
- Total cash needed
- —
Loan-product check · same deal, 3 products live
Conventional
25% down · 7.5% · 30yr
- Down + closing
- —
- Monthly P&I
- —
- Monthly cashflow
- —
- DSCR
- —
- Eligible?
- —
Personal DTI + credit; lowest rate.
DSCR
20% down · 8.5% · 30yr
- Down + closing
- —
- Monthly P&I
- —
- Monthly cashflow
- —
- DSCR
- —
- Eligible?
- —
No personal income docs; deal must DSCR.
Hard money
10% down · 12.0% · 12mo
- Down + closing
- —
- Monthly P&I
- —
- Monthly cashflow
- —
- DSCR
- —
- Eligible?
- —
Short-term bridge; refi at stabilization.
Rent comps 1 comps
| Address | Beds | Baths | Sqft | Rent | $/sqft | DOM | Units | Dist |
|---|---|---|---|---|---|---|---|---|
| 7650 Birch Bay Dr Blaine, WA | 3.0 | 1.5 | 1036 | $2,175 | $2.10 | 15d | 1 | 0.51mi |
Listing history 29 events
-
2026-06-21days on market $425,000 Active 93 DOM
-
2026-06-18days on market $425,000 Active 90 DOM
-
2026-06-17days on market $425,000 Active 89 DOM
-
2026-06-16days on market $425,000 Active 88 DOM
-
2026-06-15days on market $425,000 Active 87 DOM
-
2026-06-14days on market $425,000 Active 85 DOM
-
2026-06-13days on market $425,000 Active 84 DOM
-
2026-06-10days on market $425,000 Active 82 DOM
-
2026-06-09days on market $425,000 Active 81 DOM
-
2026-06-08days on market $425,000 Active 80 DOM
-
2026-06-07pricedays on market $425,000 Active 79 DOM
-
2026-06-05days on market $435,000 Active 76 DOM
-
2026-06-02days on market $435,000 Active 74 DOM
-
2026-06-01days on market $435,000 Active 73 DOM
-
2026-05-31days on market $435,000 Active 72 DOM
-
2026-05-30days on market $435,000 Active 71 DOM
-
2026-04-24price $435,000
-
2026-03-23price $449,500
-
2026-03-20$465,000 Active
-
2020-11-10soldstatus $342,500 Sold
-
2020-09-29status Pending Inspection
-
2020-09-25$325,000 Active
-
2013-11-15soldstatus $176,500 Sold
-
2013-11-14soldstatus $176,500
-
2013-09-09status Pending
-
2013-07-23$183,000 Active
-
2006-09-21soldstatus $190,000
-
2005-09-29soldstatus $200,950
-
2005-07-14$200,950
ⓘ Source: listings_history table (triggers on properties + properties_extension) + one-shot
backfill from property_details.listing_events for pre-trigger history.
Tax reassessment forecast WA · Resets to sale price
- Current annual tax
- $3,044 · $254/mo
- Projected year-2 tax
- $4,165 · $347/mo
- Expected delta
- +$1,121/yr (+$93/mo · 36.8%)
ⓘ Screening estimate from a state-policy table — verify with the county assessor before closing.
Climate risk First Street
- Flood 1/10 Low FEMA zone X (unshaded) · 0% chance over 30 yrs
- Wildfire 3/10 Moderate
- Heat 3/10 Moderate 8 d/yr ≥81°F today · 20 d/yr by 30 yrs out
- Wind 1/10 Low
- Air quality 6/10 Major 7 unhealthy d/yr today · 10 by 30 yrs out
Nearby sold comps map
Loading sold comps map…
Walkable amenities ~0.75 mi
Loading nearby amenities…
Taxation est. · year 1
- Rental income
- $29,733
- − Mortgage interest
- −$23,807
- − Property taxes
- −$3,044
- − Insurance
- −$2,125
- − Repairs & maintenance
- −$2,379
- − Management
- −$2,379
- − Depreciation
- −$12,364
- Taxable loss
- −$16,363
- Est. tax savings @ 24.0%
- +$3,927
- After-tax cash flow
- $-4,497/yr
For passive investors: Depreciation is non-cash, so a rental often shows a tax loss while cash-flowing — sheltering income. Rental losses are passive: they offset passive income freely, and up to $25,000/yr can offset ordinary (W-2) income if you actively participate and your MAGI is under $100k (phasing out to $0 by $150k); unused losses carry forward. On sale, claimed depreciation is recaptured at up to 25%, and gains may owe capital-gains tax (a 1031 exchange can defer both). Figures are a year-1 estimate at your 24.0% rate — not tax advice; consult a CPA.
Schools (NCES district)
- District
- Blaine School District
- NCES district ID
- 5300570
- Math proficiency
- 49% ▼ -1.00%
- Reading proficiency
- 55% ▼ -2.00%
- Median HH income
- $57,085
- Composite
- 47.05/100
- National rank
- #5128
- State rank
- #120 of 291 in WA
Livability — Birch Bay
- Score
- 62/100
- State rank
- #406
- US rank
- #16180
Category grades
Schools grade is shown separately in the Schools card above.
Census & demographics
- Census place
- Birch Bay, WA
- County
- Whatcom County · 209,776 people
- Metro
- Bellingham, WA
- Population (ZIP)
- 18,744
- Household income
- $86,623
- Rent vs Own
- Severe rent burden
- 454.0
Population outlook (Whatcom County) Hauer SSP2
- Today (2025)
- 240,408 people
- By 2030
- 254,667 · +5.9%
- By 2040
- 281,365 · +17.0%
- By 2050
- 307,592 · +27.9%
- By 2075
- 375,576 · +56.2%
- By 2100
- 421,637 · +75.4%
Race, ethnicity, and origin ACS 2023
- Neighborhood character
- Predominantly White (77%)
- Race & ethnicity
- White 77% Two or more races 11% Hispanic / Latino 9% Asian 3% Pacific Islander 2% Black 1%
- Hispanic origin (detail)
- Mexican 5%
- Common ancestry
- Portuguese 6% Iranian 4% Lithuanian 3%
- Foreign-born
- 13% · Canada, China
- Languages at home
- 89% English-only · Spanish 4% Russian/Polish/Slavic 1% Other Indo-European 1%
Political lean MEDSL · Whatcom
- 2024 margin
- Strong D (+24.9) · D 60.8% · R 35.9% · Other 3.3%
- 2008→2024 swing
- +6.9pp toward D · 2008: 18.0pp · 2024: 24.9pp
- All cycles
- 2024: D+24.9 2020: D+23.9 2016: D+17.7 2012: D+12.1 2008: D+18.0
Not yet ingested
- Civics
- —
Market trends
- HPI YoY
- ▲ 106.58%
- Current HPI
- 868.68
- Rent YoY
- ▲ 3.10%
- Metro
- Bellingham, WA
- State GDP YoY
- ▲ 4.65%
- F500 in state
- 22
Industry mix (Fortune 500 HQ in WA)
| Industry | F500 HQs | Revenue |
|---|---|---|
| Retail | 2 | $269B |
|
||
| Technology / Retail | 1 | $638B |
|
||
| Technology | 1 | $245B |
|
||
| Telecommunications | 1 | $38B |
|
||
| Food / Beverage | 1 | $36B |
|
||
| Automotive / Trucks | 1 | $34B |
|
||
Price history
+116.5% since first listed13 events — show timeline
- 2026-04-24 Price Changed $435,000 NWMLS as Distributed by MLS Grid
- 2026-03-23 Price Changed $449,500 NWMLS as Distributed by MLS Grid
- 2026-03-20 Listed $465,000 NWMLS as Distributed by MLS Grid
- 2020-11-10 Sold (MLS) $342,500 NWMLS as Distributed by MLS Grid
- 2020-09-29 Pending — NWMLS as Distributed by MLS Grid
- 2020-09-25 Listed $325,000 NWMLS as Distributed by MLS Grid
- 2013-11-15 Sold (MLS) $176,500 NWMLS as Distributed by MLS Grid
- 2013-11-14 Sold (Public Records) $176,500 Public Records
- 2013-09-09 Pending — NWMLS as Distributed by MLS Grid
- 2013-07-23 Listed $183,000 NWMLS as Distributed by MLS Grid
- 2006-09-21 Sold (Public Records) $190,000 Public Records
- 2005-09-29 Sold (MLS) $200,950 NWMLS as Distributed by MLS Grid
- 2005-07-14 Listed $200,950 NWMLS as Distributed by MLS Grid
Property tax history
+4.2%/yrLatest (2026): $3,044 · +2.0% YoY. Source: county tax records.
Cash-flow waterfall
monthlySold comps — $/sqft
last 12 mo · ≤1 miLoading sold comps…