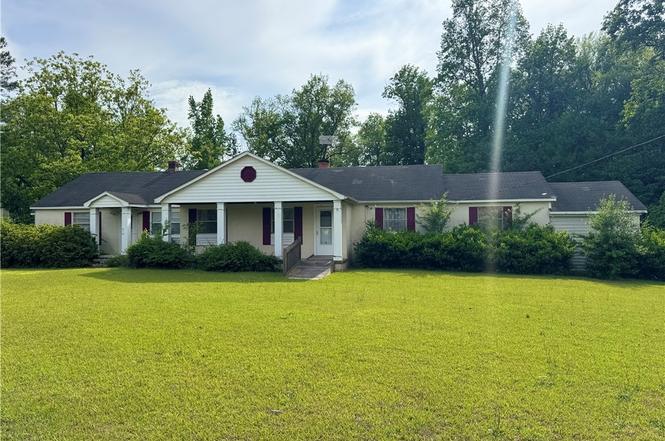
170 South River Rd · Autryville, NC
Flood risk 1/10 · Minimal
- FEMA flood zone
- X (unshaded)
- Chance of flooding over 30 yrs
- 0.0%
- Est. flood insurance / yr
- $507 – $1,088
Fire risk 3/10 · Minor
- Est. fire insurance / yr
- $906 – $1,684
Heat risk 7/10 · Major
- Hot days now (above 105°F)
- 7 days/yr
- Hot days in 30 yrs
- 16 days/yr
Wind risk 8/10 · Major
- Chance of severe wind over 30 yrs
- 80.0%
Air-quality risk 1/10 · Minimal
- Unhealthy air days now
- 0 days/yr
- Unhealthy air days in 30 yrs
- 0 days/yr
Risk factors via First Street. Map © Google.
Why this score? — see what drove the C- grade
The composite is a weighted blend of 9 inputs, each scored 0–100. Each bar is that input's sub-score; the figure is the points it added to the 100-point composite (weight × sub-score).
- Cash flow +17.1/30.0
- ARV discount +7.5/15.0
- Appreciation +6.1/10.0
- DSCR +5.3/10.0
- 1% rule +4.0/10.0
- Schools +3.4/10.0
- Livability +2.9/5.0
- Rent growth +2.5/5.0
- Condition / age +2.5/5.0
$175,000
🖨 Deal sheet 📄 Offer letter ✓ Due diligence
Listing remarks
* * * * PRICE REDUCED * * * * THIS HOME IS SITUATED ON 5 ACRES OF BEAUTIFUL PPROPERTY. LOCATED JUST OUTSIDE OF TOWN WITH A QUITE COUNTRY FEEL BUT STILL CLOSE ENOUGH TO FAYETTEVILLE AND FORT BRAGG FOR EASY COMMUTE AND SHOPPINF. ON THE PROPERTY THERE IS AN ORCHARD WITH APPLE AND PEACH TREES, AS WELL AS AN ESTABLISHED GRAPE ARBOR. YOU WILL ALSO FIND A GREEN HOUSE, SHEDS AND OTHER STORAGE FACILITIES. THE HOME WAS BUILT BY THE CURRENT OWNERS PARENTS AND WAS HER CHILHOOD HOME. THE HOME IS BEING OFFERED * * AS IS * * THIS PROPERTY WAS A LIFE ESTATE THAT PASSED TO THE OWNER AS THE VESTED REMAINDER. THEREFORE THE OWNER HAS NOT LIVED IN THE HOME FOR DECADES. IT NEEDS EXTENSIVE REMODLING AND
Key facts
- 2 parking spots
- Built 1952
- Listed 231 days
Property features AI
Exterior
- Parking: 2 covered spaces; 2-car carport
- Utilities: Water from spring and well; Holding tank and septic tank sewer
- Home design: Single-family residence; One story; Level lot; Wooded setting; Zoned RA-20 (Residential Agricultural)
- Construction: Block construction
- Exterior features: Covered rear porch; Porch
Interior
- Kitchen: Range; Refrigerator
- Flooring: Hardwood; Tile; Carpet
- Bathrooms: 2 full bathrooms
- Heating & cooling: Wood stove heating; Window unit cooling
- Interior features: Storage; One fireplace (other style)
Neighborhood map
What this means for you Summary
Snapshot
- This is a 3-bed/2.0-bath single-family listed at $175k.
Deal economics
- At list price, monthly cash flow is $123 ($1k/yr) — positive.
- The deal already cash-flows at list — no discount required.
- To meet the 1% rule (rent ≥ 1% of price), the offer needs to be $158k (9.8% below list).
- Recommended offer: $154k (12.0% below list) — sets the bar for market timing.
Location & tenants
- Location reads 57/100 on livability (#592 in NC) — a working-class tenant base; expect higher turnover. Strengths: cost of living A+, housing B; Watch: crime F, amenities F, commute F.
- Sampson County Schools (rural): math 40% / reading 41% proficiency, ranked #114 of 178 in NC (top 64%) — families likely to look elsewhere, expect single-tenant / working-renter base with shorter leases; 74% free/reduced lunch — lower-income household profile, screen leases tightly.
- Zoned schools: Midway Middle (math 52% / reading 48%, grade C, #113 of 475 statewide, top 25%, 550 students, 100% FRL); Midway High (math 82% / reading 42%, grade B-, #184 of 535 statewide, top 37%, 757 students, 100% FRL) — zoned schools average 100% FRL vs 74% district-wide (26 pts higher); higher-poverty schools than district average — tighter screening recommended.
- Zoned-school proficiency averages 56% at this address vs 40% district-wide (+16 pts) — the actual schools serving this property are materially stronger than the Sampson County Schools average implies; a family-tenant draw the district grade alone would hide.
- Market conditions: 43 active listings in the ZIP; 189 units permitted in Sampson County in 2024 (0 in 5+ unit buildings).
Forward outlook
- In year one you build about $5k of equity ($1k loan paydown + $4k appreciation (2.2% local appreciation)).
- Sampson County population projected to shrink 5% by 2050 — rents likely to lag national; underwrite the cash flow, not the appreciation.
- At projected returns (2.2% appreciation + 3.0% rent growth), your $49k cash investment doubles in ~7 years — after that, you're playing with house money.
- By year 7, paydown + projected appreciation supports a ~$32k cash-out refi (75% LTV) — recoverable capital for the next deal without selling this one.
Negotiation context
- It's been on market 231 days — a 12% lower offer ($154k) is reasonable based on typical stale-listing flexibility.
- 3 sale attempts; this cycle's ask has dropped $45k (20%) from the opening price — seller is motivated, your offer sets the floor, not the list.
Risks & watch-outs
- Watch-outs: built in 1952 — expect roof / HVAC / electrical / plumbing capex.
- Climate carrying-cost: severe wind risk, 80% chance of damaging wind over 30y; extreme-heat days projected 7→16/yr by 2055 (HVAC capex compounding) — expect insurance premiums to compound above CPI over the hold.
Questions for the listing agent
- It's been on market 231 days. Have you received any prior offers? Is the seller open to a 12% concession, seller financing, or rate buy-down credit?
- Built in 1952 — when were the roof, HVAC, electrical panel, plumbing, and water heater last replaced?
- Why hasn't it sold? Are there any deal-killer items the seller is aware of (foundation, flood, title, zoning, code violations)?
- Is there a deadline driving the sale (1031 exchange, divorce, estate, relocation)? That informs how much negotiation room exists.
- Crime grade is F in this area — have there been break-ins, vandalism, or insurance claims at this property in the last 3 years? What carrier currently insures it and at what premium?
- What's the average days-on-market for RENTAL listings here right now (not sales)? A rising rental-DOM trend means longer vacancies and softer asking-rent achievability than the comps imply.
- What's the recent tenant-quality profile in this submarket — average credit score on applications, eviction rate, late-payment / NSF rate, and stable-employment percentage? A property-management company in the area should have these aggregated.
- How much new for-sale + rental construction is in the pipeline within 1–3 miles? Heavy new supply typically softens prices + rents 12–24 months out; constrained supply supports both.
Investment metrics
- 1% rule
- 0.90% ✗
- Cap rate
- 7.14%
- Cash-on-cash
- 3.01%
- DSCR
- 1.13
- GRM
- 9.2
CMA / ARV
No comps found within radius.
Projected returns pro-forma
2.21% appreciation · 3.0% rent growth · sell at horizon
- IRR
- 8.1%
- Equity multiple
- 1.44×
- Total profit
- $21,655
- Equity at exit
- $71,004
- IRR
- 11.2%
- Equity multiple
- 2.54×
- Total profit
- $75,395
- Equity at exit
- $103,789
Cash invested: $49,000 (down + closing). Projections, not guarantees.
Landlord ↔ Tenant lean methodology
- Overall (STATE)
- 85 Strongly Landlord-Friendly
- State North Carolina
- 85 Strongly Landlord-Friendly · R+3
- County
- — inherits STATE
- City
- — inherits STATE
ZIP-level market 28318
- Home prices YoY
- 0.8%
- Active inventory
- 43
- Price-to-rent
- 9.2×
Monthly cashflow live
- Estimated rent
- $1,578 medium interval (Pro) →
- Mortgage (P&I)
- −$918
- Tax from tax record
- −$133 /mo · $1,601/yr
- Insurance
- −$73
- HOA
- −$0
- Vacancy / Maint / Mgmt
- −$331
- Net cashflow
- $123
Break-even live
UW: 25.0% down · 7.5% · 30yr · 1.5% tax · 5.0% vac · 8.0% maint · 8.0% mgmt
Financing live
Cash to close
- Down payment
- $43,750
- Closing costs
- $5,250
- Reserves months
- —
- Total cash needed
- —
Loan-product check · same deal, 3 products live
Conventional
25% down · 7.5% · 30yr
- Down + closing
- —
- Monthly P&I
- —
- Monthly cashflow
- —
- DSCR
- —
- Eligible?
- —
Personal DTI + credit; lowest rate.
DSCR
20% down · 8.5% · 30yr
- Down + closing
- —
- Monthly P&I
- —
- Monthly cashflow
- —
- DSCR
- —
- Eligible?
- —
No personal income docs; deal must DSCR.
Hard money
10% down · 12.0% · 12mo
- Down + closing
- —
- Monthly P&I
- —
- Monthly cashflow
- —
- DSCR
- —
- Eligible?
- —
Short-term bridge; refi at stabilization.
Listing history 22 events
-
2026-06-18days on market $175,000 Active 231 DOM
-
2026-06-17days on market $175,000 Active 230 DOM
-
2026-06-16days on market $175,000 Active 229 DOM
-
2026-06-15days on market $175,000 Active 228 DOM
-
2026-06-14days on market $175,000 Active 226 DOM
-
2026-06-13days on market $175,000 Active 225 DOM
-
2026-06-10days on market $175,000 Active 223 DOM
-
2026-06-09days on market $175,000 Active 222 DOM
-
2026-06-08days on market $175,000 Active 221 DOM
-
2026-06-07days on market $175,000 Active 220 DOM
-
2026-06-05days on market $175,000 Active 217 DOM
-
2026-06-03days on market $175,000 Active 216 DOM
-
2026-06-02days on market $175,000 Active 215 DOM
-
2026-06-01days on market $175,000 Active 214 DOM
-
2026-05-31days on market $175,000 Active 213 DOM
-
2026-05-30days on market $175,000 Active 212 DOM
-
2026-04-13status Active
-
2026-04-13price $190,000
-
2026-03-27status Pending
-
2026-01-23price $200,000
-
2026-01-23status Active
-
2025-09-21$220,000 Active
ⓘ Source: listings_history table (triggers on properties + properties_extension) + one-shot
backfill from property_details.listing_events for pre-trigger history.
Tax reassessment forecast NC · Resets to sale price
- Current annual tax
- $1,601 · $133/mo
- Projected year-2 tax
- $1,601 · $133/mo
- Expected delta
- $0/yr ($0/mo · 0.0%)
ⓘ Screening estimate from a state-policy table — verify with the county assessor before closing.
Climate risk First Street
- Flood 1/10 Low FEMA zone X (unshaded) · 0% chance over 30 yrs
- Wildfire 3/10 Moderate
- Heat 7/10 Severe 7 d/yr ≥105°F today · 16 d/yr by 30 yrs out
- Wind 8/10 Severe 80% chance of damaging wind over 30 yrs
- Air quality 1/10 Low 0 unhealthy d/yr today · 0 by 30 yrs out
Nearby sold comps map
Loading sold comps map…
Walkable amenities ~0.75 mi
Loading nearby amenities…
Taxation est. · year 1
- Rental income
- $18,940
- − Mortgage interest
- −$9,803
- − Property taxes
- −$1,601
- − Insurance
- −$875
- − Repairs & maintenance
- −$1,515
- − Management
- −$1,515
- − Depreciation
- −$5,091
- Taxable loss
- −$1,460
- Est. tax savings @ 24.0%
- +$350
- After-tax cash flow
- $1,825/yr
For passive investors: Depreciation is non-cash, so a rental often shows a tax loss while cash-flowing — sheltering income. Rental losses are passive: they offset passive income freely, and up to $25,000/yr can offset ordinary (W-2) income if you actively participate and your MAGI is under $100k (phasing out to $0 by $150k); unused losses carry forward. On sale, claimed depreciation is recaptured at up to 25%, and gains may owe capital-gains tax (a 1031 exchange can defer both). Figures are a year-1 estimate at your 24.0% rate — not tax advice; consult a CPA.
Schools (NCES district)
- District
- Sampson County Schools
- NCES district ID
- 3704140
- Math proficiency
- 40% ▼ -6.00%
- Reading proficiency
- 41% ▼ -6.00%
- Median HH income
- $37,391
- Composite
- 33.71/100
- National rank
- #5379
- State rank
- #114 of 178 in NC
Livability — Autryville
- Score
- 57/100
- State rank
- #592
- US rank
- #21630
Category grades
Schools grade is shown separately in the Schools card above.
Census & demographics
- Population (ZIP)
- 4,303
Population outlook (Sampson County) Hauer SSP2
- Today (2025)
- 63,499 people
- By 2030
- 62,970 · -0.8%
- By 2040
- 61,609 · -3.0%
- By 2050
- 60,462 · -4.8%
- By 2075
- 60,108 · -5.3%
- By 2100
- 62,120 · -2.2%
Race, ethnicity, and origin ACS 2023
- Neighborhood character
- Predominantly White (69%)
- Race & ethnicity
- White 69% Black 12% Hispanic / Latino 12% Two or more races 2% Asian 2% Native American 1%
- Hispanic origin (detail)
- Mexican 9%
- Common ancestry
- Slovak 2% Serbian 1% Italian 1%
- Foreign-born
- 4% · Canada, China
- Languages at home
- 92% English-only · Spanish 5% Korean 2% Chinese 1%
Political lean MEDSL · Sampson
- 2024 margin
- Strong R (+29.8) · D 34.8% · R 64.6%
- 2008→2024 swing
- -21.3pp toward R · 2008: -8.4pp · 2024: -29.8pp
- All cycles
- 2024: R+29.8 2020: R+22.5 2016: R+16.7 2012: R+11.0 2008: R+8.4
Not yet ingested
- Civics
- —
Market trends
- HPI YoY
- ▲ 2.21%
- Current HPI
- 263.6889
- Rent YoY
- —
- Metro
- —
- State GDP YoY
- ▲ 3.28%
- F500 in state
- 26
Industry mix (Fortune 500 HQ in NC)
| Industry | F500 HQs | Revenue |
|---|---|---|
| Financial Services | 2 | $213B |
|
||
| Retail | 2 | $95B |
|
||
| Industrial Conglomerate | 1 | $38B |
|
||
| Metals / Steel | 1 | $35B |
|
||
| Utilities | 1 | $30B |
|
||
| Industrial Machinery | 1 | $19B |
|
||
Price history
-13.6% since first listed6 events — show timeline
- 2026-04-13 Relisted — LPRMLS
- 2026-04-13 Price Changed $190,000 LPRMLS
- 2026-03-27 Pending — LPRMLS
- 2026-01-23 Price Changed $200,000 LPRMLS
- 2026-01-23 Relisted — LPRMLS
- 2025-09-21 Listed $220,000 LPRMLS
Property tax history
+5.1%/yrLatest (2025): $1,601 · +10.6% YoY. Source: county tax records.
Cash-flow waterfall
monthlySold comps — $/sqft
last 12 mo · ≤1 miLoading sold comps…