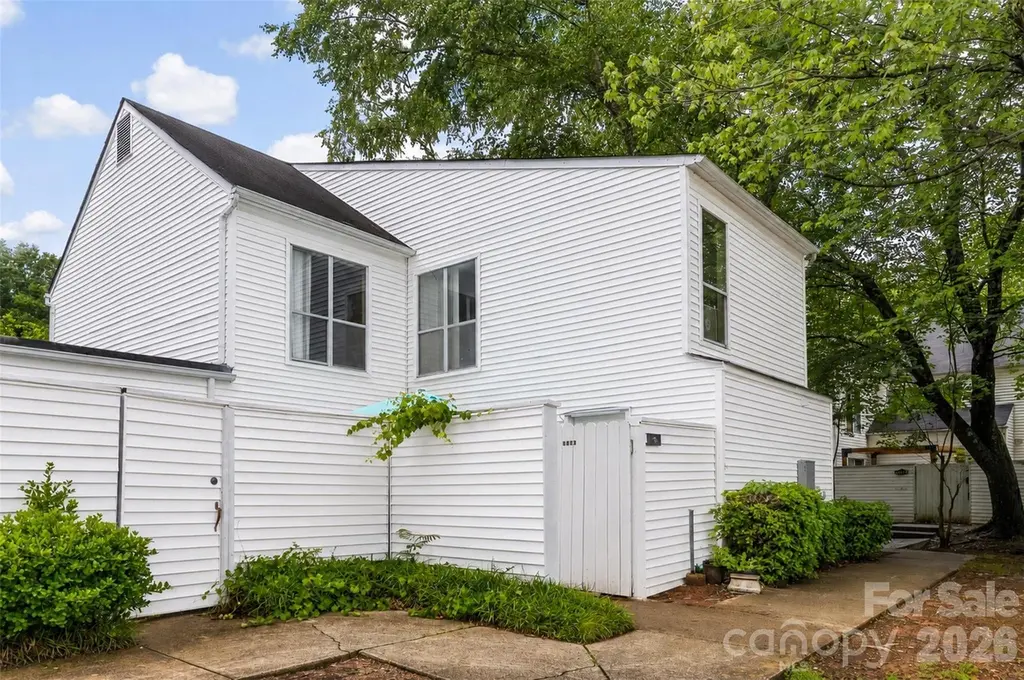
7130 Stonington Ln · Charlotte, NC
Flood risk 1/10 · Minimal
- FEMA flood zone
- X (unshaded)
- Chance of flooding over 30 yrs
- 0.0%
- Est. flood insurance / yr
- $507 – $1,088
Fire risk 1/10 · Minimal
- Est. fire insurance / yr
- $906 – $1,684
Heat risk 6/10 · Moderate
- Hot days now (above 104°F)
- 7 days/yr
- Hot days in 30 yrs
- 17 days/yr
Wind risk 6/10 · Moderate
- Chance of severe wind over 30 yrs
- 27.0%
Air-quality risk 3/10 · Minor
- Unhealthy air days now
- 3 days/yr
- Unhealthy air days in 30 yrs
- 4 days/yr
Risk factors via First Street. Map © Google.
Why this score? — see what drove the D- grade
The composite is a weighted blend of 9 inputs, each scored 0–100. Each bar is that input's sub-score; the figure is the points it added to the 100-point composite (weight × sub-score).
- Cash flow +12.3/30.0
- ARV discount +5.0/15.0
- Livability +3.9/5.0
- 1% rule +3.8/10.0
- Schools +3.8/10.0
- DSCR +3.6/10.0
- Rent growth +3.2/5.0
- Condition / age +2.5/5.0
- Appreciation +0.0/10.0
$179,000
🖨 Deal sheet 📄 Offer letter ✓ Due diligence
Listing remarks MLS
Ready for move in! New carpet, fresh paint and more. Corner end unit with outside storage/ patio. Buyers, call list agent for private showing and more details.
Key facts
- Bright kitchen
- Spacious living area
- Convenient half bath
Tags
Property features AI
Finance
- HOA & community: HOA present; membership mandatory; Monthly association fee of $192
Exterior
- Parking: Driveway
- Utilities: City water; Public sewer
- Home design: Residential townhouse; Site-built construction; Two levels; Entry level: 1
- Construction: Vinyl exterior; Slab foundation
- Exterior features: Roads are asphalt and paved; Road responsibility: Other — see remarks
Interior
- Kitchen: Dishwasher; Refrigerator
- Bedrooms: Two bedrooms located on the upper level
- Bathrooms: One full bathroom (upper level); One half bathroom (main level)
- Heating & cooling: Central heating; Central air conditioning
- Interior features: Six total rooms; Entry level is 1
- Laundry & utility: Laundry located in hall; Laundry closet
Neighborhood map
What this means for you Summary
Snapshot
- This is a 2-bed/1.5-bath townhouse listed at $179k.
Deal economics
- At list price, monthly cash flow is $-34 ($-407/yr) — negative.
- To cash-flow at today's rent, offer at most $173k (3.3% below list).
- To meet the 1% rule (rent ≥ 1% of price), the offer needs to be $157k (12.3% below list).
- Recommended offer: $157k (12.3% below list) — sets the bar for 1% rule.
- Cap rate 6.1% vs local median 3.1% in Charlotte — top-decile yield for the area; either an underpriced asset or a hidden risk that comps aren't pricing in. Stress-test before assuming the spread holds.
Location & tenants
- Location reads 78/100 on livability (#26 in NC, #2,502 nationally) — a middle-class / working-renter tenant base. Strengths: amenities A+, commute A+, housing A+; Watch: crime F.
- Charlotte-Mecklenburg Schools (urban): math 42% / reading 46% proficiency, ranked #85 of 178 in NC (top 48%) — families likely to look elsewhere, expect single-tenant / working-renter base with shorter leases.
- Zoned schools: Albemarle Road Elementary (math 22% / reading 16%, grade F, #1,269 of 1,410 statewide, top 91%, 755 students, 98% FRL); Independence High School (math 65% / reading 54%, grade C+, #216 of 535 statewide, top 43%, 2,022 students, 42% FRL) — zoned schools average 70% FRL vs 49% district-wide (21 pts higher); higher-poverty schools than district average — tighter screening recommended.
- Market conditions: Rents rising (+2.7%/yr); 375 active listings in the ZIP; 40 comparable units currently listed for rent nearby; rentals at typical pace (median 16d on market — plan ~3-4 weeks tenant-placement turnaround); solid renter incomes; 11,969 units permitted in Mecklenburg County in 2024 (5,377 in 5+ unit buildings).
Forward outlook
- Local home prices are declining (-3.0%/yr); year-one equity from $1k of loan paydown is wiped out by about $5k of value loss. Plan a longer hold.
- Mecklenburg County population projected at +53% by 2050 — long-run rental-demand tailwind backs the buy-and-hold thesis.
Negotiation context
- It's been on market 21 days — a 2% lower offer ($176k) is reasonable based on typical stale-listing flexibility.
- 2 sale attempts since 8y ago with the ask held roughly flat each time — persistent listings suggest the price (not the market) is what's stuck; bring a comps-based counter.
- Current owner paid $75k; list at $179k implies a 139% gain — meaningful room to come down on a strong offer.
Risks & watch-outs
- Climate carrying-cost: major wind risk, 27% chance of damaging wind over 30y; extreme-heat days projected 7→17/yr by 2055 (HVAC capex compounding) — expect insurance premiums to compound above CPI over the hold.
Questions for the listing agent
- What do current leases actually rent for vs. the listed asking? Can we see a recent rent roll and the last 12 months of T-12 income?
- What does the HOA fee cover, when was the last increase, and are there any pending special assessments or reserve-fund shortfalls?
- Is there a deadline driving the sale (1031 exchange, divorce, estate, relocation)? That informs how much negotiation room exists.
- Schools are D-rated, which usually means shorter tenancies and higher turnover. Who's the typical renter profile here, and what's been the actual vacancy rate?
- Crime grade is F in this area — have there been break-ins, vandalism, or insurance claims at this property in the last 3 years? What carrier currently insures it and at what premium?
- The area grade is low — what's the realistic commute time and amenity access for the typical tenant pool here? Any planned neighborhood developments (good or bad) we should know about?
- What's the average days-on-market for RENTAL listings here right now (not sales)? A rising rental-DOM trend means longer vacancies and softer asking-rent achievability than the comps imply.
- What's the recent tenant-quality profile in this submarket — average credit score on applications, eviction rate, late-payment / NSF rate, and stable-employment percentage? A property-management company in the area should have these aggregated.
- How much new for-sale + rental construction is in the pipeline within 1–3 miles? Heavy new supply typically softens prices + rents 12–24 months out; constrained supply supports both.
Investment metrics
- 1% rule
- 0.88% ✗
- Cap rate
- 6.07%
- Cash-on-cash
- -0.81%
- DSCR
- 0.96
- GRM
- 9.5
CMA / ARV
- ARV (on-the-fly)
- $169,494
- Comps found
- 12
Show comp detail 12 sales within ~0.75 mi
| Address | Dist | Beds/Ba | Sqft | Sold | Price | $/sf | Match |
|---|---|---|---|---|---|---|---|
| 7031 Stonington Ln | 0.12mi | 2/1.5 | 1,040 (-2%) | 3mo | $165,000 | $159 | 88 |
| 5727 Dockside Dr | 0.27mi | 2/2.0 | 1,113 (+4%) | 7mo | $196,000 | $176 | 73 |
| 5719 Dockside Dr | 0.27mi | 2/2.0 | 1,136 (+7%) | 3mo | $180,000 | $158 | 72 |
| 7360 Winery Ln | 0.14mi | 2/2.0 | 1,130 (+6%) | 14mo | $195,000 | $173 | 70 |
| 5731 Dockside Dr Unit B | 0.21mi | 2/2.0 | 1,100 (+3%) | 18mo | $200,000 | $182 | 68 |
| 7319 Winery Ln | 0.20mi | 2/2.0 | 1,128 (+6%) | 14mo | $193,000 | $171 | 67 |
| 5719 Dockside Dr #1102 | 0.27mi | 2/2.0 | 1,136 (+7%) | 12mo | $145,000 | $128 | 65 |
| 7005 Stonington Ln | 0.13mi | 3/1.5 (+1) | 1,194 (+12%) | 11mo | $207,000 | $173 | 60 |
| 7021 Stonington Ln | 0.14mi | 3/1.5 (+1) | 1,200 (+13%) | 17mo | $155,000 | $129 | 54 |
| 8024 Tremaine Ct Unit D | 0.69mi | 2/2.0 | 956 (-10%) | 15mo | $102,000 | $107 | 36 |
| 8123 Tremaine Ct Unit G | 0.74mi | 2/2.0 | 976 (-8%) | 20mo | $122,000 | $125 | 33 |
| 8032 Tremaine Ct Unit H | 0.70mi | 2/2.0 | 941 (-12%) | 16mo | $116,500 | $124 | 32 |
Match score weights: distance 35% · size 25% · config 20% · recency 20%. Top-matched comps best support the ARV.
Projected returns pro-forma
-3.0% appreciation · 2.7% rent growth · sell at horizon
- IRR
- -18.0%
- Equity multiple
- 0.37×
- Total profit
- $-31,592
- Equity at exit
- $26,689
- IRR
- -10.7%
- Equity multiple
- 0.36×
- Total profit
- $-32,030
- Equity at exit
- $15,477
Cash invested: $50,120 (down + closing). Projections, not guarantees.
Landlord ↔ Tenant lean methodology
- Overall (STATE)
- 85 Strongly Landlord-Friendly
- State North Carolina
- 85 Strongly Landlord-Friendly · R+3
- County
- — inherits STATE
- City
- — inherits STATE
ZIP-level market 28227
- Rents YoY
- 2.7%
- Active inventory
- 375
- Price-to-rent
- 9.5×
Monthly cashflow live
- Estimated rent
- $1,570 high interval (Pro) →
- Mortgage (P&I)
- −$939
- Tax from tax record
- −$69 /mo · $827/yr
- Insurance
- −$75
- HOA
- −$192
- Vacancy / Maint / Mgmt
- −$330
- Net cashflow
- $-34
Break-even live
UW: 25.0% down · 7.5% · 30yr · 1.5% tax · 5.0% vac · 8.0% maint · 8.0% mgmt
Financing live
Cash to close
- Down payment
- $44,750
- Closing costs
- $5,370
- Reserves months
- —
- Total cash needed
- —
Loan-product check · same deal, 3 products live
Conventional
25% down · 7.5% · 30yr
- Down + closing
- —
- Monthly P&I
- —
- Monthly cashflow
- —
- DSCR
- —
- Eligible?
- —
Personal DTI + credit; lowest rate.
DSCR
20% down · 8.5% · 30yr
- Down + closing
- —
- Monthly P&I
- —
- Monthly cashflow
- —
- DSCR
- —
- Eligible?
- —
No personal income docs; deal must DSCR.
Hard money
10% down · 12.0% · 12mo
- Down + closing
- —
- Monthly P&I
- —
- Monthly cashflow
- —
- DSCR
- —
- Eligible?
- —
Short-term bridge; refi at stabilization.
Rent comps 40 comps
| Address | Beds | Baths | Sqft | Rent | $/sqft | DOM | Units | Dist |
|---|---|---|---|---|---|---|---|---|
| 7005 Stonington Ln Charlotte, NC | 2.0 | 1.5 | 1194 | $1,575 | $1.32 | 23d | 1 | 0.14mi |
| 7345 Winery Ln #907 Charlotte, NC | 2.0 | 2.0 | 1132 | $1,550 | $1.37 | 10d | 1 | 0.18mi |
| 7345 Winery Ln #907 Charlotte, NC | 2.0 | 2.0 | 1132 | $1,700 | $1.50 | 23d | 1 | 0.18mi |
| 6927 Stonington Ln Charlotte, NC | 3.0 | 2.0 | 1279 | $1,375 | $1.08 | 14d | 1 | 0.18mi |
| 7124 Winery Ln Charlotte, NC | 2.0 | 2.0 | 1131 | $1,350 | $1.19 | 16d | 1 | 0.19mi |
| 7345 Winery Ln Charlotte, NC | 2.0 | 2.0 | 1132 | $1,550 | $1.37 | 3d | 1 | 0.21mi |
| 5718 Dockside Dr Charlotte, NC | 2.0 | 2.0 | 1100 | $1,495 | $1.36 | 23d | 1 | 0.25mi |
| 5710 Copper Creek Ct Charlotte, NC | 1.0–2.0 | 1.0–2.0 | 678 | $1,399 | $2.06 | 23d | 1 | 0.26mi |
| 7223 Winery Ln Charlotte, NC | 2.0 | 2.0 | 1120 | $1,550 | $1.38 | 23d | 1 | 0.28mi |
| 5323 Chestnut Lake Dr Charlotte, NC | 3.0 | 2.5 | 1440 | $1,500 | $1.04 | 23d | 1 | 0.35mi |
| 7259 Point Lake Dr Charlotte, NC | 1.0–3.0 | 1.0–2.0 | 950 | $1,174 | $1.24 | 23d | 1 | 0.47mi |
| 7714 Albemarle Rd Charlotte, NC | 2.0 | 1.5 | 1074 | $1,500 | $1.40 | 10d | 1 | 0.49mi |
| 7100 Snow Ln Charlotte, NC | 2.0 | 1.5 | 852 | $1,275 | $1.50 | 23d | 1 | 0.49mi |
| 7626 Eastbourne Rd Charlotte, NC | 2.0 | 1.0 | 800 | $1,750 | $2.19 | 16d | 1 | 0.55mi |
| 7938 Lindfield Ct Charlotte, NC | 3.0 | 2.0 | 1189 | $1,880 | $1.58 | 14d | 1 | 0.56mi |
| 6024 Spanish Oak Rd Charlotte, NC | 3.0 | 1.5 | 1148 | $1,600 | $1.39 | 7d | 1 | 0.60mi |
| 8301 Parkland Cir Charlotte, NC | 1.0–3.0 | 1.0–3.0 | 960 | $1,199 | $1.25 | 16d | 1 | 0.65mi |
| 8020 Tremaine Ct Charlotte, NC | 3.0 | 2.0 | 1172 | $1,595 | $1.36 | 23d | 1 | 0.65mi |
| 8024 Tremaine Ct Charlotte, NC | 2.0 | 2.0 | 1058 | $1,612 | $1.52 | 23d | 2 | 0.69mi |
| 8310 E W T Harris Blvd Charlotte, NC | 1.0–2.0 | 1.0 | 792 | $1,295 | $1.64 | 14d | 4 | 0.73mi |
| 8115 Tremaine Ct Charlotte, NC | 2.0 | 2.0 | 935 | $1,550 | $1.66 | 13d | 1 | 0.75mi |
| 8117 Tremaine Ct Unit B Charlotte, NC | 1.0 | 1.0 | 875 | $1,295 | $1.48 | 16d | 1 | 0.77mi |
| 5310 McAlpine Glen Dr Charlotte, NC | 1.0–2.0 | 1.0–2.0 | 750 | $1,600 | $2.13 | 2d | 14 | 0.77mi |
| 6200 Martin Lake Rd Charlotte, NC | 3.0 | 2.0 | 1250 | $1,940 | $1.55 | 23d | 1 | 0.80mi |
| 7139 Winding Cedar Trl Charlotte, NC | 1.0–3.0 | 1.0–2.0 | 954 | $1,289 | $1.35 | 23d | 1 | 0.80mi |
| 6701 English Hills Dr Charlotte, NC | 1.0–2.0 | 1.0–2.0 | 733 | $1,370 | $1.87 | 1d | 19 | 0.91mi |
| 6619 Yateswood Dr Charlotte, NC | 1.0–2.0 | 1.0–2.0 | 800 | $1,220 | $1.52 | 1d | 32 | 0.96mi |
| 7873 Petrea Ln Charlotte, NC | 2.0 | 1.5 | 979 | $1,550 | $1.58 | 7d | 1 | 1.00mi |
| 8618 Twined Creek Ln Charlotte, NC | 2.0 | 2.5 | 1226 | $1,595 | $1.30 | 7d | 1 | 1.01mi |
| 7819 Petrea Ln Charlotte, NC | 3.0 | 1.5 | 1360 | $1,650 | $1.21 | 23d | 1 | 1.03mi |
| 8708 Twined Creek Ln Charlotte, NC | 2.0 | 2.5 | 1058 | $1,550 | $1.47 | 7d | 1 | 1.05mi |
| 6000 Delta Crossing Ln Charlotte, NC | 1.0–3.0 | 1.0–2.0 | 992 | $1,413 | $1.42 | 1d | 13 | 1.06mi |
| 8727 Wandering Creek Way Charlotte, NC | 3.0 | 2.5 | 1368 | $1,650 | $1.21 | 16d | 1 | 1.09mi |
| 8727 Wandering Creek Way Charlotte, NC | 3.0 | 2.5 | 1368 | $1,695 | $1.24 | 7d | 1 | 1.09mi |
| 8737 Wandering Creek Way Charlotte, NC | 2.0 | 2.5 | 1019 | $1,325 | $1.30 | 23d | 1 | 1.10mi |
| 7667 Petrea Ln Charlotte, NC | 3.0 | 2.0 | 1383 | $1,675 | $1.21 | 23d | 1 | 1.13mi |
| 4535 Dawnwood Dr Charlotte, NC | 3.0 | 2.5 | 1496 | $1,745 | $1.17 | 23d | 1 | 1.15mi |
| 6401 Woodbend Dr Charlotte, NC | 1.0–2.0 | 1.0–2.0 | 697 | $1,536 | $2.20 | 1d | 16 | 1.20mi |
| 5923 Farm Pond Ln Charlotte, NC | 1.0–3.0 | 1.0–2.0 | 937 | $1,412 | $1.51 | 23d | 1 | 1.20mi |
| 6320 Woodbend Dr Charlotte, NC | 1.0–2.0 | 1.0–2.0 | 787 | $1,370 | $1.74 | 1d | 21 | 1.24mi |
HOA detail
- Monthly dues
- $192 · $2,304/yr
Listing history 22 events
-
2026-06-18days on market $179,000 Active 21 DOM
-
2026-06-17days on market $179,000 Active 20 DOM
-
2026-06-16days on market $179,000 Active 19 DOM
-
2026-06-15days on market $179,000 Active 18 DOM
-
2026-06-13days on market $179,000 Active 16 DOM
-
2026-06-09days on market $179,000 Active 12 DOM
-
2026-06-08days on market $179,000 Active 11 DOM
-
2026-06-07days on market $179,000 Active 10 DOM
-
2026-06-04days on market $179,000 Active 7 DOM
-
2026-06-03days on market $179,000 Active 6 DOM
-
2026-06-02days on market $179,000 Active 5 DOM
-
2026-06-01days on market $179,000 Active 4 DOM
-
2026-05-31days on market $179,000 Active 3 DOM
-
2026-05-28$179,000 Active
-
2018-08-30soldstatus $75,000 Closed 162-char remark
Show marketing remark (162 chars)
Ready for move in! New carpet, fresh paint and more. Corner end unit with outside storage/ patio. Buyers, call list agent for private showing and more details.
-
2018-08-30soldstatus $75,000
Show marketing remark (162 chars)
Ready for move in! New carpet, fresh paint and more. Corner end unit with outside storage/ patio. Buyers, call list agent for private showing and more details.
-
2018-07-09historical Under Contract - Show 162-char remark
Show marketing remark (162 chars)
Ready for move in! New carpet, fresh paint and more. Corner end unit with outside storage/ patio. Buyers, call list agent for private showing and more details.
-
2018-07-05price $74,999 162-char remark
Show marketing remark (162 chars)
Ready for move in! New carpet, fresh paint and more. Corner end unit with outside storage/ patio. Buyers, call list agent for private showing and more details.
-
2018-06-04$79,900 Active 162-char remark
Show marketing remark (162 chars)
Ready for move in! New carpet, fresh paint and more. Corner end unit with outside storage/ patio. Buyers, call list agent for private showing and more details.
-
2018-03-07soldstatus $55,500
-
2007-01-11soldstatus $58,000
-
1999-03-01soldstatus $65,000
ⓘ Source: listings_history table (triggers on properties + properties_extension) + one-shot
backfill from property_details.listing_events for pre-trigger history.
Tax reassessment forecast NC · Resets to sale price
- Current annual tax
- $827 · $69/mo
- Projected year-2 tax
- $1,468 · $122/mo
- Expected delta
- +$641/yr (+$53/mo · 77.5%)
ⓘ Screening estimate from a state-policy table — verify with the county assessor before closing.
Climate risk First Street
- Flood 1/10 Low FEMA zone X (unshaded) · 0% chance over 30 yrs
- Wildfire 1/10 Low
- Heat 6/10 Major 7 d/yr ≥104°F today · 17 d/yr by 30 yrs out
- Wind 6/10 Major 27% chance of damaging wind over 30 yrs
- Air quality 3/10 Moderate 3 unhealthy d/yr today · 4 by 30 yrs out
Nearby sold comps map
Loading sold comps map…
Walkable amenities ~0.75 mi
Loading nearby amenities…
Taxation est. · year 1
- Rental income
- $18,840
- − Mortgage interest
- −$10,027
- − Property taxes
- −$827
- − Insurance
- −$895
- − Repairs & maintenance
- −$1,507
- − Management
- −$1,507
- − HOA
- −$2,304
- − Depreciation
- −$5,207
- Taxable loss
- −$3,435
- Est. tax savings @ 24.0%
- +$824
- After-tax cash flow
- $417/yr
For passive investors: Depreciation is non-cash, so a rental often shows a tax loss while cash-flowing — sheltering income. Rental losses are passive: they offset passive income freely, and up to $25,000/yr can offset ordinary (W-2) income if you actively participate and your MAGI is under $100k (phasing out to $0 by $150k); unused losses carry forward. On sale, claimed depreciation is recaptured at up to 25%, and gains may owe capital-gains tax (a 1031 exchange can defer both). Figures are a year-1 estimate at your 24.0% rate — not tax advice; consult a CPA.
Schools (NCES district)
- District
- Charlotte-Mecklenburg Schools
- NCES district ID
- 3702970
- Math proficiency
- 42% ▼ -6.00%
- Reading proficiency
- 46% ▲ 1.00%
- Median HH income
- $57,175
- Composite
- 38.49/100
- National rank
- #4183
- State rank
- #85 of 178 in NC
Livability — Charlotte
- Score
- 78/100
- State rank
- #26
- US rank
- #2502
Category grades
Schools grade is shown separately in the Schools card above.
Census & demographics
- Census place
- Charlotte, NC
- County
- Mecklenburg County · 1,167,319 people
- City population
- 920,422
- Metro
- Charlotte-Concord-Gastonia, NC-SC
- Population (ZIP)
- 60,482
- Household income
- $77,115
- Rent vs Own
- Severe rent burden
- 1373.0
Population outlook (Mecklenburg County) Hauer SSP2
- Today (2025)
- 1,305,740 people
- By 2030
- 1,442,752 · +10.5%
- By 2040
- 1,722,441 · +31.9%
- By 2050
- 1,999,450 · +53.1%
- By 2075
- 2,642,495 · +102.4%
- By 2100
- 3,106,755 · +137.9%
Race, ethnicity, and origin ACS 2023
- Neighborhood character
- Diverse neighborhood (Simpson 0.69)
- Race & ethnicity
- White 43% Black 29% Hispanic / Latino 19% Two or more races 8% Asian 5%
- Hispanic origin (detail)
- Mexican 8% Puerto Rican 2%
- Common ancestry
- Slovak 2% Serbian 2% Scotch-Irish 1%
- Foreign-born
- 17% · Canada, Philippines, Vietnam
- Languages at home
- 76% English-only · Spanish 17% Other Indo-European 2% Other Asian/Pacific 1%
Political lean MEDSL · Mecklenburg
- 2024 margin
- Solid D (+32.9) · D 65.6% · R 32.7% · Other 1.6%
- 2008→2024 swing
- +8.5pp toward D · 2008: 24.4pp · 2024: 32.9pp
- All cycles
- 2024: D+32.9 2020: D+35.1 2016: D+29.9 2012: D+22.5 2008: D+24.4
Not yet ingested
- Civics
- —
Market trends
- HPI YoY
- ▼ -281.74%
- Current HPI
- 257.0678
- Rent YoY
- ▲ 2.70%
- Metro
- Charlotte-Concord-Gastonia, NC-SC
- State GDP YoY
- ▲ 3.28%
- F500 in state
- 26
Industry mix (Fortune 500 HQ in NC)
| Industry | F500 HQs | Revenue |
|---|---|---|
| Financial Services | 2 | $213B |
|
||
| Retail | 2 | $95B |
|
||
| Industrial Conglomerate | 1 | $38B |
|
||
| Metals / Steel | 1 | $35B |
|
||
| Utilities | 1 | $30B |
|
||
| Industrial Machinery | 1 | $19B |
|
||
Price history
+175.4% since first listed9 events — show timeline
- 2026-05-28 Listed $179,000 CANOPYMLS as Distributed by MLS Grid
- 2018-08-30 Sold (Public Records) $75,000 Public Records
- 2018-08-30 Sold (MLS) $75,000 CANOPYMLS as Distributed by MLS Grid
- 2018-07-09 Contingent — CANOPYMLS as Distributed by MLS Grid
- 2018-07-05 Price Changed $74,999 CANOPYMLS as Distributed by MLS Grid
- 2018-06-04 Listed $79,900 CANOPYMLS as Distributed by MLS Grid
- 2018-03-07 Sold (Public Records) $55,500 Public Records
- 2007-01-11 Sold (Public Records) $58,000 Public Records
- 1999-03-01 Sold (Public Records) $65,000 Public Records
Property tax history
+1.9%/yrLatest (2022): $827 · +1.4% YoY. Source: county tax records.
Cash-flow waterfall
monthlySold comps — $/sqft
last 12 mo · ≤1 miLoading sold comps…