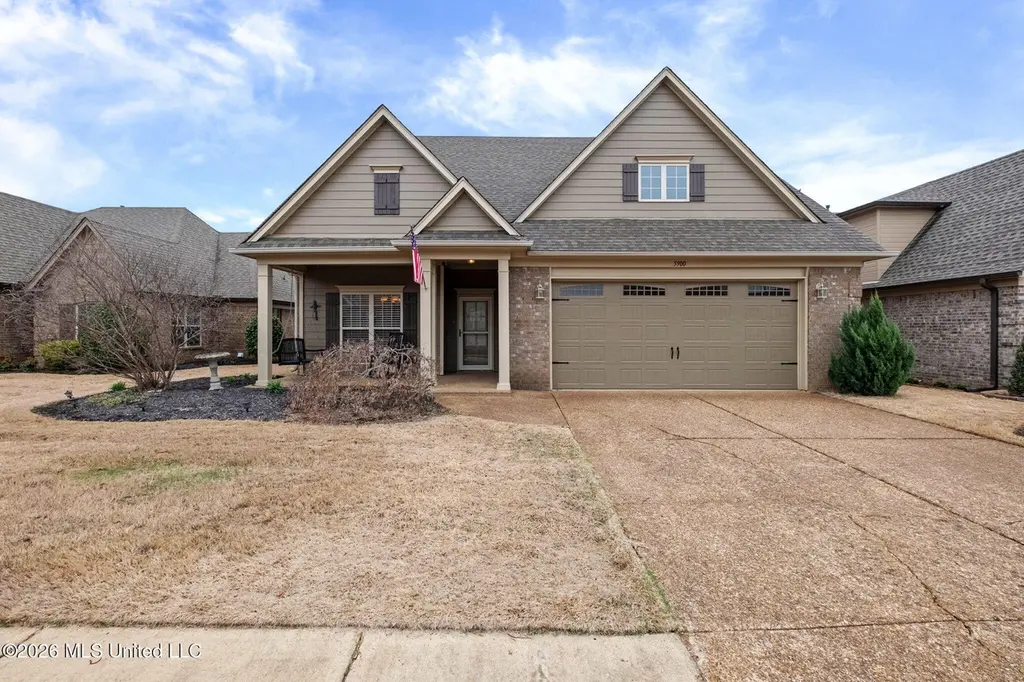
5900 S Foxdale Loop · Southaven, MS
Flood risk 1/10 · Minimal
- FEMA flood zone
- X (unshaded)
- Chance of flooding over 30 yrs
- 0.0%
- Est. flood insurance / yr
- $507 – $1,088
Fire risk 3/10 · Minor
- Est. fire insurance / yr
- $1,241 – $2,305
Heat risk 7/10 · Major
- Hot days now (above 109°F)
- 7 days/yr
- Hot days in 30 yrs
- 22 days/yr
Wind risk 4/10 · Minor
- Chance of severe wind over 30 yrs
- 20.0%
Air-quality risk 2/10 · Minimal
- Unhealthy air days now
- 2 days/yr
- Unhealthy air days in 30 yrs
- 2 days/yr
Risk factors via First Street. Map © Google.
Why this score? — see what drove the D- grade
The composite is a weighted blend of 9 inputs, each scored 0–100. Each bar is that input's sub-score; the figure is the points it added to the 100-point composite (weight × sub-score).
- Cash flow +12.4/30.0
- ARV discount +7.0/15.0
- Schools +4.0/10.0
- DSCR +3.7/10.0
- 1% rule +3.6/10.0
- Livability +3.2/5.0
- Rent growth +2.5/5.0
- Condition / age +2.5/5.0
- Appreciation +0.0/10.0
$315,000
🖨 Deal sheet 📄 Offer letter ✓ Due diligence
Listing remarks MLS
Gated 55+ Community near Snowden Grove and Silo Square. Tons of options for entertainment, shopping and dining. This home is clean and move-in ready! Fresh paint throughout. Large primary closet and large walk-in shower with seat, rain shower head and hand held spray. Unfinished bonus room upstairs. Use for extra storage or finish for bonus or hobby area. Fully fenced back yard. Front porch and rear covered patio. Formal dining room, great room with gas fireplace. Don't worry about bringing your mower because yard maintenance is included in HOA fee!
Key facts
- Gated community
- Large primary closet
- Front porch
Tags
Neighborhood map
What this means for you Summary
Snapshot
- This is a 3-bed/2.0-bath single-family listed at $315k.
Deal economics
- At list price, monthly cash flow is $-53 ($-642/yr) — negative.
- To cash-flow at today's rent, offer at most $306k (3.0% below list).
- To meet the 1% rule (rent ≥ 1% of price), the offer needs to be $272k (13.8% below list).
- Recommended offer: $272k (13.8% below list) — sets the bar for 1% rule.
Location & tenants
- Location reads 65/100 on livability (#107 in MS) — a middle-class / working-renter tenant base. Strengths: cost of living A+, housing A+; Watch: schools D+, amenities F, commute F.
- Desoto County School District (suburban): math 48% / reading 42% proficiency, ranked #20 of 130 in MS (top 15%) — families likely to look elsewhere, expect single-tenant / working-renter base with shorter leases.
- Market conditions: 157 active listings in the ZIP; 8 comparable units currently listed for rent nearby; rentals lingering (median 44d on market — plan ~5-8 weeks vacancy on turnover, expect pricing pressure); 50% of comp listings sitting > 30 days — soft ceiling on asking rent; high-income renter base; 1,155 units permitted in DeSoto County in 2024 (0 in 5+ unit buildings).
Forward outlook
- Local home prices are declining (-3.0%/yr); year-one equity from $2k of loan paydown is wiped out by about $9k of value loss. Plan a longer hold.
- DeSoto County population projected at +33% by 2050 — long-run rental-demand tailwind backs the buy-and-hold thesis.
Negotiation context
- It's been on market 100 days — a 9% lower offer ($287k) is reasonable based on typical stale-listing flexibility.
- 3 sale attempts since 17y ago with the ask held roughly flat each time — persistent listings suggest the price (not the market) is what's stuck; bring a comps-based counter.
Risks & watch-outs
- Climate carrying-cost: extreme-heat days projected 7→22/yr by 2055 (HVAC capex compounding) — expect insurance premiums to compound above CPI over the hold.
Questions for the listing agent
- What do current leases actually rent for vs. the listed asking? Can we see a recent rent roll and the last 12 months of T-12 income?
- It's been on market 100 days. Have you received any prior offers? Is the seller open to a 14% concession, seller financing, or rate buy-down credit?
- What does the HOA fee cover, when was the last increase, and are there any pending special assessments or reserve-fund shortfalls?
- Why hasn't it sold? Are there any deal-killer items the seller is aware of (foundation, flood, title, zoning, code violations)?
- Is there a deadline driving the sale (1031 exchange, divorce, estate, relocation)? That informs how much negotiation room exists.
- Schools are D-rated, which usually means shorter tenancies and higher turnover. Who's the typical renter profile here, and what's been the actual vacancy rate?
- The area grade is low — what's the realistic commute time and amenity access for the typical tenant pool here? Any planned neighborhood developments (good or bad) we should know about?
- What's the average days-on-market for RENTAL listings here right now (not sales)? A rising rental-DOM trend means longer vacancies and softer asking-rent achievability than the comps imply.
- What's the recent tenant-quality profile in this submarket — average credit score on applications, eviction rate, late-payment / NSF rate, and stable-employment percentage? A property-management company in the area should have these aggregated.
- How much new for-sale + rental construction is in the pipeline within 1–3 miles? Heavy new supply typically softens prices + rents 12–24 months out; constrained supply supports both.
Investment metrics
- 1% rule
- 0.86% ✗
- Cap rate
- 6.09%
- Cash-on-cash
- -0.73%
- DSCR
- 0.97
- GRM
- 9.7
CMA / ARV
- ARV (median comp)
- $311,567
- List price
- $315,000
- Delta
- 1.10%
- Verdict
- FAIR
- Comps
- 20 within 1.0 mi
Show comp detail 12 sales within ~0.75 mi
| Address | Dist | Beds/Ba | Sqft | Sold | Price | $/sf | Match |
|---|---|---|---|---|---|---|---|
| 3302 Foxdale Loop | 0.09mi | 3/2.0 | 1,642 (-4%) | 4mo | $295,900 | $180 | 85 |
| 5921 Foxdale Loop | 0.04mi | 2/2.0 (-1) | 1,637 (-4%) | 2mo | $295,000 | $180 | 84 |
| 3281 Foxdale Loop | 0.09mi | 3/2.0 | 1,576 (-8%) | 2mo | $291,500 | $185 | 81 |
| 5798 E Bedford Loop | 0.16mi | 3/2.0 | 1,664 (-3%) | 12mo | $310,000 | $186 | 77 |
| 5503 Sugarberry Ln | 0.52mi | 4/2.0 (+1) | 1,733 (+1%) | 4mo | $308,000 | $178 | 65 |
| 5696 Carter Dr | 0.53mi | 3/2.5 | 1,618 (-6%) | 3mo | $250,000 | $155 | 62 |
| 8710 Casey Jones Dr | 0.25mi | 4/2.5 (+1) | 1,898 (+11%) | 3mo | $308,000 | $162 | 61 |
| 5842 Savannah Pkwy | 0.10mi | 2/2.5 (-1) | 1,908 (+11%) | 12mo | $329,000 | $172 | 59 |
| 3129 Amanda Belle | 0.56mi | 4/2.0 (+1) | 1,849 (+8%) | 0mo | $300,000 | $162 | 55 |
| 5716 W Bedford Loop | 0.27mi | 4/2.0 (+1) | 1,885 (+10%) | 13mo | $305,900 | $162 | 55 |
| 2696 Baird Dr | 0.70mi | 4/2.0 (+1) | 1,747 (+2%) | 10mo | $285,000 | $163 | 51 |
| 5707 Antler Trl | 0.74mi | 4/2.0 (+1) | 1,840 (+8%) | 6mo | $225,000 | $122 | 43 |
Match score weights: distance 35% · size 25% · config 20% · recency 20%. Top-matched comps best support the ARV.
Projected returns pro-forma
-3.0% appreciation · 3.0% rent growth · sell at horizon
- IRR
- -17.5%
- Equity multiple
- 0.38×
- Total profit
- $-54,394
- Equity at exit
- $46,968
- IRR
- -9.5%
- Equity multiple
- 0.42×
- Total profit
- $-51,527
- Equity at exit
- $27,235
Cash invested: $88,200 (down + closing). Projections, not guarantees.
Landlord ↔ Tenant lean methodology
- Overall (STATE)
- 90 Strongly Landlord-Friendly
- State Mississippi
- 90 Strongly Landlord-Friendly · R+11
- County
- — inherits STATE
- City
- — inherits STATE
ZIP-level market 38672
- Home prices YoY
- -13.1%
- Active inventory
- 157
- Price-to-rent
- 9.7×
Monthly cashflow live
- Estimated rent
- $2,716 high interval (Pro) →
- Mortgage (P&I)
- −$1,652
- Tax from tax record
- −$191 /mo · $2,295/yr
- Insurance
- −$131
- HOA
- −$225
- Vacancy / Maint / Mgmt
- −$570
- Net cashflow
- $-53
Break-even live
UW: 25.0% down · 7.5% · 30yr · 1.5% tax · 5.0% vac · 8.0% maint · 8.0% mgmt
Financing live
Cash to close
- Down payment
- $78,750
- Closing costs
- $9,450
- Reserves months
- —
- Total cash needed
- —
Loan-product check · same deal, 3 products live
Conventional
25% down · 7.5% · 30yr
- Down + closing
- —
- Monthly P&I
- —
- Monthly cashflow
- —
- DSCR
- —
- Eligible?
- —
Personal DTI + credit; lowest rate.
DSCR
20% down · 8.5% · 30yr
- Down + closing
- —
- Monthly P&I
- —
- Monthly cashflow
- —
- DSCR
- —
- Eligible?
- —
No personal income docs; deal must DSCR.
Hard money
10% down · 12.0% · 12mo
- Down + closing
- —
- Monthly P&I
- —
- Monthly cashflow
- —
- DSCR
- —
- Eligible?
- —
Short-term bridge; refi at stabilization.
Rent comps 8 comps
| Address | Beds | Baths | Sqft | Rent | $/sqft | DOM | Units | Dist |
|---|---|---|---|---|---|---|---|---|
| 2855 Nail Rd E Southaven, MS | 2.0 | 2.0 | 1740 | $3,345 | $1.92 | 43d | 1 | 0.46mi |
| 5683 Antler Trl Southaven, MS | 3.0 | 2.0 | 1794 | $2,015 | $1.12 | 4d | 1 | 0.72mi |
| 5764 Deer Ridge Dr Southaven, MS | 4.0 | 2.0 | 1665 | $2,060 | $1.24 | 1d | 1 | 0.79mi |
| 5678 Kuykendall Dr Southaven, MS | 4.0 | 2.0 | 2244 | $2,285 | $1.02 | 4d | 1 | 0.85mi |
| 6656 Belltower Pl Southaven, MS | 3.0 | 3.0 | 2126 | $4,400 | $2.07 | 43d | 1 | 0.93mi |
| 4919 Rosebrook Cir E Southaven, MS | 3.0 | 2.0 | 1683 | $2,200 | $1.31 | 43d | 1 | 0.97mi |
| 6150 Morgan Dr Olive Branch, MS | 3.0 | 2.0 | 2000 | $2,130 | $1.06 | 43d | 1 | 1.00mi |
| 4508 Westminister Cir Southaven, MS | 4.0 | 3.0 | 2204 | $2,165 | $0.98 | 11d | 1 | 1.44mi |
HOA detail
- Monthly dues
- $225 · $2,700/yr
- Likely covers
- gassecurity
Listing history 22 events
-
2026-06-18days on market $315,000 Active 100 DOM
-
2026-06-17days on market $315,000 Active 99 DOM
-
2026-06-16days on market $315,000 Active 98 DOM
-
2026-06-15days on market $315,000 Active 97 DOM
-
2026-06-13days on market $315,000 Active 95 DOM
-
2026-06-10days on market $315,000 Active 92 DOM
-
2026-06-09days on market $315,000 Active 91 DOM
-
2026-06-08days on market $315,000 Active 90 DOM
-
2026-06-07days on market $315,000 Active 89 DOM
-
2026-06-03days on market $315,000 Active 85 DOM
-
2026-06-02days on market $315,000 Active 84 DOM
-
2026-06-01days on market $315,000 Active 83 DOM
-
2026-05-31days on market $315,000 Active 82 DOM
-
2026-04-22price $315,000 555-char remark
Show marketing remark (555 chars)
Gated 55+ Community near Snowden Grove and Silo Square. Tons of options for entertainment, shopping and dining. This home is clean and move-in ready! Fresh paint throughout. Large primary closet and large walk-in shower with seat, rain shower head and hand held spray. Unfinished bonus room upstairs. Use for extra storage or finish for bonus or hobby area. Fully fenced back yard. Front porch and rear covered patio. Formal dining room, great room with gas fireplace. Don't worry about bringing your mower because yard maintenance is included in HOA fee!
-
2026-04-08price $320,000 555-char remark
Show marketing remark (555 chars)
Gated 55+ Community near Snowden Grove and Silo Square. Tons of options for entertainment, shopping and dining. This home is clean and move-in ready! Fresh paint throughout. Large primary closet and large walk-in shower with seat, rain shower head and hand held spray. Unfinished bonus room upstairs. Use for extra storage or finish for bonus or hobby area. Fully fenced back yard. Front porch and rear covered patio. Formal dining room, great room with gas fireplace. Don't worry about bringing your mower because yard maintenance is included in HOA fee!
-
2026-03-10$325,000 Active 555-char remark
Show marketing remark (555 chars)
Gated 55+ Community near Snowden Grove and Silo Square. Tons of options for entertainment, shopping and dining. This home is clean and move-in ready! Fresh paint throughout. Large primary closet and large walk-in shower with seat, rain shower head and hand held spray. Unfinished bonus room upstairs. Use for extra storage or finish for bonus or hobby area. Fully fenced back yard. Front porch and rear covered patio. Formal dining room, great room with gas fireplace. Don't worry about bringing your mower because yard maintenance is included in HOA fee!
-
2021-10-11historical
-
2019-10-31soldstatus
-
2011-07-29$162,900
-
2011-07-29historical
-
2009-12-08soldstatus
-
2009-11-25$158,500
ⓘ Source: listings_history table (triggers on properties + properties_extension) + one-shot
backfill from property_details.listing_events for pre-trigger history.
Tax reassessment forecast MS · Resets to sale price
- Current annual tax
- $2,295 · $191/mo
- Projected year-2 tax
- $2,489 · $207/mo
- Expected delta
- +$194/yr (+$16/mo · 8.5%)
ⓘ Screening estimate from a state-policy table — verify with the county assessor before closing.
Climate risk First Street
- Flood 1/10 Low FEMA zone X (unshaded) · 0% chance over 30 yrs
- Wildfire 3/10 Moderate
- Heat 7/10 Severe 7 d/yr ≥109°F today · 22 d/yr by 30 yrs out
- Wind 4/10 Moderate 20% chance of damaging wind over 30 yrs
- Air quality 2/10 Low 2 unhealthy d/yr today · 2 by 30 yrs out
Nearby sold comps map
Loading sold comps map…
Walkable amenities ~0.75 mi
Loading nearby amenities…
Taxation est. · year 1
- Rental income
- $32,596
- − Mortgage interest
- −$17,645
- − Property taxes
- −$2,295
- − Insurance
- −$1,575
- − Repairs & maintenance
- −$2,608
- − Management
- −$2,608
- − HOA
- −$2,700
- − Depreciation
- −$9,164
- Taxable loss
- −$5,998
- Est. tax savings @ 24.0%
- +$1,439
- After-tax cash flow
- $798/yr
For passive investors: Depreciation is non-cash, so a rental often shows a tax loss while cash-flowing — sheltering income. Rental losses are passive: they offset passive income freely, and up to $25,000/yr can offset ordinary (W-2) income if you actively participate and your MAGI is under $100k (phasing out to $0 by $150k); unused losses carry forward. On sale, claimed depreciation is recaptured at up to 25%, and gains may owe capital-gains tax (a 1031 exchange can defer both). Figures are a year-1 estimate at your 24.0% rate — not tax advice; consult a CPA.
Schools (NCES district)
- District
- Desoto County School District
- NCES district ID
- 2801320
- Math proficiency
- 48% ▼ -13.00%
- Reading proficiency
- 42% ▼ -6.00%
- Median HH income
- $59,272
- Composite
- 39.56/100
- National rank
- #3933
- State rank
- #20 of 130 in MS
Livability — Southaven
- Score
- 65/100
- State rank
- #107
- US rank
- #12584
Category grades
Schools grade is shown separately in the Schools card above.
Census & demographics
- Census place
- Southaven, MS
- County
- DeSoto County · 176,513 people
- City population
- 53,755
- Metro
- Memphis, TN-MS-AR
- Population (ZIP)
- 16,436
- Household income
- $116,184
- Rent vs Own
- Severe rent burden
- 44.0
Population outlook (DeSoto County) Hauer SSP2
- Today (2025)
- 203,338 people
- By 2030
- 217,692 · +7.1%
- By 2040
- 245,320 · +20.6%
- By 2050
- 270,133 · +32.8%
- By 2075
- 323,341 · +59.0%
- By 2100
- 348,742 · +71.5%
Race, ethnicity, and origin ACS 2023
- Neighborhood character
- Majority White (60%)
- Race & ethnicity
- White 60% Black 31% Hispanic / Latino 5% Two or more races 4% Asian 3%
- Hispanic origin (detail)
- Mexican 3%
- Common ancestry
- Subsaharan African 2% Italian 2% Serbian 1%
- Foreign-born
- 5% · Canada, China
- Languages at home
- 96% English-only · Spanish 2% Chinese 1% Other Asian/Pacific 1%
Political lean MEDSL · DeSoto
- 2024 margin
- Strong R (+24.1) · D 36.7% · R 60.8% · Other 2.5%
- 2008→2024 swing
- +14.2pp toward D · 2008: -38.2pp · 2024: -24.1pp
- All cycles
- 2024: R+24.1 2020: R+23.9 2016: R+34.8 2012: R+33.5 2008: R+38.2
Not yet ingested
- Civics
- —
Market trends
- HPI YoY
- ▼ -25.90%
- Current HPI
- 172.4771
- Rent YoY
- —
- Metro
- Memphis, TN-MS-AR
- State GDP YoY
- —
- F500 in state
- 0
Price history
+98.7% since first listed9 events — show timeline
- 2026-04-22 Price Changed $315,000 MLSU
- 2026-04-08 Price Changed $320,000 MLSU
- 2026-03-10 Listed $325,000 MLSU
- 2021-10-11 Listing Removed — MLSU
- 2019-10-31 Sold (Public Records) — Public Records
- 2011-07-29 Listing Removed — MLSU
- 2011-07-29 Listed $162,900 MLSU
- 2009-12-08 Sold (Public Records) — Public Records
- 2009-11-25 Listed $158,500 MLSU
Property tax history
+13.9%/yrLatest (2025): $2,295 · +16.4% YoY. Source: county tax records.
Cash-flow waterfall
monthlySold comps — $/sqft
last 12 mo · ≤1 miLoading sold comps…