 🏗️ New Construction
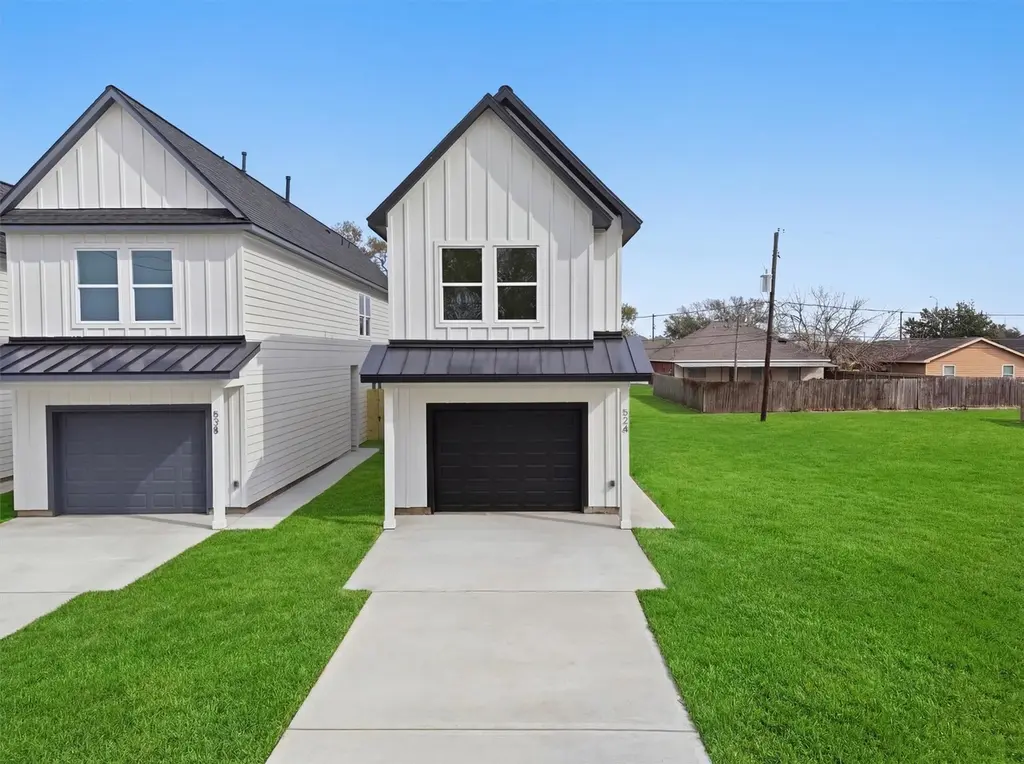
524 N 4th St · La Porte, TX
Flood risk No data
- FEMA flood zone
- —
- Chance of flooding over 30 yrs
- —
- Est. flood insurance / yr
- —
Fire risk No data
- Est. fire insurance / yr
- —
Heat risk No data
- Hot days now (above threshold)
- —
- Hot days in 30 yrs
- —
Wind risk No data
- Chance of severe wind over 30 yrs
- —
Air-quality risk No data
- Unhealthy air days now
- —
- Unhealthy air days in 30 yrs
- —
Risk factors via First Street. Map © Google.
Why this score? — see what drove the F grade
The composite is a weighted blend of 9 inputs, each scored 0–100. Each bar is that input's sub-score; the figure is the points it added to the 100-point composite (weight × sub-score).
- Cash flow +9.4/30.0
- ARV discount +7.5/15.0
- Schools +3.9/10.0
- Livability +3.5/5.0
- Rent growth +3.2/5.0
- DSCR +2.6/10.0
- Condition / age +2.5/5.0
- 1% rule +1.6/10.0
- Appreciation +0.0/10.0
$249,900
🖨 Deal sheet 📄 Offer letter ✓ Due diligence
Listing remarks
New Construction in the Heart of La Porte! Welcome to this beautifully crafted new construction home offering 3 spacious bedrooms, 2.5 bathrooms, and a thoughtfully designed floor plan that blends comfort, style, and functionality. The open-concept living area creates the perfect space for both everyday living and entertaining, while the private garage and modern finishes add convenience and curb appeal. Upstairs, the well-designed bedroom layout provides privacy and flexibility for families, guests, or a home office. Ideally located in the heart of La Porte and zoned to highly regarded La Porte ISD, this home offers easy access to major highways, schools, shopping, dining, and local attrac
Key facts
- New construction
- Private garage
- Modern finishes
Tags
Property features AI
Exterior
- Parking: Attached garage (1-car)
- Utilities: Public water; Public sewer
- Home design: Residential property; New construction (2026); Slab foundation
- Construction: Cement, vinyl, and wood siding; Composition roof; Built in 2026
- Exterior features: Cleared lot
Interior
- Kitchen: Dishwasher; Electric oven; Electric range; Garbage disposal; Microwave
- Bedrooms: Primary bedroom on second floor; Bedroom on second floor; Bedroom on second floor
- Bathrooms: 2 full bathrooms; 1 half bathroom
- Heating & cooling: Central electric heating; Central electric air conditioning
- Interior features: Double vanity; Kitchen island; Kitchen/family room combo; Primary bedroom with private bath; Tub with shower; Ceiling fans; Kitchen/dining combo; Living/dining room
- Laundry & utility: Washer hookup; Gas dryer hookup
Neighborhood map
What this means for you Summary
Snapshot
- This is a 3-bed/2.5-bath land listed at $250k.
Deal economics
- At list price, monthly cash flow is $-212 ($-3k/yr) — negative.
- The deal already cash-flows at list — no discount required.
- To meet the 1% rule (rent ≥ 1% of price), the offer needs to be $194k (22.3% below list).
- Recommended offer: $194k (22.3% below list) — sets the bar for 1% rule.
- Cap rate 5.4% vs local median 3.4% in La Porte — top-decile yield for the area; either an underpriced asset or a hidden risk that comps aren't pricing in. Stress-test before assuming the spread holds.
Location & tenants
- Location reads 70/100 on livability (#360 in TX) — a middle-class / working-renter tenant base. Strengths: cost of living A+, housing A+, crime A-; Watch: amenities F, commute F, health & safety F.
- La Porte ISD (suburban): math 41% / reading 44% proficiency, ranked #260 of 826 in TX (top 32%) — families likely to look elsewhere, expect single-tenant / working-renter base with shorter leases.
- Zoned schools: La Porte J H (math 41% / reading 43%, grade D-, #572 of 1,662 statewide, top 36%, 527 students, 65% FRL); La Porte H S (math 24% / reading 46%, grade F, #954 of 1,632 statewide, top 59%, 2,069 students, 51% FRL).
- Market conditions: Rents rising (+2.8%/yr); 337 active listings in the ZIP; 3 comparable units currently listed for rent nearby; rentals at typical pace (median 24d on market — plan ~3-4 weeks tenant-placement turnaround); solid renter incomes; 29,883 units permitted in Harris County in 2024 (8,621 in 5+ unit buildings).
Forward outlook
- Local home prices are declining (-3.0%/yr); year-one equity from $2k of loan paydown is wiped out by about $9k of value loss. Plan a longer hold.
- Harris County population projected at +47% by 2050 — long-run rental-demand tailwind backs the buy-and-hold thesis.
Negotiation context
- Only 13 days on market — expect competitive offers; lowballing is unlikely to land.
- 4 sale attempts with the ask held roughly flat each time — persistent listings suggest the price (not the market) is what's stuck; bring a comps-based counter.
Questions for the listing agent
- What do current leases actually rent for vs. the listed asking? Can we see a recent rent roll and the last 12 months of T-12 income?
- Is there a deadline driving the sale (1031 exchange, divorce, estate, relocation)? That informs how much negotiation room exists.
- Schools are D-rated, which usually means shorter tenancies and higher turnover. Who's the typical renter profile here, and what's been the actual vacancy rate?
- The area grade is low — what's the realistic commute time and amenity access for the typical tenant pool here? Any planned neighborhood developments (good or bad) we should know about?
- What's the average days-on-market for RENTAL listings here right now (not sales)? A rising rental-DOM trend means longer vacancies and softer asking-rent achievability than the comps imply.
- What's the recent tenant-quality profile in this submarket — average credit score on applications, eviction rate, late-payment / NSF rate, and stable-employment percentage? A property-management company in the area should have these aggregated.
- How much new for-sale + rental construction is in the pipeline within 1–3 miles? Heavy new supply typically softens prices + rents 12–24 months out; constrained supply supports both.
Investment metrics
- 1% rule
- 0.66% ✗
- Cap rate
- 5.43%
- Cash-on-cash
- -3.09%
- DSCR
- 0.86
- GRM
- 12.6
CMA / ARV
- ARV (median comp)
- $294,188
- List price
- $249,900
- Delta
- -11.96%
- Verdict
- UNDERPRICED
- Comps
- 20 within 1.0 mi
Projected returns pro-forma
-3.0% appreciation · 2.81% rent growth · sell at horizon
- IRR
- -21.7%
- Equity multiple
- 0.25×
- Total profit
- $-61,701
- Equity at exit
- $43,864
- IRR
- -16.0%
- Equity multiple
- 0.11×
- Total profit
- $-73,241
- Equity at exit
- $25,436
Cash invested: $82,373 (down + closing). Projections, not guarantees.
Landlord ↔ Tenant lean methodology
- Overall (STATE)
- 87 Strongly Landlord-Friendly
- State Texas
- 87 Strongly Landlord-Friendly · R+5
- County
- — inherits STATE
- City
- — inherits STATE
ZIP-level market 77571
- Home prices YoY
- -28.9%
- Rents YoY
- 2.8%
- Active inventory
- 337
- Price-to-rent
- 10.7×
Monthly cashflow live
- Estimated rent
- $1,941 medium interval (Pro) →
- Mortgage (P&I)
- −$1,543
- Tax from tax record
- −$80 /mo · $959/yr
- Insurance
- −$123
- HOA
- −$0
- Vacancy / Maint / Mgmt
- −$408
- Net cashflow
- $-212
Break-even live
UW: 25.0% down · 7.5% · 30yr · 1.5% tax · 5.0% vac · 8.0% maint · 8.0% mgmt
Financing live
Cash to close
- Down payment
- $73,547
- Closing costs
- $8,826
- Reserves months
- —
- Total cash needed
- —
Loan-product check · same deal, 3 products live
Conventional
25% down · 7.5% · 30yr
- Down + closing
- —
- Monthly P&I
- —
- Monthly cashflow
- —
- DSCR
- —
- Eligible?
- —
Personal DTI + credit; lowest rate.
DSCR
20% down · 8.5% · 30yr
- Down + closing
- —
- Monthly P&I
- —
- Monthly cashflow
- —
- DSCR
- —
- Eligible?
- —
No personal income docs; deal must DSCR.
Hard money
10% down · 12.0% · 12mo
- Down + closing
- —
- Monthly P&I
- —
- Monthly cashflow
- —
- DSCR
- —
- Eligible?
- —
Short-term bridge; refi at stabilization.
Rent comps 3 comps
| Address | Beds | Baths | Sqft | Rent | $/sqft | DOM | Units | Dist |
|---|---|---|---|---|---|---|---|---|
| 218 S 6th St La Porte, TX | 3.0 | 2.0 | 1500 | $1,925 | $1.28 | 43d | 1 | 0.64mi |
| 319 S 6th St La Porte, TX | 4.0 | 2.0 | 1812 | $1,795 | $0.99 | 24d | 1 | 0.71mi |
| 803 S 4th St La Porte, TX | 4.0 | 1.5 | 1688 | $1,700 | $1.01 | 5d | 1 | 1.09mi |
Listing history 21 events
-
2026-06-18days on market $249,900 Active 13 DOM
-
2026-06-17days on market $249,900 Active 12 DOM
-
2026-06-16days on market $249,900 Active 11 DOM
-
2026-06-15days on market $249,900 Active 10 DOM
-
2026-06-13days on market $249,900 Active 8 DOM
-
2026-06-09days on market $249,900 Active 4 DOM
-
2026-06-08days on market $249,900 Active 3 DOM
-
2026-06-07remarks 699-char remark
-
2026-06-07pricedays on market $249,900 Active 2 DOM
-
2026-06-04days on market $259,000 Active 59 DOM
-
2026-06-03days on market $259,000 Active 58 DOM
-
2026-06-02days on market $259,000 Active 57 DOM
-
2026-06-01days on market $259,000 Active 56 DOM
-
2026-05-31days on market $259,000 Active 55 DOM
-
2026-05-13price $259,000 598-char remark
-
2026-04-06$264,000 Active 598-char remark
-
2026-04-06historical
-
2026-03-30price $274,000
-
2026-03-14$279,000 Active
-
2026-03-14historical
-
2026-02-03$289,000 Active
ⓘ Source: listings_history table (triggers on properties + properties_extension) + one-shot
backfill from property_details.listing_events for pre-trigger history.
Tax reassessment forecast TX · Resets to sale price
- Current annual tax
- $959 · $80/mo
- Projected year-2 tax
- $4,573 · $381/mo
- Expected delta
- +$3,614/yr (+$301/mo · 376.8%)
ⓘ Screening estimate from a state-policy table — verify with the county assessor before closing.
Nearby sold comps map
Loading sold comps map…
Walkable amenities ~0.75 mi
Loading nearby amenities…
Taxation est. · year 1
- Rental income
- $23,288
- − Mortgage interest
- −$16,479
- − Property taxes
- −$959
- − Insurance
- −$1,471
- − Repairs & maintenance
- −$1,863
- − Management
- −$1,863
- − Depreciation
- −$8,558
- Taxable loss
- −$7,906
- Est. tax savings @ 24.0%
- +$1,897
- After-tax cash flow
- $-648/yr
For passive investors: Depreciation is non-cash, so a rental often shows a tax loss while cash-flowing — sheltering income. Rental losses are passive: they offset passive income freely, and up to $25,000/yr can offset ordinary (W-2) income if you actively participate and your MAGI is under $100k (phasing out to $0 by $150k); unused losses carry forward. On sale, claimed depreciation is recaptured at up to 25%, and gains may owe capital-gains tax (a 1031 exchange can defer both). Figures are a year-1 estimate at your 24.0% rate — not tax advice; consult a CPA.
Schools (NCES district)
- District
- La Porte ISD
- NCES district ID
- 4826190
- Math proficiency
- 41% ▼ -10.00%
- Reading proficiency
- 44% ▼ -4.00%
- Median HH income
- $71,841
- Composite
- 38.65/100
- National rank
- #4151
- State rank
- #260 of 826 in TX
Livability — La Porte
- Score
- 70/100
- State rank
- #360
- US rank
- #7754
Category grades
Schools grade is shown separately in the Schools card above.
Census & demographics
- Census place
- La Porte, TX
- County
- Harris County · 4,702,590 people
- City population
- 38,543
- Metro
- Houston-The Woodlands-Sugar Land, TX
- Population (ZIP)
- 38,543
- Household income
- $81,850
- Rent vs Own
- Severe rent burden
- 1176.0
Population outlook (Harris County) Hauer SSP2
- Today (2025)
- 5,571,493 people
- By 2030
- 6,089,821 · +9.3%
- By 2040
- 7,142,806 · +28.2%
- By 2050
- 8,185,864 · +46.9%
- By 2075
- 10,574,329 · +89.8%
- By 2100
- 12,109,958 · +117.4%
Race, ethnicity, and origin ACS 2023
- Neighborhood character
- Diverse neighborhood (Simpson 0.60)
- Race & ethnicity
- White 51% Hispanic / Latino 36% Two or more races 20% Black 8% Asian 1%
- Hispanic origin (detail)
- Mexican 31%
- Common ancestry
- Italian 4% Lithuanian 3% Iranian 1%
- Foreign-born
- 10% · Canada, Vietnam
- Languages at home
- 77% English-only · Spanish 21% Other Indo-European 1%
Political lean MEDSL · Harris
- 2024 margin
- Lean D (+5.5) · D 52.0% · R 46.4% · Other 1.6%
- 2008→2024 swing
- +3.9pp toward D · 2008: 1.6pp · 2024: 5.5pp
- All cycles
- 2024: D+5.5 2020: D+13.3 2016: D+12.4 2012: D+0.1 2008: D+1.6
Not yet ingested
- Civics
- —
Market trends
- HPI YoY
- ▼ -103.81%
- Current HPI
- 255.0768
- Rent YoY
- ▲ 2.81%
- Metro
- Houston-The Woodlands-Sugar Land, TX
- State GDP YoY
- ▲ 3.95%
- F500 in state
- 110
Industry mix (Fortune 500 HQ in TX)
| Industry | F500 HQs | Revenue |
|---|---|---|
| Energy | 16 | $1,198B |
|
||
| Technology | 5 | $198B |
|
||
| Engineering / Construction | 4 | $72B |
|
||
| Energy Services | 3 | $60B |
|
||
| Utilities | 3 | $41B |
|
||
| Healthcare | 2 | $330B |
|
||
Price history
-13.5% since first listed9 events — show timeline
- 2026-06-05 Listed $249,900 HARMLS
- 2026-06-04 Listing Removed — HARMLS
- 2026-05-13 Price Changed $259,000 HARMLS
- 2026-04-06 Listing Removed — HARMLS
- 2026-04-06 Listed $264,000 HARMLS
- 2026-03-30 Price Changed $274,000 HARMLS
- 2026-03-14 Listing Removed — HARMLS
- 2026-03-14 Listed $279,000 HARMLS
- 2026-02-03 Listed $289,000 HARMLS
Property tax history
+11.5%/yrLatest (2025): $959 · +11.5% YoY. Source: county tax records.
Cash-flow waterfall
monthlySold comps — $/sqft
last 12 mo · ≤1 miLoading sold comps…