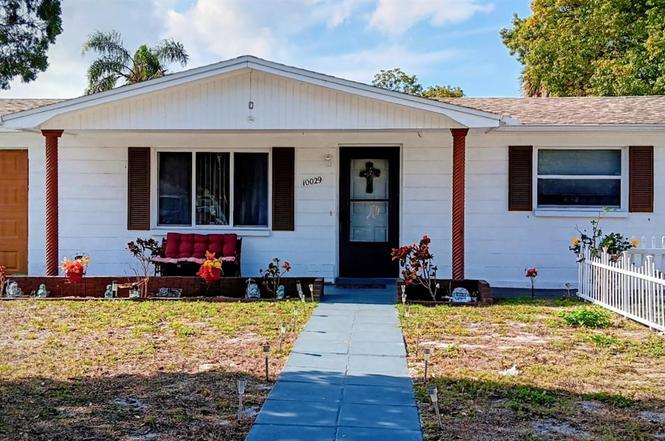
10029 Brandywine Ave · Jasmine Estates, FL
Flood risk 5/10 · Moderate
- FEMA flood zone
- X (shaded)
- Chance of flooding over 30 yrs
- 0.5%
- Est. flood insurance / yr
- $507 – $1,088
Fire risk 6/10 · Moderate
- Est. fire insurance / yr
- $947 – $1,759
Heat risk 10/10 · Severe
- Hot days now (above 109°F)
- 7 days/yr
- Hot days in 30 yrs
- 27 days/yr
Wind risk 10/10 · Severe
- Chance of severe wind over 30 yrs
- 99.0%
Air-quality risk 2/10 · Minimal
- Unhealthy air days now
- 1 days/yr
- Unhealthy air days in 30 yrs
- 3 days/yr
Risk factors via First Street. Map © Google.
Why this score? — see what drove the F grade
The composite is a weighted blend of 9 inputs, each scored 0–100. Each bar is that input's sub-score; the figure is the points it added to the 100-point composite (weight × sub-score).
- Cash flow +13.3/30.0
- Schools +4.3/10.0
- DSCR +4.0/10.0
- Livability +3.4/5.0
- Rent growth +2.8/5.0
- 1% rule +2.5/10.0
- Condition / age +2.5/5.0
- ARV discount +0.7/15.0
- Appreciation +0.0/10.0
$215,000
🖨 Deal sheet 📄 Offer letter ✓ Due diligence
Listing remarks
Turn-Key perfection. This stunning home features ceramic tile and a fresh coat of paint. You will love the fully remolded bathroom and the added convenience of a private half bathroom and small office. Big-Ticket New AC unit and Water Softener. The entire property is protected by a great security system and pay no fees. Enjoy the outdoors with this lovely spacious fenced in back yard for entertaining. Close to downtown New Port Richey and Sims Park. Sims Park is a great park to take your furry pets and family. Don`t just take my word, come and see for yourself. Call today before it is gone. SELLER IS VERY MOTIVATED
Key facts
- New ac unit
- Security system
- Water softener
Tags
Property features AI
Finance
- Other: Property type: Residential - Single Family Residence; Zoning: R4; Lot approximately 0.12 acre (about 0.12 acres); Living area reported as 792 square feet
- Financial info: Homestead exempt
- HOA & community: No HOA association indicated; Development: Not Assigned
Exterior
- Parking: Driveway; Off-street parking; Attached garage (1 space); Garage accessed from rear
- Security: Private mailbox
- Utilities: Public water; Public sewer; Electricity connected; Cable connected
- Home design: Single-family residence; One story; Faces east
- Construction: Block construction; Shingle roof; Block foundation; Built on one level
- Exterior features: Porch; Sliding doors; Private mailbox; Sidewalk; Paved lot
Interior
- Kitchen: Microwave; Refrigerator
- Bedrooms: 2 bedrooms
- Flooring: Ceramic tile; Tile flooring
- Bathrooms: 1 full bath; 1 half bath
- Heating & cooling: Central heating; Central air conditioning
- Interior features: Ceiling fans; Thermostat; Window treatments; Florida room
- Laundry & utility: Washer hookup inside; Washer included; Electric water heater; Water softener
Neighborhood map
What this means for you Summary
Snapshot
- This is a 2-bed/1.0-bath single-family listed at $215k.
Deal economics
- At list price, monthly cash flow is $1 ($10/yr) — positive.
- The deal already cash-flows at list — no discount required.
- To meet the 1% rule (rent ≥ 1% of price), the offer needs to be $161k (25.0% below list).
- Recommended offer: $161k (25.0% below list) — sets the bar for 1% rule.
- Cap rate 6.3% vs local median 4.7% in Jasmine Estates — top-decile yield for the area; either an underpriced asset or a hidden risk that comps aren't pricing in. Stress-test before assuming the spread holds.
Location & tenants
- Location reads 67/100 on livability (#555 in FL) — a middle-class / working-renter tenant base. Strengths: cost of living A+, housing A+, health & safety A+; Watch: crime D+, amenities F, commute F.
- Pasco (suburban): math 50% / reading 52% proficiency, ranked #32 of 73 in FL (top 44%) — acceptable for families but not a draw, mixed tenant base, ~2y average lease.
- Zoned schools: Fox Hollow Elementary School (math 21% / reading 25%, grade F, #2,070 of 2,144 statewide, top 97%, 653 students, 88% FRL); Gulf High School (math 32% / reading 34%, grade F, #406 of 667 statewide, top 61%, 1,465 students, 76% FRL) — zoned schools average 82% FRL vs 48% district-wide (34 pts higher); higher-poverty schools than district average — tighter screening recommended.
- Zoned-school proficiency averages 28% at this address vs 51% district-wide (-23 pts) — the specific schools serving this property underperform the Pasco average; the district grade overstates school quality for this exact location.
- Market conditions: Rents rising (+1.3%/yr); 577 active listings in the ZIP; 40 comparable units currently listed for rent nearby; rentals at typical pace (median 24d on market — plan ~3-4 weeks tenant-placement turnaround); 6,765 units permitted in Pasco County in 2024 (1,250 in 5+ unit buildings).
- This rent runs 41% of the median local income ($47k/yr) — at the standard rent-burdened threshold; future hikes will face affordability resistance.
Forward outlook
- Local home prices are declining (-3.0%/yr); year-one equity from $1k of loan paydown is wiped out by about $6k of value loss. Plan a longer hold.
- Pasco County population projected at +29% by 2050 — long-run rental-demand tailwind backs the buy-and-hold thesis.
Negotiation context
- It's been on market 152 days — a 12% lower offer ($189k) is reasonable based on typical stale-listing flexibility.
Risks & watch-outs
- Climate carrying-cost: moderate flood risk; severe wind risk, 99% chance of damaging wind over 30y; major wildfire risk; extreme-heat days projected 7→27/yr by 2055 (HVAC capex compounding) — expect insurance premiums to compound above CPI over the hold.
Questions for the listing agent
- It's been on market 152 days. Have you received any prior offers? Is the seller open to a 25% concession, seller financing, or rate buy-down credit?
- Built in 1973 — when were the roof, HVAC, electrical panel, plumbing, and water heater last replaced?
- Why hasn't it sold? Are there any deal-killer items the seller is aware of (foundation, flood, title, zoning, code violations)?
- Is there a deadline driving the sale (1031 exchange, divorce, estate, relocation)? That informs how much negotiation room exists.
- Schools are F-rated, which usually means shorter tenancies and higher turnover. Who's the typical renter profile here, and what's been the actual vacancy rate?
- Crime grade is D in this area — have there been break-ins, vandalism, or insurance claims at this property in the last 3 years? What carrier currently insures it and at what premium?
- The area grade is low — what's the realistic commute time and amenity access for the typical tenant pool here? Any planned neighborhood developments (good or bad) we should know about?
- What's the average days-on-market for RENTAL listings here right now (not sales)? A rising rental-DOM trend means longer vacancies and softer asking-rent achievability than the comps imply.
- What's the recent tenant-quality profile in this submarket — average credit score on applications, eviction rate, late-payment / NSF rate, and stable-employment percentage? A property-management company in the area should have these aggregated.
- How much new for-sale + rental construction is in the pipeline within 1–3 miles? Heavy new supply typically softens prices + rents 12–24 months out; constrained supply supports both.
Investment metrics
- 1% rule
- 0.75% ✗
- Cap rate
- 6.30%
- Cash-on-cash
- 0.02%
- DSCR
- 1.00
- GRM
- 11.1
CMA / ARV
- ARV (on-the-fly)
- $186,912
- Comps found
- 12
Show comp detail 12 sales within ~0.75 mi
| Address | Dist | Beds/Ba | Sqft | Sold | Price | $/sf | Match |
|---|---|---|---|---|---|---|---|
| 10135 Old Hickory Ln | 0.18mi | 2/1.0 | 792 (0%) | 1mo | $128,000 | $162 | 91 |
| 7235 Deerfield Dr | 0.20mi | 2/1.0 | 840 (+6%) | 6mo | $151,100 | $180 | 76 |
| 10245 Regency Park Blvd | 0.17mi | 2/1.0 | 744 (-6%) | 12mo | $175,000 | $235 | 72 |
| 6919 Kingston Ct | 0.28mi | 2/1.0 | 846 (+7%) | 7mo | $235,000 | $278 | 70 |
| 10029 Freestone Ln | 0.26mi | 2/1.0 | 840 (+6%) | 9mo | $239,900 | $286 | 70 |
| 7311 Brentwood Dr | 0.26mi | 2/1.0 | 846 (+7%) | 9mo | $200,000 | $236 | 69 |
| 10028 Kingswood Ln | 0.24mi | 2/1.5 | 840 (+6%) | 10mo | $205,000 | $244 | 69 |
| 7234 Heath Dr | 0.27mi | 2/2.0 | 867 (+10%) | 7mo | $180,000 | $208 | 62 |
| 7322 Oak Crest Dr | 0.30mi | 2/2.0 | 903 (+14%) | 4mo | $250,000 | $277 | 56 |
| 7804 Fox Hollow Dr | 0.71mi | 2/1.0 | 744 (-6%) | 2mo | $222,500 | $299 | 55 |
| 10609 Raffia Dr | 0.57mi | 2/1.0 | 900 (+14%) | 1mo | $185,000 | $206 | 50 |
| 9426 Glen Moor Ln | 0.71mi | 2/2.0 | 898 (+13%) | 1mo | $200,000 | $223 | 40 |
Match score weights: distance 35% · size 25% · config 20% · recency 20%. Top-matched comps best support the ARV.
Projected returns pro-forma
-3.0% appreciation · 1.28% rent growth · sell at horizon
- IRR
- -18.0%
- Equity multiple
- 0.37×
- Total profit
- $-37,640
- Equity at exit
- $32,057
- IRR
- -13.5%
- Equity multiple
- 0.27×
- Total profit
- $-44,024
- Equity at exit
- $18,589
Cash invested: $60,200 (down + closing). Projections, not guarantees.
Landlord ↔ Tenant lean methodology
- Overall (STATE)
- 87 Strongly Landlord-Friendly
- State Florida
- 87 Strongly Landlord-Friendly · R+3
- County
- — inherits STATE
- City
- — inherits STATE
ZIP-level market 34668
- Home prices YoY
- -17.4%
- Rents YoY
- 1.3%
- Active inventory
- 577
- Price-to-rent
- 11.1×
Monthly cashflow live
- Estimated rent
- $1,613 high interval (Pro) →
- Mortgage (P&I)
- −$1,127
- Tax from tax record
- −$57 /mo · $681/yr
- Insurance
- −$90
- HOA
- −$0
- Vacancy / Maint / Mgmt
- −$339
- Net cashflow
- $1
Break-even live
UW: 25.0% down · 7.5% · 30yr · 1.5% tax · 5.0% vac · 8.0% maint · 8.0% mgmt
Financing live
Cash to close
- Down payment
- $53,750
- Closing costs
- $6,450
- Reserves months
- —
- Total cash needed
- —
Loan-product check · same deal, 3 products live
Conventional
25% down · 7.5% · 30yr
- Down + closing
- —
- Monthly P&I
- —
- Monthly cashflow
- —
- DSCR
- —
- Eligible?
- —
Personal DTI + credit; lowest rate.
DSCR
20% down · 8.5% · 30yr
- Down + closing
- —
- Monthly P&I
- —
- Monthly cashflow
- —
- DSCR
- —
- Eligible?
- —
No personal income docs; deal must DSCR.
Hard money
10% down · 12.0% · 12mo
- Down + closing
- —
- Monthly P&I
- —
- Monthly cashflow
- —
- DSCR
- —
- Eligible?
- —
Short-term bridge; refi at stabilization.
Rent comps 40 comps
| Address | Beds | Baths | Sqft | Rent | $/sqft | DOM | Units | Dist |
|---|---|---|---|---|---|---|---|---|
| 7040 Brentwood Dr Unit NA Port Richey, FL | 2.0 | 1.0 | 880 | $1,600 | $1.82 | 20d | 1 | 0.15mi |
| 7325 Ivanhoe Dr Port Richey, FL | 3.0 | 1.0 | 984 | $1,800 | $1.83 | 10d | 1 | 0.44mi |
| 10401 Oleander Dr Port Richey, FL | 2.0 | 1.0 | 887 | $1,250 | $1.41 | 24d | 1 | 0.52mi |
| 6935 Twilite Dr Port Richey, FL | 2.0 | 1.0 | 1032 | $1,450 | $1.41 | 16d | 1 | 0.57mi |
| 7110 Tudor Ln Port Richey, FL | 1.0 | 1.0 | 676 | $1,310 | $1.94 | 24d | 1 | 0.66mi |
| 7110 Tudor Ln Port Richey, FL | 1.0 | 1.0 | 676 | $1,310 | $1.94 | 2d | 1 | 0.66mi |
| 10225 Gardenia Ln Port Richey, FL | 3.0 | 1.0 | 1042 | $1,495 | $1.43 | 14d | 1 | 0.71mi |
| 10303 Gardenia Ln Port Richey, FL | 3.0 | 2.0 | 1054 | $1,950 | $1.85 | 24d | 1 | 0.73mi |
| 9826 Pocono St Port Richey, FL | 2.0 | 2.0 | 1072 | $1,650 | $1.54 | 24d | 1 | 0.79mi |
| 7438 Coventry Dr Port Richey, FL | 2.0 | 1.0 | 985 | $1,600 | $1.62 | 12d | 1 | 0.80mi |
| 10803 Hyssop St Port Richey, FL | 3.0 | 1.0 | 1120 | $1,500 | $1.34 | 10d | 1 | 0.83mi |
| 7808 Talisman Dr Port Richey, FL | 3.0 | 2.0 | 1063 | $2,100 | $1.98 | 24d | 1 | 0.90mi |
| 9919 Aquarius Dr Unit 6 Port Richey, FL | 2.0 | 1.0 | 950 | $1,440 | $1.52 | 24d | 1 | 0.90mi |
| 9911 Aquarius Dr Unit 8 Port Richey, FL | 2.0 | 1.0 | 950 | $1,440 | $1.52 | 24d | 1 | 0.90mi |
| 8019 Portage Dr Port Richey, FL | 2.0 | 2.0 | 1078 | $2,000 | $1.86 | 16d | 1 | 0.91mi |
| 9901 Aquarius Dr Unit 8 Port Richey, FL | 2.0 | 1.0 | 950 | $1,440 | $1.52 | 24d | 1 | 0.91mi |
| 7839 Canna Dr Port Richey, FL | 2.0 | 2.0 | 1095 | $1,450 | $1.32 | 10d | 1 | 0.91mi |
| 9926 Grace Dr Port Richey, FL | 2.0 | 1.0 | 950 | $1,442 | $1.52 | 20d | 4 | 0.91mi |
| 9900 Grace Dr Port Richey, FL | 2.0 | 1.5 | 950 | $1,763 | $1.86 | 24d | 1 | 0.93mi |
| 9615 Gray Fox Ln Port Richey, FL | 2.0 | 1.0 | 744 | $1,550 | $2.08 | 3d | 1 | 0.93mi |
| 9202 Suffolk Ln Port Richey, FL | 2.0 | 2.0 | 1038 | $1,450 | $1.40 | 24d | 1 | 0.95mi |
| 9202 Suffolk Ln Port Richey, FL | 2.0 | 2.0 | 1038 | $1,450 | $1.40 | 14d | 1 | 0.95mi |
| 10502 Laburnum Dr Port Richey, FL | 2.0 | 2.0 | 1002 | $1,545 | $1.54 | 24d | 1 | 0.97mi |
| 9110 Saint Clair Ln Port Richey, FL | 2.0 | 2.0 | 730 | $2,100 | $2.88 | 24d | 1 | 1.01mi |
| 9035 Cochise Ln Port Richey, FL | 3.0 | 2.0 | 1095 | $1,395 | $1.27 | 14d | 1 | 1.01mi |
| 11031 Hassle Ave Port Richey, FL | 3.0 | 1.0 | 1006 | $1,595 | $1.59 | 24d | 1 | 1.02mi |
| 10802 Laburnum Dr Port Richey, FL | 2.0 | 2.0 | 1002 | $1,545 | $1.54 | 24d | 1 | 1.07mi |
| 11103 Harding Dr Unit 2 Port Richey, FL | 2.0 | 1.0 | 760 | $1,450 | $1.91 | 20d | 1 | 1.07mi |
| 9210 Pegasus Ave Port Richey, FL | 2.0 | 1.5 | 768 | $1,400 | $1.82 | 4d | 1 | 1.11mi |
| 6431 Citation Dr Port Richey, FL | 3.0 | 1.0 | 1009 | $1,681 | $1.67 | 4d | 1 | 1.11mi |
| 7213 Seward Dr Port Richey, FL | 2.0 | 1.0 | 700 | $1,500 | $2.14 | 24d | 1 | 1.13mi |
| 8151 Hixton Dr Port Richey, FL | 3.0 | 1.0 | 1080 | $1,699 | $1.57 | 16d | 1 | 1.17mi |
| 8026 Colrain Dr Port Richey, FL | 3.0 | 1.0 | 1080 | $1,545 | $1.43 | 24d | 1 | 1.19mi |
| 9310 Whitman Ln Port Richey, FL | 3.0 | 1.0 | 980 | $1,350 | $1.38 | 11d | 1 | 1.26mi |
| 9300 Whitman Ln Port Richey, FL | 3.0 | 1.0 | 920 | $1,695 | $1.84 | 24d | 1 | 1.28mi |
| 8247 Saybrook Dr Port Richey, FL | 3.0 | 1.0 | 980 | $1,550 | $1.58 | 23d | 1 | 1.29mi |
| 6731 Sandra Dr Port Richey, FL | 2.0 | 1.0 | 816 | $1,575 | $1.93 | 24d | 1 | 1.30mi |
| 8422 Paxton Dr Port Richey, FL | 2.0 | 1.0 | 744 | $1,800 | $2.42 | 24d | 1 | 1.32mi |
| 9103 Westby Ln Port Richey, FL | 2.0 | 1.0 | 840 | $1,995 | $2.38 | 24d | 1 | 1.35mi |
| 8437 Luray Dr Port Richey, FL | 2.0 | 1.0 | 1038 | $1,595 | $1.54 | 4d | 1 | 1.40mi |
Listing history 15 events
-
2026-06-18days on market $215,000 Active 152 DOM
-
2026-06-17days on market $215,000 Active 151 DOM
-
2026-06-16days on market $215,000 Active 150 DOM
-
2026-06-15days on market $215,000 Active 149 DOM
-
2026-06-13days on market $215,000 Active 147 DOM
-
2026-06-09days on market $215,000 Active 143 DOM
-
2026-06-08days on market $215,000 Active 142 DOM
-
2026-06-07days on market $215,000 Active 141 DOM
-
2026-06-04days on market $215,000 Active 138 DOM
-
2026-06-03days on market $215,000 Active 137 DOM
-
2026-06-02days on market $215,000 Active 136 DOM
-
2026-06-01days on market $215,000 Active 135 DOM
-
2026-05-31days on market $215,000 Active 134 DOM
-
2026-03-03price $215,000
-
2026-01-17$225,000 Active
ⓘ Source: listings_history table (triggers on properties + properties_extension) + one-shot
backfill from property_details.listing_events for pre-trigger history.
Tax reassessment forecast FL · Resets to sale price
- Current annual tax
- $681 · $57/mo
- Projected year-2 tax
- $1,784 · $149/mo
- Expected delta
- +$1,103/yr (+$92/mo · 161.9%)
ⓘ Screening estimate from a state-policy table — verify with the county assessor before closing.
Climate risk First Street
- Flood 5/10 Major FEMA zone X (shaded) · 50% chance over 30 yrs
- Wildfire 6/10 Major
- Heat 10/10 Extreme 7 d/yr ≥109°F today · 27 d/yr by 30 yrs out
- Wind 10/10 Extreme 99% chance of damaging wind over 30 yrs
- Air quality 2/10 Low 1 unhealthy d/yr today · 3 by 30 yrs out
Nearby sold comps map
Loading sold comps map…
Walkable amenities ~0.75 mi
Loading nearby amenities…
Taxation est. · year 1
- Rental income
- $19,362
- − Mortgage interest
- −$12,043
- − Property taxes
- −$681
- − Insurance
- −$1,075
- − Repairs & maintenance
- −$1,549
- − Management
- −$1,549
- − Depreciation
- −$6,255
- Taxable loss
- −$3,791
- Est. tax savings @ 24.0%
- +$910
- After-tax cash flow
- $919/yr
For passive investors: Depreciation is non-cash, so a rental often shows a tax loss while cash-flowing — sheltering income. Rental losses are passive: they offset passive income freely, and up to $25,000/yr can offset ordinary (W-2) income if you actively participate and your MAGI is under $100k (phasing out to $0 by $150k); unused losses carry forward. On sale, claimed depreciation is recaptured at up to 25%, and gains may owe capital-gains tax (a 1031 exchange can defer both). Figures are a year-1 estimate at your 24.0% rate — not tax advice; consult a CPA.
Schools (NCES district)
- District
- Pasco
- NCES district ID
- 1201530
- Math proficiency
- 50% ▼ -10.00%
- Reading proficiency
- 52% ▼ -5.00%
- Median HH income
- $45,039
- Composite
- 43.14/100
- National rank
- #3074
- State rank
- #32 of 73 in FL
Livability — Jasmine Estates
- Score
- 67/100
- State rank
- #555
- US rank
- #10561
Category grades
Schools grade is shown separately in the Schools card above.
Census & demographics
- Census place
- Jasmine Estates, FL
- County
- Pasco County · 524,098 people
- Metro
- Tampa-St. Petersburg-Clearwater, FL
- Population (ZIP)
- 49,442
- Household income
- $47,401
- Rent vs Own
- Severe rent burden
- 2699.0
Population outlook (Pasco County) Hauer SSP2
- Today (2025)
- 570,045 people
- By 2030
- 605,844 · +6.3%
- By 2040
- 674,806 · +18.4%
- By 2050
- 736,022 · +29.1%
- By 2075
- 862,900 · +51.4%
- By 2100
- 906,364 · +59.0%
Race, ethnicity, and origin ACS 2023
- Neighborhood character
- Predominantly White (70%)
- Race & ethnicity
- White 70% Hispanic / Latino 23% Two or more races 14% Black 4%
- Hispanic origin (detail)
- Mexican 3% Puerto Rican 10% Cuban 5% Dominican 1%
- Common ancestry
- Romanian 3% Lithuanian 3% Slovak 2%
- Foreign-born
- 11% · Canada, Jamaica
- Languages at home
- 82% English-only · Spanish 14% Other Indo-European 1% French/Haitian/Cajun 1%
Political lean MEDSL · Pasco
- 2024 margin
- Strong R (+25.2) · D 36.9% · R 62.1% · Other 1.0%
- 2008→2024 swing
- -21.6pp toward R · 2008: -3.6pp · 2024: -25.2pp
- All cycles
- 2024: R+25.2 2020: R+20.1 2016: R+21.6 2012: R+6.7 2008: R+3.6
Not yet ingested
- Civics
- —
Market trends
- HPI YoY
- ▼ -75.64%
- Current HPI
- 359.7163
- Rent YoY
- ▲ 1.28%
- Metro
- Tampa-St. Petersburg-Clearwater, FL
- State GDP YoY
- ▲ 3.28%
- F500 in state
- 36
Industry mix (Fortune 500 HQ in FL)
| Industry | F500 HQs | Revenue |
|---|---|---|
| Industrial Technology | 2 | $29B |
|
||
| Insurance | 2 | $17B |
|
||
| Retail | 1 | $60B |
|
||
| Technology Distribution | 1 | $58B |
|
||
| Homebuilding | 1 | $35B |
|
||
| Technology Manufacturing | 1 | $35B |
|
||
Price history
-4.4% since first listed2 events — show timeline
- 2026-03-03 Price Changed $215,000 Stellar MLS as Distributed by MLS Grid
- 2026-01-17 Listed $225,000 Stellar MLS as Distributed by MLS Grid
Property tax history
+9.5%/yrLatest (2025): $681 · +2.0% YoY. Source: county tax records.
Cash-flow waterfall
monthlySold comps — $/sqft
last 12 mo · ≤1 miLoading sold comps…