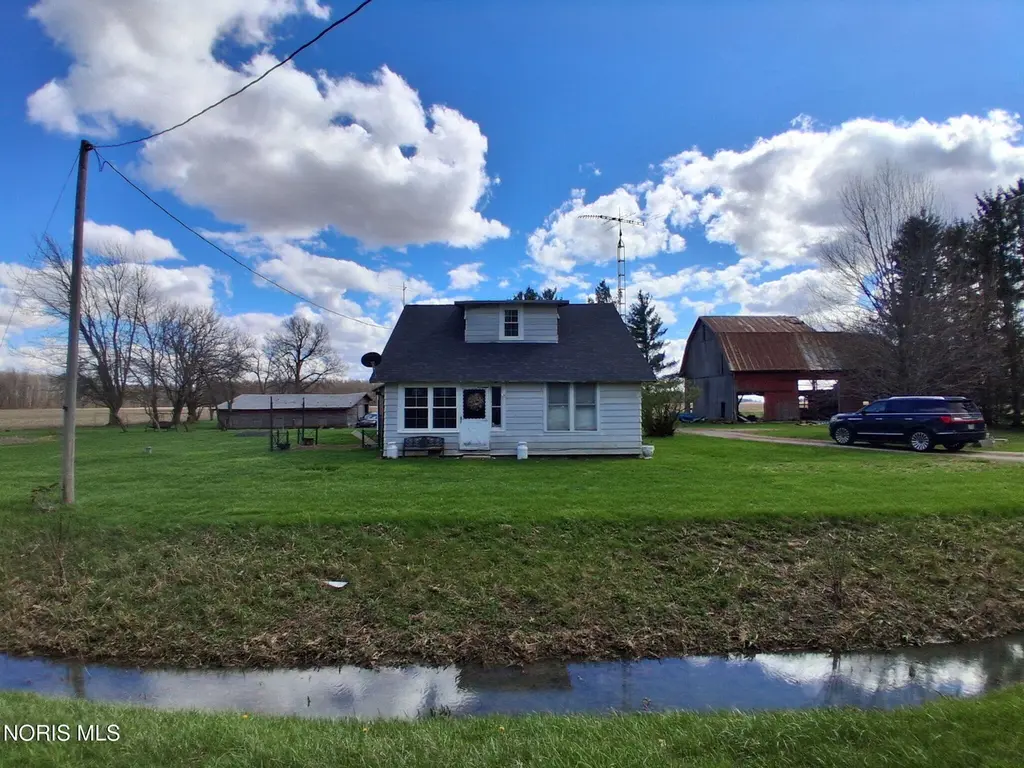
9-531 County Road B · West Leipsic, OH
Flood risk 1/10 · Minimal
- FEMA flood zone
- X (unshaded)
- Chance of flooding over 30 yrs
- 0.0%
- Est. flood insurance / yr
- $507 – $1,088
Fire risk 1/10 · Minimal
- Est. fire insurance / yr
- $713 – $1,323
Heat risk 3/10 · Minor
- Hot days now (above 99°F)
- 7 days/yr
- Hot days in 30 yrs
- 17 days/yr
Wind risk 2/10 · Minimal
- Chance of severe wind over 30 yrs
- 0.0%
Air-quality risk 2/10 · Minimal
- Unhealthy air days now
- 1 days/yr
- Unhealthy air days in 30 yrs
- 2 days/yr
Risk factors via First Street. Map © Google.
Why this score? — see what drove the D+ grade
The composite is a weighted blend of 9 inputs, each scored 0–100. Each bar is that input's sub-score; the figure is the points it added to the 100-point composite (weight × sub-score).
- Cash flow +12.5/30.0
- ARV discount +7.5/15.0
- Schools +5.5/10.0
- Appreciation +4.7/10.0
- DSCR +3.7/10.0
- 1% rule +3.2/10.0
- Livability +3.1/5.0
- Rent growth +2.5/5.0
- Condition / age +2.5/5.0
$109,900
🖨 Deal sheet (PDF) 📄 Offer letter ✓ Due diligence
Listing remarks MLS
Great location on 2.51 acres! This home needs some TLC but has some completed projects and some that are just waiting for your finishing touches. Some building materials are included. If you are looking for a great lot in a quiet spot, this is it!
Key facts
- 2.51 acre lot
- Built 1925
- Listed 72 days
Neighborhood map
What this means for you Summary
Snapshot
- This is a 1-bed/1.0-bath single-family listed at $110k.
Deal economics
- At list price, monthly cash flow is $-16 ($-194/yr) — negative.
- To cash-flow at today's rent, offer at most $107k (2.6% below list).
- To meet the 1% rule (rent ≥ 1% of price), the offer needs to be $90k (18.2% below list).
- Recommended offer: $90k (18.2% below list) — sets the bar for 1% rule.
Location & tenants
- Location reads 62/100 on livability (#869 in OH) — a middle-class / working-renter tenant base. Strengths: cost of living A+, housing A+; Watch: employment D+, crime D, amenities F.
- Leipsic Local (rural): math 65% / reading 65% proficiency, ranked #223 of 656 in OH (top 34%) — acceptable for families but not a draw, mixed tenant base, ~2y average lease.
- Zoned schools: Leipsic Elementary School (math 67% / reading 67%, grade B+, #456 of 1,584 statewide, top 31%, 341 students, 32% FRL); Leipsic High School (math 62% / reading 62%, grade B-, #202 of 781 statewide, top 29%, 363 students, 34% FRL) — zoned schools average 33% FRL vs 55% district-wide (22 pts lower); this property's tenant base skews higher-income than the district average.
- Market conditions: 12 active listings in the ZIP; solid renter incomes; 41 units permitted in Putnam County in 2024 (0 in 5+ unit buildings).
- This rent is only 12% of the median local income ($87k/yr) — well below the 30% rent-burden line; pricing power to push rent on renewal without tenant pushback.
Forward outlook
- In year one you build about $153 of equity ($760 loan paydown + $-607 appreciation (-0.6% local appreciation)).
- Putnam County population projected at -17% by 2050 — secular population decline; favor cash flow + early exit over multi-decade hold.
Negotiation context
- It's been on market 72 days — a 6% lower offer ($103k) is reasonable based on typical stale-listing flexibility.
- 2 sale attempts since 8y ago; this cycle's ask has dropped $20k (15%) from the opening price — seller is motivated, your offer sets the floor, not the list.
- Current owner paid $48k; list at $110k implies a 131% gain — meaningful room to come down on a strong offer.
Risks & watch-outs
- Watch-outs: built in 1925 — expect roof / HVAC / electrical / plumbing capex.
Questions for the listing agent
- What do current leases actually rent for vs. the listed asking? Can we see a recent rent roll and the last 12 months of T-12 income?
- It's been on market 72 days. Have you received any prior offers? Is the seller open to a 18% concession, seller financing, or rate buy-down credit?
- Built in 1925 — when were the roof, HVAC, electrical panel, plumbing, and water heater last replaced?
- Why hasn't it sold? Are there any deal-killer items the seller is aware of (foundation, flood, title, zoning, code violations)?
- Is there a deadline driving the sale (1031 exchange, divorce, estate, relocation)? That informs how much negotiation room exists.
- Schools are D-rated, which usually means shorter tenancies and higher turnover. Who's the typical renter profile here, and what's been the actual vacancy rate?
- Crime grade is D in this area — have there been break-ins, vandalism, or insurance claims at this property in the last 3 years? What carrier currently insures it and at what premium?
- The area grade is low — what's the realistic commute time and amenity access for the typical tenant pool here? Any planned neighborhood developments (good or bad) we should know about?
- What's the average days-on-market for RENTAL listings here right now (not sales)? A rising rental-DOM trend means longer vacancies and softer asking-rent achievability than the comps imply.
- What's the recent tenant-quality profile in this submarket — average credit score on applications, eviction rate, late-payment / NSF rate, and stable-employment percentage? A property-management company in the area should have these aggregated.
- How much new for-sale + rental construction is in the pipeline within 1–3 miles? Heavy new supply typically softens prices + rents 12–24 months out; constrained supply supports both.
Investment metrics
- 1% rule
- 0.82% ✗
- Cap rate
- 6.12%
- Cash-on-cash
- -0.63%
- DSCR
- 0.97
- GRM
- 10.2
CMA / ARV
- ARV (median comp)
- $71,905
- List price
- $109,900
- Delta
- 52.84%
- Verdict
- OVERPRICED
- Comps
- 1 within 2.0 mi
Projected returns pro-forma
-0.55% appreciation · 3.0% rent growth · sell at horizon
- IRR
- -5.1%
- Equity multiple
- 0.77×
- Total profit
- $-7,077
- Equity at exit
- $28,908
- IRR
- 1.2%
- Equity multiple
- 1.12×
- Total profit
- $3,787
- Equity at exit
- $32,434
Cash invested: $30,772 (down + closing). Projections, not guarantees.
Landlord ↔ Tenant lean methodology
- Overall (STATE)
- 73 Landlord-Friendly
- State Ohio
- 73 Landlord-Friendly · R+6
- County
- — inherits STATE
- City
- — inherits STATE
ZIP-level market 45856
- Home prices YoY
- -0.2%
- Active inventory
- 12
- Price-to-rent
- 10.2×
Monthly cashflow live
- Estimated rent
- $899 medium interval (Pro) →
- Mortgage (P&I)
- −$576
- Tax from tax record
- −$104 /mo · $1,251/yr
- Insurance
- −$46
- HOA
- −$0
- Vacancy / Maint / Mgmt
- −$189
- Net cashflow
- $-16
Break-even live
Sensitivity live
| Price | -10% $46 | -5% $15 | +0% $-16 | +5% $-47 | +10% $-78 |
|---|---|---|---|---|---|
| Rent | -10% $-87 | -5% $-52 | +0% $-16 | +5% $19 | +10% $55 |
| Rate | -1.0pp $39 | -0.5pp $12 | base $-16 | +0.5pp $-45 | +1.0pp $-74 |
UW: 25.0% down · 7.5% · 30yr · 1.5% tax · 5.0% vac · 8.0% maint · 8.0% mgmt
Financing live
Cash to close
- Down payment
- $27,475
- Closing costs
- $3,297
- Reserves months
- —
- Total cash needed
- —
Loan-product check · same deal, 3 products live
Conventional
25% down · 7.5% · 30yr
- Down + closing
- —
- Monthly P&I
- —
- Monthly cashflow
- —
- DSCR
- —
- Eligible?
- —
Personal DTI + credit; lowest rate.
DSCR
20% down · 8.5% · 30yr
- Down + closing
- —
- Monthly P&I
- —
- Monthly cashflow
- —
- DSCR
- —
- Eligible?
- —
No personal income docs; deal must DSCR.
Hard money
10% down · 12.0% · 12mo
- Down + closing
- —
- Monthly P&I
- —
- Monthly cashflow
- —
- DSCR
- —
- Eligible?
- —
Short-term bridge; refi at stabilization.
Listing history 22 events
-
2026-06-21statusdays on market $109,900 Pending 72 DOM
-
2026-06-18days on market $109,900 Active 71 DOM
-
2026-06-17days on market $109,900 Active 70 DOM
-
2026-06-17price $109,900 Active 69 DOM
-
2026-06-16days on market $114,900 Active 69 DOM
-
2026-06-15days on market $114,900 Active 68 DOM
-
2026-06-13days on market $114,900 Active 66 DOM
-
2026-06-12days on market $114,900 Active 65 DOM
-
2026-06-09days on market $114,900 Active 62 DOM
-
2026-06-08days on market $114,900 Active 61 DOM
-
2026-06-08days on market $114,900 Active 60 DOM
-
2026-06-05days on market $114,900 Active 58 DOM
-
2026-06-04days on market $114,900 Active 56 DOM
-
2026-06-02pricedays on market $114,900 Active 55 DOM
-
2026-06-01days on market $119,900 Active 54 DOM
-
2026-05-31days on market $119,900 Active 53 DOM
-
2026-05-15price $119,900 249-char remark
Show marketing remark (249 chars)
Great location on 2.51 acres! This home needs some TLC but has some completed projects and some that are just waiting for your finishing touches. Some building materials are included. If you are looking for a great lot in a quiet spot, this is it!
-
2026-04-07$129,900 Active 249-char remark
Show marketing remark (249 chars)
Great location on 2.51 acres! This home needs some TLC but has some completed projects and some that are just waiting for your finishing touches. Some building materials are included. If you are looking for a great lot in a quiet spot, this is it!
-
2025-10-14price $47,500 160-char remark
Show marketing remark (160 chars)
Beautiful setting in the country for this 4 bedroom 1 bath home. Sitting on 2.5 acres New well in 2007 this would be a great fixer upper or mature building lot.
-
2018-10-25soldstatus $47,500
-
2018-10-24soldstatus $47,500 160-char remark
Show marketing remark (160 chars)
Beautiful setting in the country for this 4 bedroom 1 bath home. Sitting on 2.5 acres New well in 2007 this would be a great fixer upper or mature building lot.
-
2018-06-23$54,900 160-char remark
Show marketing remark (160 chars)
Beautiful setting in the country for this 4 bedroom 1 bath home. Sitting on 2.5 acres New well in 2007 this would be a great fixer upper or mature building lot.
ⓘ Source: listings_history table (triggers on properties + properties_extension) + one-shot
backfill from property_details.listing_events for pre-trigger history.
Tax reassessment forecast OH · Partial reset (capped growth)
- Current annual tax
- $1,251 · $104/mo
- Projected year-2 tax
- $1,483 · $124/mo
- Expected delta
- +$232/yr (+$19/mo · 18.5%)
ⓘ Screening estimate from a state-policy table — verify with the county assessor before closing.
Climate risk First Street
- Flood 1/10 Low FEMA zone X (unshaded) · 0% chance over 30 yrs
- Wildfire 1/10 Low
- Heat 3/10 Moderate 7 d/yr ≥99°F today · 17 d/yr by 30 yrs out
- Wind 2/10 Low 0% chance of damaging wind over 30 yrs
- Air quality 2/10 Low 1 unhealthy d/yr today · 2 by 30 yrs out
Nearby sold comps map
Loading sold comps map…
Walkable amenities ~0.75 mi
Loading nearby amenities…
Taxation est. · year 1
- Rental income
- $10,787
- − Mortgage interest
- −$6,156
- − Property taxes
- −$1,251
- − Insurance
- −$550
- − Repairs & maintenance
- −$863
- − Management
- −$863
- − Depreciation
- −$3,197
- Taxable loss
- −$2,092
- Est. tax savings @ 24.0%
- +$502
- After-tax cash flow
- $308/yr
For passive investors: Depreciation is non-cash, so a rental often shows a tax loss while cash-flowing — sheltering income. Rental losses are passive: they offset passive income freely, and up to $25,000/yr can offset ordinary (W-2) income if you actively participate and your MAGI is under $100k (phasing out to $0 by $150k); unused losses carry forward. On sale, claimed depreciation is recaptured at up to 25%, and gains may owe capital-gains tax (a 1031 exchange can defer both). Figures are a year-1 estimate at your 24.0% rate — not tax advice; consult a CPA.
Schools (NCES district)
- District
- Leipsic Local
- NCES district ID
- 3904935
- Math proficiency
- 65% ▲ 4.00%
- Reading proficiency
- 65% ▼ -2.00%
- Median HH income
- $44,567
- Composite
- 54.71/100
- National rank
- #1324
- State rank
- #223 of 656 in OH
Livability — West Leipsic
- Score
- 62/100
- State rank
- #869
- US rank
- #16425
Category grades
Schools grade is shown separately in the Schools card above.
Census & demographics
- County
- Putnam · 35,411 people
- Population (ZIP)
- 5,290
- Household income
- $87,292
- Rent vs Own
- Severe rent burden
- 10.7
Population outlook (Putnam County) Hauer SSP2
- Today (2025)
- 32,604 people
- By 2030
- 31,596 · -3.1%
- By 2040
- 29,380 · -9.9%
- By 2050
- 26,916 · -17.4%
- By 2075
- 22,109 · -32.2%
- By 2100
- 17,564 · -46.1%
Race, ethnicity, and origin ACS 2023
- Neighborhood character
- Predominantly White (77%)
- Race & ethnicity
- White 77% Hispanic / Latino 20% Two or more races 6% Native American 1%
- Hispanic origin (detail)
- Mexican 14%
- Common ancestry
- Romanian 1% Lithuanian 1%
- Foreign-born
- 7% · Canada
- Languages at home
- 85% English-only · Spanish 14% German/W. Germanic 1%
Political lean MEDSL · Putnam
- 2024 margin
- Solid R (+68.7) · D 15.2% · R 83.9%
- 2008→2024 swing
- -27.0pp toward R · 2008: -41.7pp · 2024: -68.7pp
- All cycles
- 2024: R+68.7 2020: R+66.3 2016: R+64.3 2012: R+51.5 2008: R+41.7
Not yet ingested
- Civics
- —
Market trends
- HPI YoY
- ▼ -0.55%
- Current HPI
- 241.8754
- Rent YoY
- —
- Metro
- —
- State GDP YoY
- ▲ 1.98%
- F500 in state
- 48
Industry mix (Fortune 500 HQ in OH)
| Industry | F500 HQs | Revenue |
|---|---|---|
| Insurance | 3 | $145B |
|
||
| Industrial Machinery | 3 | $49B |
|
||
| Financial Services | 3 | $24B |
|
||
| Consumer Goods | 2 | $93B |
|
||
| Aerospace / Defense | 2 | $47B |
|
||
| Utilities | 2 | $33B |
|
||
Price history
+118.4% since first listed6 events — show timeline
- 2026-05-15 Price Changed $119,900 NORIS
- 2026-04-07 Listed $129,900 NORIS
- 2025-10-14 Price Changed $47,500 NORIS
- 2018-10-25 Sold (Public Records) $47,500 Public Records
- 2018-10-24 Sold (MLS) $47,500 NORIS
- 2018-06-23 Listed $54,900 NORIS
Property tax history
-0.2%/yrLatest (2025): $1,251 · -3.6% YoY. Source: county tax records.
Cash-flow waterfall
monthlySold comps — $/sqft
last 12 mo · ≤1 miLoading sold comps…