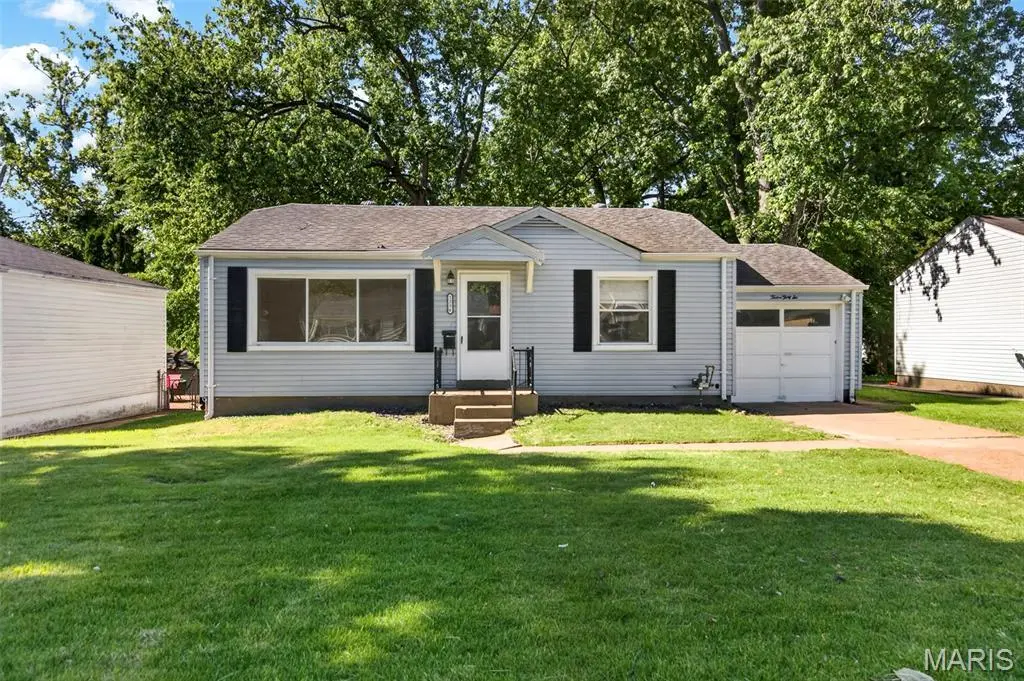
1236 Bliss Dr · Bellefontaine Neighbors, MO
Flood risk 1/10 · Minimal
- FEMA flood zone
- X (unshaded)
- Chance of flooding over 30 yrs
- 0.0%
- Est. flood insurance / yr
- $473 – $860
Fire risk 1/10 · Minimal
- Est. fire insurance / yr
- $1,054 – $1,958
Heat risk 5/10 · Moderate
- Hot days now (above 107°F)
- 7 days/yr
- Hot days in 30 yrs
- 21 days/yr
Wind risk 2/10 · Minimal
- Chance of severe wind over 30 yrs
- 1.0%
Air-quality risk 4/10 · Minor
- Unhealthy air days now
- 4 days/yr
- Unhealthy air days in 30 yrs
- 5 days/yr
Risk factors via First Street. Map © Google.
Why this score? — see what drove the D+ grade
The composite is a weighted blend of 9 inputs, each scored 0–100. Each bar is that input's sub-score; the figure is the points it added to the 100-point composite (weight × sub-score).
- Cash flow +25.1/30.0
- DSCR +8.2/10.0
- 1% rule +6.2/10.0
- Rent growth +4.1/5.0
- Livability +2.9/5.0
- Condition / age +2.5/5.0
- Schools +0.4/10.0
- ARV discount +0.0/15.0
- Appreciation +0.0/10.0
$118,000
🖨 Deal sheet (PDF) 📄 Offer letter ✓ Due diligence
Listing remarks MLS
This is a wonderful starter home. Don't miss out! 2 bedrooms, 1 bath and partially finished basement, and attached 1 car garage. There is room for enhancements and updates. Seller will not pay for repairs, or inspections. Seller reserves the right to accept an offer at any time.
Key facts
- 6,181 sq ft lot
- Garage
- Built 1953
Property features AI
Finance
- Other: Living area reported as 944 (above grade) with an estimated 400 below-grade finished area; Lot size approximately 0.1419 acre
Exterior
- Parking: Driveway and on-street parking; Garage facing front; Attached garage with 1 garage space (total parking listed as 1)
- Utilities: Public water; Public sewer; Single phase electric; Cable available; electricity, sewer and water connected
- Home design: Single-family residence; Private ownership; Attached property; One story; House structure; Entry/frontage length approximately 60 feet
- Construction: Vinyl siding; Architectural shingle roof; Concrete perimeter foundation
- Exterior features: Back yard; Few trees; Chain link fencing; Panel doors; Asphalt road frontage
Interior
- Kitchen: Dishwasher; Oven; Refrigerator
- Bedrooms: Three main-level bedrooms
- Flooring: Carpet
- Bathrooms: One full bathroom on the main level
- Heating & cooling: Natural gas heating; Central air conditioning
- Interior features: Updated/remodeled condition; Partially finished basement with sleeping area and storage space; Basement ceiling height 8 ft+ poured; No fireplace
- Laundry & utility: Laundry located in the basement; Utility room
Neighborhood map
What this means for you Summary
Snapshot
- This is a 2-bed/1.0-bath single-family listed at $118k.
Deal economics
- At list price, monthly cash flow is $261 ($3k/yr) — positive.
- The deal already cash-flows at list — no discount required.
- Meets the 1% rule at list price ($1k rent vs $118k).
Location & tenants
- Location reads 58/100 on livability (#592 in MO) — a working-class tenant base; expect higher turnover. Strengths: cost of living A+, housing B+; Watch: employment D+, crime F, amenities F.
- Riverview Gardens (suburban): math 2% / reading 9% proficiency, ranked #324 of 324 in MO (top 100%) — low school quality limits family demand, transient renter base, plan for 1-2y turnover; 90% free/reduced lunch — lower-income household profile, screen leases tightly.
- Zoned schools: Glasgow Elem. (math 2% / reading 2%, grade F, #1,099 of 1,115 statewide, top 100%, 269 students, 99% FRL); Riverview Gardens Sr. High (math 2% / reading 18%, grade F, #501 of 521 statewide, top 97%, 1,331 students, 100% FRL).
- Market conditions: Rents rising fast (+6.6%/yr); 204 active listings in the ZIP; 40 comparable units currently listed for rent nearby; rentals at typical pace (median 19d on market — plan ~3-4 weeks tenant-placement turnaround); lower-income renter base — watch delinquency; 920 units permitted in St. Louis County in 2024 (250 in 5+ unit buildings).
- This rent runs 36% of the median local income ($43k/yr) — at the standard rent-burdened threshold; future hikes will face affordability resistance.
Forward outlook
- Local home prices are declining (-3.0%/yr); year-one equity from $816 of loan paydown is wiped out by about $4k of value loss. Plan a longer hold.
- At projected returns (-3.0% appreciation + 6.6% rent growth), your $33k cash investment doubles in ~8 years — after that, you're playing with house money.
Negotiation context
- Only 5 days on market — expect competitive offers; lowballing is unlikely to land.
- 4 sale attempts since 13y ago with the ask held roughly flat each time — persistent listings suggest the price (not the market) is what's stuck; bring a comps-based counter.
- Current owner paid $65k; list at $118k implies a 82% gain — meaningful room to come down on a strong offer.
Risks & watch-outs
- Watch-outs: built in 1953 — expect roof / HVAC / electrical / plumbing capex.
- Climate carrying-cost: extreme-heat days projected 7→21/yr by 2055 (HVAC capex compounding) — expect insurance premiums to compound above CPI over the hold.
Questions for the listing agent
- Built in 1953 — when were the roof, HVAC, electrical panel, plumbing, and water heater last replaced?
- Is there a deadline driving the sale (1031 exchange, divorce, estate, relocation)? That informs how much negotiation room exists.
- Schools are F-rated, which usually means shorter tenancies and higher turnover. Who's the typical renter profile here, and what's been the actual vacancy rate?
- Crime grade is F in this area — have there been break-ins, vandalism, or insurance claims at this property in the last 3 years? What carrier currently insures it and at what premium?
- The area grade is low — what's the realistic commute time and amenity access for the typical tenant pool here? Any planned neighborhood developments (good or bad) we should know about?
- What's the average days-on-market for RENTAL listings here right now (not sales)? A rising rental-DOM trend means longer vacancies and softer asking-rent achievability than the comps imply.
- What's the recent tenant-quality profile in this submarket — average credit score on applications, eviction rate, late-payment / NSF rate, and stable-employment percentage? A property-management company in the area should have these aggregated.
- How much new for-sale + rental construction is in the pipeline within 1–3 miles? Heavy new supply typically softens prices + rents 12–24 months out; constrained supply supports both.
Investment metrics
- 1% rule
- 1.12% ✓
- Cap rate
- 8.95%
- Cash-on-cash
- 9.48%
- DSCR
- 1.42
- GRM
- 7.5
CMA / ARV
- ARV (median comp)
- $93,346
- List price
- $118,000
- Delta
- 26.41%
- Verdict
- OVERPRICED
- Comps
- 20 within 1.0 mi
Show comp detail 12 sales within ~0.75 mi
| Address | Dist | Beds/Ba | Sqft | Sold | Price | $/sf | Match |
|---|---|---|---|---|---|---|---|
| 1236 Bliss Dr | 0.00mi | 3/1.0 (+1) | 944 (0%) | 0mo | $118,000 | $125 | 95 |
| 1215 Bliss Dr | 0.05mi | 3/1.0 (+1) | 912 (-3%) | 5mo | $115,000 | $126 | 83 |
| 10505 Ewell Dr | 0.18mi | 3/1.0 (+1) | 912 (-3%) | 2mo | $127,000 | $139 | 79 |
| 1033 Bakewell Dr | 0.25mi | 2/1.0 | 992 (+5%) | 3mo | $99,900 | $101 | 78 |
| 1243 Addison Dr | 0.15mi | 3/1.5 (+1) | 912 (-3%) | 4mo | $99,900 | $110 | 78 |
| 10307 Seaton Dr | 0.31mi | 3/1.5 (+1) | 932 (-1%) | 1mo | $142,000 | $152 | 76 |
| 10522 Byfield Dr | 0.19mi | 2/1.0 | 1,038 (+10%) | 1mo | $99,900 | $96 | 74 |
| 10128 Ashbrook Dr | 0.35mi | 3/1.0 (+1) | 912 (-3%) | 1mo | $130,000 | $143 | 73 |
| 1140 Nectar Dr | 0.35mi | 3/1.0 (+1) | 912 (-3%) | 1mo | $135,000 | $148 | 73 |
| 10505 Druid Dr | 0.27mi | 3/1.0 (+1) | 1,008 (+7%) | 1mo | $115,000 | $114 | 70 |
| 10130 Newbold Dr | 0.49mi | 3/1.0 (+1) | 984 (+4%) | 2mo | $144,900 | $147 | 64 |
| 1417 Corinth Dr | 0.48mi | 3/1.0 (+1) | 1,008 (+7%) | 0mo | $104,900 | $104 | 61 |
Match score weights: distance 35% · size 25% · config 20% · recency 20%. Top-matched comps best support the ARV.
Projected returns pro-forma
-3.0% appreciation · 6.59% rent growth · sell at horizon
- IRR
- 1.8%
- Equity multiple
- 1.07×
- Total profit
- $2,430
- Equity at exit
- $17,594
- IRR
- 14.6%
- Equity multiple
- 2.37×
- Total profit
- $45,302
- Equity at exit
- $10,202
Cash invested: $33,040 (down + closing). Projections, not guarantees.
Landlord ↔ Tenant lean methodology
- Overall (STATE)
- 81 Strongly Landlord-Friendly
- State Missouri
- 81 Strongly Landlord-Friendly · R+10
- County
- — inherits STATE
- City
- — inherits STATE
ZIP-level market 63137
- Rents YoY
- 6.6%
- Active inventory
- 204
- Price-to-rent
- 7.5×
Monthly cashflow live
- Estimated rent
- $1,318 high interval (Pro) →
- Mortgage (P&I)
- −$619
- Tax from tax record
- −$112 /mo · $1,346/yr
- Insurance
- −$49
- HOA
- −$0
- Lot rent
- −$0
- Vacancy / Maint / Mgmt
- −$277
- Net cashflow
- $261
Break-even live
Sensitivity live
| Price | -10% $328 | -5% $294 | +0% $261 | +5% $228 | +10% $194 |
|---|---|---|---|---|---|
| Rent | -10% $157 | -5% $209 | +0% $261 | +5% $313 | +10% $365 |
| Rate | -1.0pp $320 | -0.5pp $291 | base $261 | +0.5pp $230 | +1.0pp $199 |
UW: 25.0% down · 7.5% · 30yr · 1.5% tax · 5.0% vac · 8.0% maint · 8.0% mgmt
Financing live
Cash to close
- Down payment
- $29,500
- Closing costs
- $3,540
- Reserves months
- —
- Total cash needed
- —
Loan-product check · same deal, 3 products live
Conventional
25% down · 7.5% · 30yr
- Down + closing
- —
- Monthly P&I
- —
- Monthly cashflow
- —
- DSCR
- —
- Eligible?
- —
Personal DTI + credit; lowest rate.
DSCR
20% down · 8.5% · 30yr
- Down + closing
- —
- Monthly P&I
- —
- Monthly cashflow
- —
- DSCR
- —
- Eligible?
- —
No personal income docs; deal must DSCR.
Hard money
10% down · 12.0% · 12mo
- Down + closing
- —
- Monthly P&I
- —
- Monthly cashflow
- —
- DSCR
- —
- Eligible?
- —
Short-term bridge; refi at stabilization.
Rent comps 40 comps
| Address | Beds | Baths | Sqft | Rent | $/sqft | DOM | Units | Dist |
|---|---|---|---|---|---|---|---|---|
| 1230 Roxton Dr Saint Louis, MO | 3.0 | 1.0 | 912 | $1,400 | $1.54 | 24d | 1 | 0.07mi |
| 1253 Avant Dr Saint Louis, MO | 2.0 | 1.0 | 795 | $1,295 | $1.63 | 20d | 1 | 0.11mi |
| 1253 Avant Dr Saint Louis, MO | 2.0 | 1.0 | 795 | $1,295 | $1.63 | 17d | 1 | 0.11mi |
| 1115 Bakewell Dr Saint Louis, MO | 3.0 | 1.0 | 916 | $1,300 | $1.42 | 46d | 1 | 0.14mi |
| 10367 Coburg Lands Dr Saint Louis, MO | 3.0 | 1.0 | 912 | $1,270 | $1.39 | 46d | 1 | 0.19mi |
| 1208 Rapid Dr Saint Louis, MO | 3.0 | 1.0 | 992 | $1,375 | $1.39 | 6d | 1 | 0.27mi |
| 1009 Bliss Dr Saint Louis, MO | 3.0 | 1.0 | 912 | $1,400 | $1.54 | 46d | 1 | 0.28mi |
| 10508 Druid Dr Saint Louis, MO | 3.0 | 1.0 | 1122 | $1,475 | $1.31 | 18d | 1 | 0.29mi |
| 1223 Rapid Dr Saint Louis, MO | 3.0 | 1.0 | 1008 | $1,095 | $1.09 | 1d | 1 | 0.30mi |
| 10200 Tappan Dr Saint Louis, MO | 3.0 | 1.0 | 912 | $1,375 | $1.51 | 1d | 1 | 0.34mi |
| 10200 Tappan Dr Saint Louis, MO | 3.0 | 1.0 | 912 | $1,450 | $1.59 | 18d | 1 | 0.34mi |
| 1520 Attica Dr Saint Louis, MO | 2.0 | 1.0 | 1062 | $1,200 | $1.13 | 26d | 1 | 0.48mi |
| 1255 Bosworth Dr Saint Louis, MO | 3.0 | 1.0 | 1071 | $1,575 | $1.47 | 13d | 1 | 0.57mi |
| 10203 Trio Ln Saint Louis, MO | 3.0 | 1.0 | 912 | $1,435 | $1.57 | 18d | 1 | 0.59mi |
| 815 Bella Ln Saint Louis, MO | 3.0 | 1.0 | 864 | $1,275 | $1.48 | 46d | 1 | 0.68mi |
| 10557 Castle Dr Saint Louis, MO | 3.0 | 2.0 | 1023 | $1,300 | $1.27 | 17d | 1 | 0.78mi |
| 10421 Prince Dr Saint Louis, MO | 3.0 | 2.0 | 1023 | $1,275 | $1.25 | 26d | 1 | 0.79mi |
| 10066 Dorothy Ave Saint Louis, MO | 2.0 | 1.0 | 916 | $1,225 | $1.34 | 24d | 1 | 0.90mi |
| 10421 Gardo Ct Saint Louis, MO | 3.0 | 2.0 | 1000 | $1,395 | $1.40 | 17d | 1 | 0.90mi |
| 10139 Royal Dr Saint Louis, MO | 2.0 | 1.0 | 1016 | $900 | $0.89 | 46d | 1 | 0.90mi |
| 1205 Shepley Dr Saint Louis, MO | 3.0 | 1.0 | 901 | $1,350 | $1.50 | 46d | 1 | 0.91mi |
| 1205 Shepley Dr Saint Louis, MO | 3.0 | 1.0 | 901 | $1,325 | $1.47 | 26d | 1 | 0.91mi |
| 10348 Earl Dr Saint Louis, MO | 3.0 | 1.0 | 770 | $1,325 | $1.72 | 1d | 1 | 0.94mi |
| 10404 Earl Dr Saint Louis, MO | 2.0 | 1.0 | 770 | $1,100 | $1.43 | 6d | 1 | 0.94mi |
| 515 Topaz Ave Saint Louis, MO | 3.0 | 2.0 | 912 | $1,245 | $1.37 | 1d | 1 | 0.96mi |
| 10113 Duke Dr Saint Louis, MO | 3.0 | 1.0 | 770 | $1,325 | $1.72 | 46d | 1 | 0.97mi |
| 1130 Forest Home Dr Saint Louis, MO | 3.0 | 1.0 | 1025 | $1,275 | $1.24 | 46d | 1 | 1.01mi |
| 743 Shepley Dr Saint Louis, MO | 3.0 | 1.0 | 932 | $1,025 | $1.10 | 1d | 1 | 1.02mi |
| 743 Shepley Dr Saint Louis, MO | 3.0 | 1.0 | 932 | $1,025 | $1.10 | 10d | 1 | 1.02mi |
| 10365 Lord Dr Saint Louis, MO | 3.0 | 1.0 | 864 | $1,075 | $1.24 | 4d | 1 | 1.02mi |
| 10027 Lilac Ave Saint Louis, MO | 3.0 | 1.0 | 1008 | $1,225 | $1.22 | 1d | 1 | 1.05mi |
| 13061 Lord Dr St. Louis, MO | 2.0 | 1.0 | 900 | $1,040 | $1.16 | 24d | 1 | 1.05mi |
| 10401 Hobkirk Dr Saint Louis, MO | 3.0 | 1.0 | 1050 | $1,500 | $1.43 | 19d | 1 | 1.05mi |
| 10201 Gourock Dr Saint Louis, MO | 3.0 | 1.0 | 886 | $1,275 | $1.44 | 46d | 1 | 1.06mi |
| 10201 Gourock Dr Saint Louis, MO | 3.0 | 1.0 | 886 | $1,275 | $1.44 | 1d | 1 | 1.06mi |
| 1342 N Garden Dr Saint Louis, MO | 2.0 | 1.0 | 626 | $1,100 | $1.76 | 0d | 3 | 1.07mi |
| 10512 Count Dr Saint Louis, MO | 3.0 | 1.0 | 888 | $1,195 | $1.35 | 17d | 1 | 1.07mi |
| 10409 Count Dr Saint Louis, MO | 3.0 | 1.0 | 912 | $1,100 | $1.21 | 24d | 1 | 1.08mi |
| 1333 N Garden Dr St. Louis, MO | 2.0 | 1.0 | 626 | $1,100 | $1.76 | 46d | 1 | 1.10mi |
| 10112 Count Dr Saint Louis, MO | 2.0 | 1.0 | 792 | $1,000 | $1.26 | 10d | 1 | 1.11mi |
Listing history 14 events
-
2026-05-15$118,000 Active 432-char remark
-
2025-01-30historical $1,250
-
2024-12-07$1,250
-
2022-07-21soldstatus $65,000
-
2022-07-18status Pending 282-char remark
Show marketing remark (282 chars)
This is a wonderful starter home. Don't miss out! 2 bedrooms, 1 bath and partially finished basement, and attached 1 car garage. There is room for enhancements and updates. Seller will not pay for repairs, or inspections. Seller reserves the right to accept an offer at any time.
-
2022-07-15soldstatus Closed 282-char remark
Show marketing remark (282 chars)
This is a wonderful starter home. Don't miss out! 2 bedrooms, 1 bath and partially finished basement, and attached 1 car garage. There is room for enhancements and updates. Seller will not pay for repairs, or inspections. Seller reserves the right to accept an offer at any time.
-
2022-06-28historical Active Under Contract 282-char remark
Show marketing remark (282 chars)
This is a wonderful starter home. Don't miss out! 2 bedrooms, 1 bath and partially finished basement, and attached 1 car garage. There is room for enhancements and updates. Seller will not pay for repairs, or inspections. Seller reserves the right to accept an offer at any time.
-
2022-06-17$74,000 Active 282-char remark
Show marketing remark (282 chars)
This is a wonderful starter home. Don't miss out! 2 bedrooms, 1 bath and partially finished basement, and attached 1 car garage. There is room for enhancements and updates. Seller will not pay for repairs, or inspections. Seller reserves the right to accept an offer at any time.
-
2013-08-23soldstatus
Show marketing remark (410 chars)
Don't miss this 2 bedroom 1 bathroom ranch!! Home features updated kitchen, wood floors, one car garage, and large level lot! This home is waiting for your finishing touches!! HUD acquired property. All purchasers welcome to bid. Open to all purchasers without preference after bid deadline. Property being sold as is. All utilities are turned OFF. Please use discretion when showing and bring a flashlight.
-
2013-05-13$28,000
Show marketing remark (410 chars)
Don't miss this 2 bedroom 1 bathroom ranch!! Home features updated kitchen, wood floors, one car garage, and large level lot! This home is waiting for your finishing touches!! HUD acquired property. All purchasers welcome to bid. Open to all purchasers without preference after bid deadline. Property being sold as is. All utilities are turned OFF. Please use discretion when showing and bring a flashlight.
-
2011-10-14soldstatus $65,000
-
2010-12-08soldstatus $25,000
-
2010-12-08soldstatus $31,000
-
2000-04-28soldstatus $62,900
ⓘ Source: listings_history table (triggers on properties + properties_extension) + one-shot
backfill from property_details.listing_events for pre-trigger history.
Tax reassessment forecast MO · Resets to sale price
- Current annual tax
- $1,346 · $112/mo
- Projected year-2 tax
- $1,346 · $112/mo
- Expected delta
- $0/yr ($0/mo · 0.0%)
ⓘ Screening estimate from a state-policy table — verify with the county assessor before closing.
Climate risk First Street
- Flood 1/10 Low FEMA zone X (unshaded) · 0% chance over 30 yrs
- Wildfire 1/10 Low
- Heat 5/10 Major 7 d/yr ≥107°F today · 21 d/yr by 30 yrs out
- Wind 2/10 Low 100% chance of damaging wind over 30 yrs
- Air quality 4/10 Moderate 4 unhealthy d/yr today · 5 by 30 yrs out
Nearby sold comps map
Loading sold comps map…
Walkable amenities ~0.75 mi
Loading nearby amenities…
Taxation est. · year 1
- Rental income
- $15,814
- − Mortgage interest
- −$6,610
- − Property taxes
- −$1,346
- − Insurance
- −$590
- − Repairs & maintenance
- −$1,265
- − Management
- −$1,265
- − Depreciation
- −$3,433
- Taxable income
- $1,306
- Est. tax owed @ 24.0%
- −$313
- After-tax cash flow
- $2,818/yr
For passive investors: Depreciation is non-cash, so a rental often shows a tax loss while cash-flowing — sheltering income. Rental losses are passive: they offset passive income freely, and up to $25,000/yr can offset ordinary (W-2) income if you actively participate and your MAGI is under $100k (phasing out to $0 by $150k); unused losses carry forward. On sale, claimed depreciation is recaptured at up to 25%, and gains may owe capital-gains tax (a 1031 exchange can defer both). Figures are a year-1 estimate at your 24.0% rate — not tax advice; consult a CPA.
Schools (NCES district)
- District
- Riverview Gardens
- NCES district ID
- 2926670
- Math proficiency
- 2% ▼ -6.00%
- Reading proficiency
- 9% ▼ -6.00%
- Median HH income
- $32,759
- Composite
- 4.22/100
- National rank
- #10058
- State rank
- #324 of 324 in MO
Livability — Bellefontaine Neighbors
- Score
- 58/100
- State rank
- #592
- US rank
- #20944
Category grades
Schools grade is shown separately in the Schools card above.
Census & demographics
- Census place
- Bellefontaine Neighbors, MO
- County
- Saint Louis County · 888,823 people
- City population
- 19,684
- Metro
- St. Louis, MO-IL
- Population (ZIP)
- 19,684
- Household income
- $43,422
- Rent vs Own
- Severe rent burden
- 1863.0
Population outlook (St. Louis County) Hauer SSP2
- Today (2025)
- 1,025,227 people
- By 2030
- 1,028,023 · +0.3%
- By 2040
- 1,020,940 · -0.4%
- By 2050
- 1,007,280 · -1.8%
- By 2075
- 987,277 · -3.7%
- By 2100
- 921,984 · -10.1%
Race, ethnicity, and origin ACS 2023
- Neighborhood character
- Predominantly Black (82%)
- Race & ethnicity
- Black 82% White 13% Two or more races 3%
- Common ancestry
- Romanian 1% Lithuanian 1% Italian 1%
- Foreign-born
- 1%
Political lean MEDSL · St. Louis
- 2024 margin
- Strong D (+23.4) · D 60.8% · R 37.4% · Other 1.7%
- 2008→2024 swing
- +3.5pp toward D · 2008: 19.9pp · 2024: 23.4pp
- All cycles
- 2024: D+23.4 2020: D+24.0 2016: D+16.2 2012: D+13.7 2008: D+19.9
Not yet ingested
- Civics
- —
Market trends
- HPI YoY
- ▼ -96.70%
- Current HPI
- 130.6765
- Rent YoY
- ▲ 6.59%
- Metro
- St. Louis, MO-IL
- State GDP YoY
- ▲ 1.84%
- F500 in state
- 20
Industry mix (Fortune 500 HQ in MO)
| Industry | F500 HQs | Revenue |
|---|---|---|
| Healthcare | 1 | $163B |
|
||
| Insurance | 1 | $21B |
|
||
| Industrial Technology | 1 | $17B |
|
||
| Retail | 1 | $16B |
|
||
| Industrial Distribution | 1 | $10B |
|
||
| Utilities | 1 | $9B |
|
||
Price history
+87.6% since first listed16 events — show timeline
- 2026-06-11 Sold (MLS) — MARIS as Distributed by MLS Grid
- 2026-05-21 Pending — MARIS as Distributed by MLS Grid
- 2026-05-15 Listed $118,000 MARIS as Distributed by MLS Grid
- 2025-01-30 Rental Removed $1,250 BUILDIUM
- 2024-12-07 Listed for Rent $1,250 BUILDIUM
- 2022-07-21 Sold (Public Records) $65,000 Public Records
- 2022-07-18 Pending — MARIS as Distributed by MLS Grid
- 2022-07-15 Sold (MLS) — MARIS as Distributed by MLS Grid
- 2022-06-28 Contingent — MARIS as Distributed by MLS Grid
- 2022-06-17 Listed $74,000 MARIS as Distributed by MLS Grid
- 2013-08-23 Sold (MLS) — MARIS as Distributed by MLS Grid
- 2013-05-13 Listed $28,000 MARIS as Distributed by MLS Grid
- 2011-10-14 Sold (Public Records) $65,000 Public Records
- 2010-12-08 Sold (Public Records) $31,000 Public Records
- 2010-12-08 Sold (Public Records) $25,000 Public Records
- 2000-04-28 Sold (Public Records) $62,900 Public Records
Property tax history
+1.5%/yrLatest (2022): $1,346 · +0.9% YoY. Source: county tax records.
Cash-flow waterfall
monthlySold comps — $/sqft
last 12 mo · ≤1 miLoading sold comps…