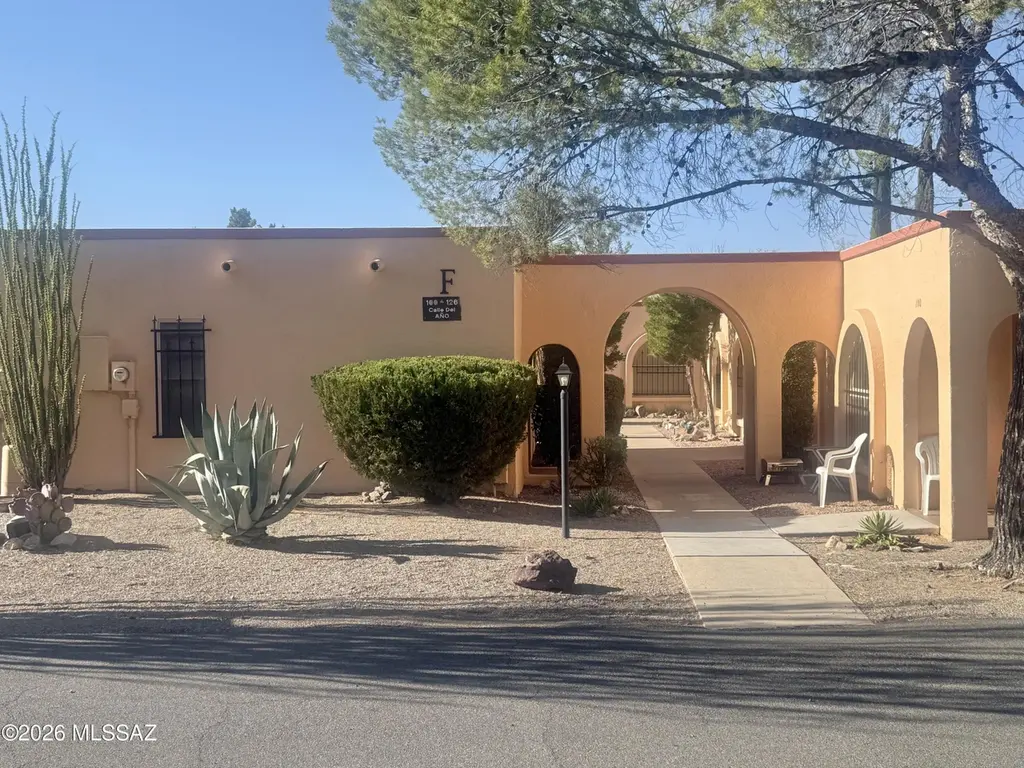
102 W Calle Del Ano · Green Valley, AZ
Flood risk 6/10 · Moderate
- FEMA flood zone
- X (unshaded)
- Chance of flooding over 30 yrs
- 0.74%
- Est. flood insurance / yr
- $507 – $1,088
Fire risk 6/10 · Moderate
- Est. fire insurance / yr
- $610 – $1,132
Heat risk 7/10 · Major
- Hot days now (above 104°F)
- 7 days/yr
- Hot days in 30 yrs
- 19 days/yr
Wind risk 1/10 · Minimal
- Chance of severe wind over 30 yrs
- —
Air-quality risk 1/10 · Minimal
- Unhealthy air days now
- 0 days/yr
- Unhealthy air days in 30 yrs
- 0 days/yr
Risk factors via First Street. Map © Google.
Why this score? — see what drove the D+ grade
The composite is a weighted blend of 9 inputs, each scored 0–100. Each bar is that input's sub-score; the figure is the points it added to the 100-point composite (weight × sub-score).
- Cash flow +24.0/30.0
- DSCR +7.8/10.0
- 1% rule +5.0/10.0
- Rent growth +3.9/5.0
- Schools +3.3/10.0
- Livability +3.1/5.0
- Condition / age +2.5/5.0
- ARV discount +0.0/15.0
- Appreciation +0.0/10.0
$140,000
🖨 Deal sheet 📄 Offer letter ✓ Due diligence
Listing remarks MLS
This move n ready, newly updated , fully furnished Green Valley Resort Home is right in the middle of everything! A stone's throw from the community pool, GVR facilities, golf courses, shopping, groceries and restaurants. A redesigned kitchen features all new cabinets, countertop, sink and faucets. Don't forget the new coffee bar, subway tile backsplash and wood look tile plank flooring throughout. New full sized stove and refrigerator. Home also features a newer mini split (cooling and heating),dishwasher and triple pane back window. Rounding out the upgrades includes a new chair height dual flush toilet and bath faucet. Fresh neutral colors with a cozy, modern feel make this home a great option for full or part-time living or as a possible investment opportunity. Sellers related to LA Sellers are related to listing agent
Key facts
- Private courtyard
- Community pool
- Built 1976
Tags
Property features AI
Finance
- HOA & community: Has homeowners association; HOA maintains common areas, roofs, and streets
Exterior
- Security: Window bars
- Utilities: Water provided by water company; Sewer connected
- Home design: Townhouse; One story
- Construction: Frame with stucco exterior; Built-up roof; Built in year not specified
- Exterior features: East/West exposure; Chip-and-seal road; Community pool; Paved street
Interior
- Kitchen: Dishwasher; Refrigerator; Electric range; Microwave
- Bathrooms: 1 full bathroom
- Heating & cooling: Mini-split heating; Ductless cooling
- Interior features: Skylights; Window bars
- Laundry & utility: Laundry closet
Neighborhood map
What this means for you Summary
Snapshot
- This is a 1-bed/1.0-bath townhouse listed at $140k.
Deal economics
- At list price, monthly cash flow is $275 ($3k/yr) — positive.
- The deal already cash-flows at list — no discount required.
- Meets the 1% rule at list price ($1k rent vs $140k).
- Recommended offer: $138k (1.5% below list) — sets the bar for market timing.
- Cap rate 8.7% vs local median 4.5% in Green Valley — top-decile yield for the area; either an underpriced asset or a hidden risk that comps aren't pricing in. Stress-test before assuming the spread holds.
Location & tenants
- Location reads 61/100 on livability (#165 in AZ) — a middle-class / working-renter tenant base. Strengths: cost of living A+, housing A+; Watch: amenities F, commute F, health & safety F.
- Continental Elementary District (4416) (rural): math 35% / reading 42% proficiency, ranked #72 of 249 in AZ (top 29%) — families likely to look elsewhere, expect single-tenant / working-renter base with shorter leases; only 19% free/reduced lunch — higher-income household profile.
- Zoned schools: Continental Elementary School (math 35% / reading 42%, grade F, #418 of 1,109 statewide, top 38%, 639 students, 31% FRL).
- Market conditions: Rents rising fast (+5.6%/yr); 411 active listings in the ZIP; 12 comparable units currently listed for rent nearby; rentals at typical pace (median 17d on market — plan ~3-4 weeks tenant-placement turnaround); 5,268 units permitted in Pima County in 2024 (996 in 5+ unit buildings).
Forward outlook
- Local home prices are declining (-3.0%/yr); year-one equity from $968 of loan paydown is wiped out by about $4k of value loss. Plan a longer hold.
- Pima County population projected at +8% by 2050 — modest demand growth; plan on rents tracking national, not racing it.
- At projected returns (-3.0% appreciation + 5.6% rent growth), your $39k cash investment doubles in ~10 years — after that, you're playing with house money.
Negotiation context
- It's been on market 16 days — a 2% lower offer ($138k) is reasonable based on typical stale-listing flexibility.
- 4 sale attempts since 3y ago with the ask held roughly flat each time — persistent listings suggest the price (not the market) is what's stuck; bring a comps-based counter.
Risks & watch-outs
- Climate carrying-cost: major flood risk; major wildfire risk; extreme-heat days projected 7→19/yr by 2055 (HVAC capex compounding) — expect insurance premiums to compound above CPI over the hold.
Questions for the listing agent
- Built in 1976 — when were the roof, HVAC, electrical panel, plumbing, and water heater last replaced?
- Is there a deadline driving the sale (1031 exchange, divorce, estate, relocation)? That informs how much negotiation room exists.
- The area grade is low — what's the realistic commute time and amenity access for the typical tenant pool here? Any planned neighborhood developments (good or bad) we should know about?
- What's the average days-on-market for RENTAL listings here right now (not sales)? A rising rental-DOM trend means longer vacancies and softer asking-rent achievability than the comps imply.
- What's the recent tenant-quality profile in this submarket — average credit score on applications, eviction rate, late-payment / NSF rate, and stable-employment percentage? A property-management company in the area should have these aggregated.
- How much new for-sale + rental construction is in the pipeline within 1–3 miles? Heavy new supply typically softens prices + rents 12–24 months out; constrained supply supports both.
Investment metrics
- 1% rule
- 1.00% ✓
- Cap rate
- 8.65%
- Cash-on-cash
- 8.43%
- DSCR
- 1.38
- GRM
- 8.3
CMA / ARV
- ARV (on-the-fly)
- $115,232
- Comps found
- 12
Show comp detail 12 sales within ~0.75 mi
| Address | Dist | Beds/Ba | Sqft | Sold | Price | $/sf | Match |
|---|---|---|---|---|---|---|---|
| 122 W Calle Del Ano | 0.02mi | 1/1.0 | 554 (0%) | 2mo | $135,000 | $244 | 98 |
| 100 W Calle Del Ano -- | 0.00mi | 1/1.0 | 554 (0%) | 3mo | $135,000 | $244 | 97 |
| 181 W Calle Del Ano | 0.08mi | 1/1.0 | 554 (0%) | 0mo | $115,000 | $208 | 96 |
| 148 W Calle Del Ano | 0.06mi | 1/1.0 | 554 (0%) | 2mo | $119,000 | $215 | 96 |
| 435 S Paseo Lobo Unit B | 0.51mi | 1/1.0 | 588 (+6%) | 3mo | $95,000 | $162 | 64 |
| 484 S La Canada Dr Unit B | 0.53mi | 1/1.0 | 588 (+6%) | 3mo | $79,000 | $134 | 62 |
| 482 S Paseo Pena Unit B | 0.56mi | 1/1.0 | 588 (+6%) | 3mo | $127,000 | $216 | 61 |
| 346 S Paseo Aguila Unit C | 0.60mi | 1/1.0 | 588 (+6%) | 1mo | $100,000 | $170 | 61 |
| 348 S Paseo Lobo Unit C | 0.62mi | 1/1.0 | 592 (+7%) | 1mo | $122,900 | $208 | 59 |
| 361 S Paseo Pena Unit B | 0.65mi | 1/1.0 | 588 (+6%) | 1mo | $89,900 | $153 | 59 |
| 373 S Paseo Sarta Unit C | 0.70mi | 1/1.0 | 588 (+6%) | 2mo | $95,000 | $162 | 56 |
| 328 S Paseo Quinta Unit B | 0.72mi | 1/1.0 | 588 (+6%) | 1mo | $116,000 | $197 | 55 |
Match score weights: distance 35% · size 25% · config 20% · recency 20%. Top-matched comps best support the ARV.
Projected returns pro-forma
-3.0% appreciation · 5.6% rent growth · sell at horizon
- IRR
- -0.9%
- Equity multiple
- 0.96×
- Total profit
- $-1,439
- Equity at exit
- $20,874
- IRR
- 11.0%
- Equity multiple
- 1.95×
- Total profit
- $37,390
- Equity at exit
- $12,105
Cash invested: $39,200 (down + closing). Projections, not guarantees.
Landlord ↔ Tenant lean methodology
- Overall (STATE)
- 87 Strongly Landlord-Friendly
- State Arizona
- 87 Strongly Landlord-Friendly · R+3
- County
- — inherits STATE
- City
- — inherits STATE
ZIP-level market 85614
- Rents YoY
- 5.6%
- Active inventory
- 411
- Price-to-rent
- 8.3×
Monthly cashflow live
- Estimated rent
- $1,404 high interval (Pro) →
- Mortgage (P&I)
- −$734
- Tax from tax record
- −$41 /mo · $491/yr
- Insurance
- −$58
- HOA
- −$0
- Vacancy / Maint / Mgmt
- −$295
- Net cashflow
- $275
Break-even live
UW: 25.0% down · 7.5% · 30yr · 1.5% tax · 5.0% vac · 8.0% maint · 8.0% mgmt
Financing live
Cash to close
- Down payment
- $35,000
- Closing costs
- $4,200
- Reserves months
- —
- Total cash needed
- —
Loan-product check · same deal, 3 products live
Conventional
25% down · 7.5% · 30yr
- Down + closing
- —
- Monthly P&I
- —
- Monthly cashflow
- —
- DSCR
- —
- Eligible?
- —
Personal DTI + credit; lowest rate.
DSCR
20% down · 8.5% · 30yr
- Down + closing
- —
- Monthly P&I
- —
- Monthly cashflow
- —
- DSCR
- —
- Eligible?
- —
No personal income docs; deal must DSCR.
Hard money
10% down · 12.0% · 12mo
- Down + closing
- —
- Monthly P&I
- —
- Monthly cashflow
- —
- DSCR
- —
- Eligible?
- —
Short-term bridge; refi at stabilization.
Rent comps 12 comps
| Address | Beds | Baths | Sqft | Rent | $/sqft | DOM | Units | Dist |
|---|---|---|---|---|---|---|---|---|
| 90 W Camino Manzana Green Valley, AZ | 1.0 | 1.0 | 588 | $2,000 | $3.40 | 23d | 1 | 0.50mi |
| 478 Paseo Madera Unit B Green Valley, AZ | 1.0 | 1.0 | 588 | $1,250 | $2.13 | 23d | 1 | 0.52mi |
| 466 Paseo Madera Unit A Green Valley, AZ | 2.0 | 1.0 | 696 | $1,100 | $1.58 | 16d | 1 | 0.52mi |
| 466 S Paseo Madera Green Valley, AZ | 2.0 | 1.0 | 696 | $2,300 | $3.30 | 16d | 1 | 0.52mi |
| 430 S Paseo Pena Green Valley, AZ | 2.0 | 1.0 | 696 | $1,025 | $1.47 | 14d | 1 | 0.63mi |
| 321 S Paseo Madera Unit A Green Valley, AZ | 2.0 | 1.0 | 696 | $1,250 | $1.80 | 23d | 1 | 0.64mi |
| 303 S Paseo Lobo Green Valley, AZ | 2.0 | 1.0 | 696 | $1,000 | $1.44 | 23d | 1 | 0.65mi |
| 262 S Paseo Cerro Green Valley, AZ | 1.0 | 1.0 | 588 | $1,200 | $2.04 | 1d | 1 | 0.68mi |
| 262 S Paseo Cerro Unit B Green Valley, AZ | 1.0 | 1.0 | 588 | $1,200 | $2.04 | 23d | 1 | 0.68mi |
| 133 S Paseo Pena Green Valley, AZ | 1.0 | 1.0 | 588 | $1,095 | $1.86 | 1d | 1 | 0.87mi |
| 174 S Paseo Tierra Green Valley, AZ | 1.0 | 1.0 | 588 | $1,100 | $1.87 | 1d | 1 | 0.92mi |
| 132 S Paseo Sarta Green Valley, AZ | 1.0 | 1.0 | 588 | $2,000 | $3.40 | 1d | 1 | 0.93mi |
Listing history 11 events
-
2026-06-18days on market $140,000 Active 16 DOM
-
2026-06-17days on market $140,000 Active 15 DOM
-
2026-06-16days on market $140,000 Active 14 DOM
-
2026-06-15days on market $140,000 Active 13 DOM
-
2026-06-13days on market $140,000 Active 11 DOM
-
2026-06-10days on market $140,000 Active 8 DOM
-
2026-06-09days on market $140,000 Active 7 DOM
-
2026-06-08days on market $140,000 Active 6 DOM
-
2026-06-07days on market $140,000 Active 5 DOM
-
2026-06-03remarks 560-char remark
-
2026-06-03$140,000 Active 1 DOM
ⓘ Source: listings_history table (triggers on properties + properties_extension) + one-shot
backfill from property_details.listing_events for pre-trigger history.
Tax reassessment forecast AZ · Resets to sale price
- Current annual tax
- $491 · $41/mo
- Projected year-2 tax
- $924 · $77/mo
- Expected delta
- +$433/yr (+$36/mo · 88.2%)
ⓘ Screening estimate from a state-policy table — verify with the county assessor before closing.
Climate risk First Street
- Flood 6/10 Major FEMA zone X (unshaded) · 74% chance over 30 yrs
- Wildfire 6/10 Major
- Heat 7/10 Severe 7 d/yr ≥104°F today · 19 d/yr by 30 yrs out
- Wind 1/10 Low
- Air quality 1/10 Low 0 unhealthy d/yr today · 0 by 30 yrs out
Nearby sold comps map
Loading sold comps map…
Walkable amenities ~0.75 mi
Loading nearby amenities…
Taxation est. · year 1
- Rental income
- $16,843
- − Mortgage interest
- −$7,842
- − Property taxes
- −$491
- − Insurance
- −$700
- − Repairs & maintenance
- −$1,347
- − Management
- −$1,347
- − Depreciation
- −$4,073
- Taxable income
- $1,042
- Est. tax owed @ 24.0%
- −$250
- After-tax cash flow
- $3,055/yr
For passive investors: Depreciation is non-cash, so a rental often shows a tax loss while cash-flowing — sheltering income. Rental losses are passive: they offset passive income freely, and up to $25,000/yr can offset ordinary (W-2) income if you actively participate and your MAGI is under $100k (phasing out to $0 by $150k); unused losses carry forward. On sale, claimed depreciation is recaptured at up to 25%, and gains may owe capital-gains tax (a 1031 exchange can defer both). Figures are a year-1 estimate at your 24.0% rate — not tax advice; consult a CPA.
Schools (NCES district)
- District
- Continental Elementary District (4416)
- NCES district ID
- 0402250
- Math proficiency
- 35% ▼ -11.00%
- Reading proficiency
- 42% ▬ 0.00%
- Median HH income
- $48,475
- Composite
- 33.08/100
- National rank
- #5565
- State rank
- #72 of 249 in AZ
Livability — Green Valley
- Score
- 61/100
- State rank
- #165
- US rank
- #18276
Category grades
Schools grade is shown separately in the Schools card above.
Census & demographics
- Census place
- Green Valley, AZ
- County
- Pima County · 1,012,107 people
- City population
- 25,381
- Metro
- Tucson, AZ
- Population (ZIP)
- 25,381
- Household income
- $64,879
- Rent vs Own
- Severe rent burden
- 860.0
Population outlook (Pima County) Hauer SSP2
- Today (2025)
- 1,066,056 people
- By 2030
- 1,086,684 · +1.9%
- By 2040
- 1,117,160 · +4.8%
- By 2050
- 1,149,778 · +7.9%
- By 2075
- 1,271,480 · +19.3%
- By 2100
- 1,321,160 · +23.9%
Race, ethnicity, and origin ACS 2023
- Neighborhood character
- Predominantly White (80%)
- Race & ethnicity
- White 80% Hispanic / Latino 15% Two or more races 7% Black 2%
- Hispanic origin (detail)
- Mexican 14%
- Common ancestry
- Portuguese 4% Slovak 4% Italian 3%
- Foreign-born
- 8% · Canada, China
- Languages at home
- 87% English-only · Spanish 9% French/Haitian/Cajun 1% German/W. Germanic 0%
Political lean MEDSL · Pima
- 2024 margin
- D (+15.2) · D 57.0% · R 41.8% · Other 1.2%
- 2008→2024 swing
- +9.1pp toward D · 2008: 6.1pp · 2024: 15.2pp
- All cycles
- 2024: D+15.2 2020: D+18.7 2016: D+13.5 2012: D+5.8 2008: D+6.1
Not yet ingested
- Civics
- —
Market trends
- HPI YoY
- ▼ -231.05%
- Current HPI
- 250.5933
- Rent YoY
- ▲ 5.60%
- Metro
- Tucson, AZ
- State GDP YoY
- ▲ 4.54%
- F500 in state
- 20
Industry mix (Fortune 500 HQ in AZ)
| Industry | F500 HQs | Revenue |
|---|---|---|
| Technology | 2 | $13B |
|
||
| Mining / Metals | 1 | $23B |
|
||
| Environmental Services | 1 | $16B |
|
||
| Metals / Steel | 1 | $14B |
|
||
| Technology Distribution | 1 | $9B |
|
||
| Homebuilding | 1 | $8B |
|
||
Price history
+250.9% since first listed13 events — show timeline
- 2026-06-02 Listed $140,000 MLSSAZ
- 2025-01-21 Rental Removed $1,000 RENTALBEAST
- 2025-01-18 Listed for Rent $1,000 RENTALBEAST
- 2025-01-17 Rental Removed $1,000 RENTEC
- 2024-11-04 Listed for Rent $1,000 RENTEC
- 2023-08-23 Sold (Public Records) $152,900 Public Records
- 2023-08-23 Sold (MLS) $152,900 MLSSAZ
- 2023-07-27 Contingent — MLSSAZ
- 2023-07-17 Listed $152,900 MLSSAZ
- 2017-08-29 Sold (Public Records) $48,000 Public Records
- 2017-08-29 Sold (MLS) $48,000 MLSSAZ
- 2005-05-20 Sold (Public Records) $68,000 Public Records
- 1985-05-17 Sold (Public Records) $39,900 Public Records
Property tax history
+2.8%/yrLatest (2025): $491 · +3.6% YoY. Source: county tax records.
Cash-flow waterfall
monthlySold comps — $/sqft
last 12 mo · ≤1 miLoading sold comps…