2121 Adams Dr · Sellersburg, IN
Flood risk No data
- FEMA flood zone
- —
- Chance of flooding over 30 yrs
- —
- Est. flood insurance / yr
- —
Fire risk No data
- Est. fire insurance / yr
- —
Heat risk No data
- Hot days now (above threshold)
- —
- Hot days in 30 yrs
- —
Wind risk No data
- Chance of severe wind over 30 yrs
- —
Air-quality risk No data
- Unhealthy air days now
- —
- Unhealthy air days in 30 yrs
- —
Risk factors via First Street. Map © Google.
Why this score? — see what drove the B- grade
The composite is a weighted blend of 9 inputs, each scored 0–100. Each bar is that input's sub-score; the figure is the points it added to the 100-point composite (weight × sub-score).
- Cash flow +27.4/30.0
- 1% rule +10.0/10.0
- DSCR +9.6/10.0
- ARV discount +7.5/15.0
- Schools +5.0/10.0
- Condition / age +4.0/5.0
- Livability +3.7/5.0
- Rent growth +2.5/5.0
- Appreciation +0.0/10.0
$106,000
🖨 Deal sheet 📄 Offer letter ✓ Due diligence
Listing remarks
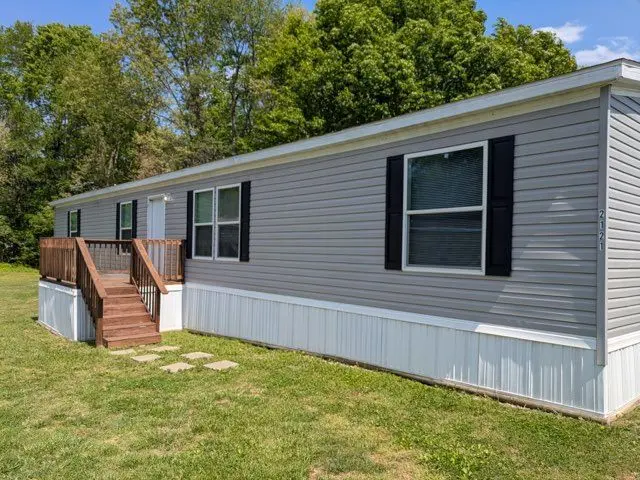
Previously owned 4 bed, 2 bath home located at 2121 Adams Dr Home Highlights - Move-in ready - Spacious layout - Community Amenities include: Basketball Court, Clubhouse and Playground - Located just off the Salem exit of I-65 on the outskirts of Sellersburg - Silver Creek School District
Key facts
- Move-in ready
- Clubhouse
- Basketball court
Tags
Property features AI
Finance
- Financial info: List price $106,000
- HOA & community: Association fee: $560 (association present)
Exterior
- Home design: Single-family spec home — Grand (Indian Oaks) plan
- Construction: Built as new construction (spec)
- Exterior features: Property listed at 2121 Adams Dr, Sellersburg, IN 47172
Interior
- Bedrooms: 4 bedrooms
- Bathrooms: 2 full bathrooms
- Interior features: Open living area (approx. 1,904 finished); Spec home (new construction)
Neighborhood map
What this means for you Summary
Snapshot
- This is a 4-bed/2.0-bath manufactured listed at $106k. Condition is rated good.
Deal economics
- At list price, monthly cash flow is $309 ($4k/yr) — positive.
- The deal already cash-flows at list — no discount required.
- Meets the 1% rule at list price ($2k rent vs $106k).
- Recommended offer: $104k (1.5% below list) — sets the bar for market timing.
- Cap rate 9.8% vs local median 4.0% in Sellersburg — top-decile yield for the area; either an underpriced asset or a hidden risk that comps aren't pricing in. Stress-test before assuming the spread holds.
Location & tenants
- Location reads 73/100 on livability (#85 in IN) — a middle-class / working-renter tenant base. Strengths: cost of living A+, housing A+, crime A-; Watch: schools D+, commute D+, health & safety D+.
- Market conditions: 146 active listings in the ZIP; 3 comparable units currently listed for rent nearby; rentals leasing fast (median 2d on market — plan ~1-2 weeks tenant-placement turnaround); solid renter incomes; 911 units permitted in Clark County in 2024 (133 in 5+ unit buildings).
Forward outlook
- Local home prices are declining (-3.0%/yr); year-one equity from $733 of loan paydown is wiped out by about $3k of value loss. Plan a longer hold.
- Clark County population projected at +17% by 2050 — long-run rental-demand tailwind backs the buy-and-hold thesis.
- At projected returns (-3.0% appreciation + 3.0% rent growth), your $30k cash investment doubles in ~9 years — after that, you're playing with house money.
Negotiation context
- It's been on market 28 days — a 2% lower offer ($104k) is reasonable based on typical stale-listing flexibility.
Risks & watch-outs
- Watch-outs: HOA is 28% of rent.
Questions for the listing agent
- What does the HOA fee cover, when was the last increase, and are there any pending special assessments or reserve-fund shortfalls?
- Is there a deadline driving the sale (1031 exchange, divorce, estate, relocation)? That informs how much negotiation room exists.
- Schools are D-rated, which usually means shorter tenancies and higher turnover. Who's the typical renter profile here, and what's been the actual vacancy rate?
- What's the average days-on-market for RENTAL listings here right now (not sales)? A rising rental-DOM trend means longer vacancies and softer asking-rent achievability than the comps imply.
- What's the recent tenant-quality profile in this submarket — average credit score on applications, eviction rate, late-payment / NSF rate, and stable-employment percentage? A property-management company in the area should have these aggregated.
- How much new for-sale + rental construction is in the pipeline within 1–3 miles? Heavy new supply typically softens prices + rents 12–24 months out; constrained supply supports both.
Investment metrics
- 1% rule
- 1.91% ✓
- Cap rate
- 9.79%
- Cash-on-cash
- 12.50%
- DSCR
- 1.56
- GRM
- 4.4
CMA / ARV
No comps found within radius.
Projected returns pro-forma
-3.0% appreciation · 3.0% rent growth · sell at horizon
- IRR
- 2.5%
- Equity multiple
- 1.10×
- Total profit
- $2,888
- Equity at exit
- $15,805
- IRR
- 12.4%
- Equity multiple
- 1.99×
- Total profit
- $29,390
- Equity at exit
- $9,165
Cash invested: $29,680 (down + closing). Projections, not guarantees.
Landlord ↔ Tenant lean methodology
- Overall (STATE)
- 90 Strongly Landlord-Friendly
- State Indiana
- 90 Strongly Landlord-Friendly · R+11
- County
- — inherits STATE
- City
- — inherits STATE
ZIP-level market 47172
- Active inventory
- 146
- Price-to-rent
- 4.4×
Monthly cashflow live
- Estimated rent
- $2,027 medium interval (Pro) →
- Mortgage (P&I)
- −$556
- Tax est. 1.5%
- −$132 /mo · $1,590/yr
- Insurance
- −$44
- HOA
- −$560
- Vacancy / Maint / Mgmt
- −$426
- Net cashflow
- $309
Break-even live
UW: 25.0% down · 7.5% · 30yr · 1.5% tax · 5.0% vac · 8.0% maint · 8.0% mgmt
Financing live
Cash to close
- Down payment
- $26,500
- Closing costs
- $3,180
- Reserves months
- —
- Total cash needed
- —
Loan-product check · same deal, 3 products live
Conventional
25% down · 7.5% · 30yr
- Down + closing
- —
- Monthly P&I
- —
- Monthly cashflow
- —
- DSCR
- —
- Eligible?
- —
Personal DTI + credit; lowest rate.
DSCR
20% down · 8.5% · 30yr
- Down + closing
- —
- Monthly P&I
- —
- Monthly cashflow
- —
- DSCR
- —
- Eligible?
- —
No personal income docs; deal must DSCR.
Hard money
10% down · 12.0% · 12mo
- Down + closing
- —
- Monthly P&I
- —
- Monthly cashflow
- —
- DSCR
- —
- Eligible?
- —
Short-term bridge; refi at stabilization.
Rent comps 3 comps
| Address | Beds | Baths | Sqft | Rent | $/sqft | DOM | Units | Dist |
|---|---|---|---|---|---|---|---|---|
| 7608 Julia Dr Sellersburg, IN | 3.0 | 2.0 | 1500 | $2,000 | $1.33 | 1d | 1 | 0.71mi |
| 1026 Sweet Amy Way Sellersburg, IN | 3.0 | 2.5 | 1288 | $1,850 | $1.44 | 43d | 1 | 1.09mi |
| 2806 Winchester Dr Sellersburg, IN | 4.0 | 2.0 | 2390 | $2,365 | $0.99 | 1d | 1 | 1.21mi |
HOA detail
- Monthly dues
- $560 · $6,720/yr
Listing history 13 events
-
2026-06-18days on market $106,000 Active 28 DOM
-
2026-06-17days on market $106,000 Active 27 DOM
-
2026-06-16days on market $106,000 Active 26 DOM
-
2026-06-15days on market $106,000 Active 25 DOM
-
2026-06-13days on market $106,000 Active 23 DOM
-
2026-06-10days on market $106,000 Active 20 DOM
-
2026-06-09days on market $106,000 Active 19 DOM
-
2026-06-08days on market $106,000 Active 18 DOM
-
2026-06-07days on market $106,000 Active 17 DOM
-
2026-06-03days on market $106,000 Active 13 DOM
-
2026-06-02days on market $106,000 Active 12 DOM
-
2026-06-01days on market $106,000 Active 11 DOM
-
2026-05-31days on market $106,000 Active 10 DOM
ⓘ Source: listings_history table (triggers on properties + properties_extension) + one-shot
backfill from property_details.listing_events for pre-trigger history.
Nearby sold comps map
Loading sold comps map…
Walkable amenities ~0.75 mi
Loading nearby amenities…
Taxation est. · year 1
- Rental income
- $24,329
- − Mortgage interest
- −$5,938
- − Property taxes
- −$1,590
- − Insurance
- −$530
- − Repairs & maintenance
- −$1,946
- − Management
- −$1,946
- − HOA
- −$6,720
- − Depreciation
- −$3,084
- Taxable income
- $2,575
- Est. tax owed @ 24.0%
- −$618
- After-tax cash flow
- $3,092/yr
For passive investors: Depreciation is non-cash, so a rental often shows a tax loss while cash-flowing — sheltering income. Rental losses are passive: they offset passive income freely, and up to $25,000/yr can offset ordinary (W-2) income if you actively participate and your MAGI is under $100k (phasing out to $0 by $150k); unused losses carry forward. On sale, claimed depreciation is recaptured at up to 25%, and gains may owe capital-gains tax (a 1031 exchange can defer both). Figures are a year-1 estimate at your 24.0% rate — not tax advice; consult a CPA.
Condition & rehab AI · 12 photos
This move-in ready manufactured home is in good condition with a fresh exterior and well-maintained interior. Minor updates to the exterior and interior can further enhance its value and appeal.
Value-add opportunities
- Resale Paint exterior siding — Fresh paint can enhance curb appeal and home value.
- Resale Replace countertops — Modern countertops can increase the home's appeal and value.
- Both Install smart home features — Smart home features can improve convenience and add value for both buyers and renters.
Renovation cost estimate screening
Value-add ROI direction
- Resale Paint exterior siding — Fresh paint can enhance curb appeal and home value. ↑
- Resale Replace countertops — Modern countertops can increase the home's appeal and value. ↑
- Both Install smart home features — Smart home features can improve convenience and add value for both buyers and renters. ↑
ⓘ Cost ranges are severity-bucket heuristics (US national rule-of-thumb). Get contractor quotes + a written scope before underwriting a rehab budget.
Schools (NCES district)
No district data.
Livability — Sellersburg
- Score
- 73/100
- State rank
- #85
- US rank
- #5005
Category grades
Schools grade is shown separately in the Schools card above.
Census & demographics
- Census place
- Sellersburg, IN
- County
- Clark County · 108,879 people
- City population
- 21,045
- Metro
- Louisville/Jefferson County, KY-IN
- Population (ZIP)
- 21,045
- Household income
- $82,503
- Rent vs Own
- Severe rent burden
- 250.0
Population outlook (Clark County) Hauer SSP2
- Today (2025)
- 126,401 people
- By 2030
- 131,455 · +4.0%
- By 2040
- 140,471 · +11.1%
- By 2050
- 147,677 · +16.8%
- By 2075
- 161,702 · +27.9%
- By 2100
- 164,078 · +29.8%
Race, ethnicity, and origin ACS 2023
- Neighborhood character
- Predominantly White (90%)
- Race & ethnicity
- White 90% Two or more races 7% Hispanic / Latino 3% Asian 2%
- Common ancestry
- Romanian 2% Slovak 2% Italian 2%
- Foreign-born
- 3% · Canada
- Languages at home
- 96% English-only · Spanish 2% Vietnamese 1% Other Indo-European 1%
Political lean MEDSL · Clark
- 2024 margin
- Strong R (+20.4) · D 38.9% · R 59.3% · Other 1.8%
- 2008→2024 swing
- -13.3pp toward R · 2008: -7.1pp · 2024: -20.4pp
- All cycles
- 2024: R+20.4 2020: R+18.3 2016: R+22.0 2012: R+9.9 2008: R+7.1
Not yet ingested
- Civics
- —
Market trends
- HPI YoY
- ▼ -114.50%
- Current HPI
- 173.6209
- Rent YoY
- —
- Metro
- Louisville/Jefferson County, KY-IN
- State GDP YoY
- ▲ 2.90%
- F500 in state
- 18
Industry mix (Fortune 500 HQ in IN)
| Industry | F500 HQs | Revenue |
|---|---|---|
| Industrial Machinery | 2 | $37B |
|
||
| Healthcare | 1 | $177B |
|
||
| Pharmaceuticals | 1 | $45B |
|
||
| Metals / Steel | 1 | $18B |
|
||
| Agriculture | 1 | $17B |
|
||
| Packaging | 1 | $12B |
|
||
Cash-flow waterfall
monthlySold comps — $/sqft
last 12 mo · ≤1 miLoading sold comps…