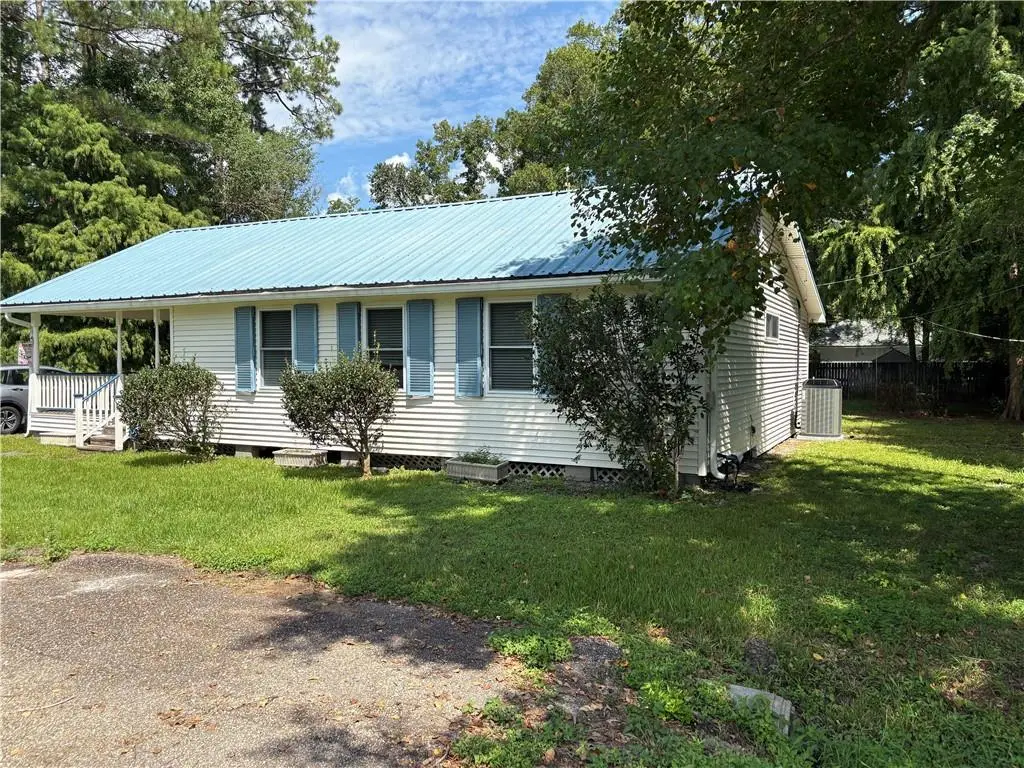
1732 Barbara Dr · Slidell, LA
Flood risk 7/10 · Major
- FEMA flood zone
- —
- Chance of flooding over 30 yrs
- 0.74%
- Est. flood insurance / yr
- —
Fire risk 3/10 · Minor
- Est. fire insurance / yr
- $1,269 – $2,357
Heat risk 9/10 · Severe
- Hot days now (above 108°F)
- 7 days/yr
- Hot days in 30 yrs
- 20 days/yr
Wind risk 9/10 · Severe
- Chance of severe wind over 30 yrs
- 99.0%
Air-quality risk 2/10 · Minimal
- Unhealthy air days now
- 1 days/yr
- Unhealthy air days in 30 yrs
- 2 days/yr
Risk factors via First Street. Map © Google.
Why this score? — see what drove the B grade
The composite is a weighted blend of 9 inputs, each scored 0–100. Each bar is that input's sub-score; the figure is the points it added to the 100-point composite (weight × sub-score).
- Cash flow +27.5/30.0
- ARV discount +14.9/15.0
- DSCR +9.7/10.0
- 1% rule +6.3/10.0
- Schools +4.3/10.0
- Rent growth +4.0/5.0
- Livability +3.5/5.0
- Condition / age +2.5/5.0
- Appreciation +0.0/10.0
$175,000
🖨 Deal sheet (PDF) 📄 Offer letter ✓ Due diligence
Listing remarks MLS
RELAX ON THE DECK OR FRONT PORCH OF THIS 3BR/2BA HOME WITH A FULL OFFICE * VERY UPDATED HOME AND ALL NEW WINDOWS * WOOD & NAPCO TILE FLOORING * GAS FIREPLACE * JETTED GARDEN TUB & SEP SHOWER IN PRIMARY BATH * CATHEDRAL CEILINGS IN LIVING ROOM * SOLID WOOD CHERRY CABINETS * NEWER APPLIANCES, NEWER A/C, NEWER WATER HEATER, NO CARPET DETACHED GARAGE * FEELS LIKE YOU'RE IN THE COUNTRY -AT END OF STREET * LARGE LOT * This property qualifies for 100 % financing!!! Bring your buyers for this great deal.
Key facts
- 0.3 acre lot
- Garage
- Built 1984
Neighborhood map
What this means for you Summary
Snapshot
- This is a 3-bed/2.0-bath single-family listed at $175k.
Deal economics
- At list price, monthly cash flow is $519 ($6k/yr) — positive.
- The deal already cash-flows at list — no discount required.
- Meets the 1% rule at list price ($2k rent vs $175k).
- Recommended offer: $164k (6.0% below list) — sets the bar for market timing.
- Cap rate 9.9% vs local median 5.9% in Slidell — top-decile yield for the area; either an underpriced asset or a hidden risk that comps aren't pricing in. Stress-test before assuming the spread holds.
Location & tenants
- Location reads 70/100 on livability (#57 in LA) — a middle-class / working-renter tenant base. Strengths: cost of living A+, housing A+, health & safety A+; Watch: amenities F, commute F.
- St. Tammany Parish (suburban): math 43% / reading 55% proficiency, ranked #11 of 98 in LA (top 11%) — families likely to look elsewhere, expect single-tenant / working-renter base with shorter leases.
- Zoned schools: Bayou Woods Elementary School (math 52% / reading 47%, grade D, #129 of 646 statewide, top 21%, 432 students, 72% FRL); Slidell Junior High School (math 25% / reading 47%, grade F, #84 of 218 statewide, top 41%, 823 students, 60% FRL); Slidell High School (math 34% / reading 41%, grade F, #93 of 265 statewide, top 36%, 1,883 students, 52% FRL) — zoned schools average 61% FRL vs 40% district-wide (22 pts higher); higher-poverty schools than district average — tighter screening recommended.
- Market conditions: Rents rising fast (+5.9%/yr); 246 active listings in the ZIP; 9 comparable units currently listed for rent nearby; rentals lingering (median 45d on market — plan ~5-8 weeks vacancy on turnover, expect pricing pressure); 78% of comp listings sitting > 30 days — soft ceiling on asking rent; 1,064 units permitted in St. Tammany Parish in 2024 (0 in 5+ unit buildings).
- This rent runs 38% of the median local income ($63k/yr) — at the standard rent-burdened threshold; future hikes will face affordability resistance.
Forward outlook
- Local home prices are declining (-3.0%/yr); year-one equity from $1k of loan paydown is wiped out by about $5k of value loss. Plan a longer hold.
- St. Tammany County population projected at +27% by 2050 — long-run rental-demand tailwind backs the buy-and-hold thesis.
- At projected returns (-3.0% appreciation + 5.9% rent growth), your $49k cash investment doubles in ~8 years — after that, you're playing with house money.
Negotiation context
- It's been on market 63 days — a 6% lower offer ($164k) is reasonable based on typical stale-listing flexibility.
- 7 sale attempts since 22y ago; this cycle's ask has dropped $14k (7%) from the opening price — seller is motivated, your offer sets the floor, not the list.
- Current owner paid $130k; 35% above their basis — modest negotiation headroom, anchor on the comps not their cost.
Risks & watch-outs
- Climate carrying-cost: major flood risk; severe wind risk, 99% chance of damaging wind over 30y; extreme-heat days projected 7→20/yr by 2055 (HVAC capex compounding) — expect insurance premiums to compound above CPI over the hold.
Questions for the listing agent
- It's been on market 63 days. Have you received any prior offers? Is the seller open to a 6% concession, seller financing, or rate buy-down credit?
- Why hasn't it sold? Are there any deal-killer items the seller is aware of (foundation, flood, title, zoning, code violations)?
- Is there a deadline driving the sale (1031 exchange, divorce, estate, relocation)? That informs how much negotiation room exists.
- Schools are B-rated — typically a magnet for longer-tenancy family renters. What's the average tenant stay here, and is there a school-zone premium baked into asking?
- What's the average days-on-market for RENTAL listings here right now (not sales)? A rising rental-DOM trend means longer vacancies and softer asking-rent achievability than the comps imply.
- What's the recent tenant-quality profile in this submarket — average credit score on applications, eviction rate, late-payment / NSF rate, and stable-employment percentage? A property-management company in the area should have these aggregated.
- How much new for-sale + rental construction is in the pipeline within 1–3 miles? Heavy new supply typically softens prices + rents 12–24 months out; constrained supply supports both.
Investment metrics
- 1% rule
- 1.13% ✓
- Cap rate
- 9.85%
- Cash-on-cash
- 12.71%
- DSCR
- 1.57
- GRM
- 7.4
CMA / ARV
- ARV (median comp)
- $209,580
- List price
- $175,000
- Delta
- -16.50%
- Verdict
- UNDERPRICED
- Comps
- 20 within 1.0 mi
Show comp detail 12 sales within ~0.75 mi
| Address | Dist | Beds/Ba | Sqft | Sold | Price | $/sf | Match |
|---|---|---|---|---|---|---|---|
| 314 Raleigh Dr | 0.48mi | 3/2.0 | 1,755 (+0%) | 9mo | $220,000 | $125 | 70 |
| 201 Drury Ln | 0.68mi | 3/2.0 | 1,648 (-6%) | 2mo | $170,000 | $103 | 57 |
| 317 Raleigh Dr | 0.53mi | 4/2.0 (+1) | 1,810 (+3%) | 11mo | $240,000 | $133 | 55 |
| 319 Westminster Dr | 0.75mi | 3/2.0 | 1,648 (-6%) | 2mo | $228,500 | $139 | 54 |
| 213 Drury Ln | 0.71mi | 3/2.0 | 1,588 (-9%) | 1mo | $191,000 | $120 | 51 |
| 308 Westminster Dr | 0.69mi | 4/2.0 (+1) | 1,868 (+7%) | 1mo | $220,000 | $118 | 51 |
| 211 Holmes Dr | 0.61mi | 3/2.0 | 1,560 (-11%) | 3mo | $235,000 | $151 | 50 |
| 313 Westminster Dr | 0.72mi | 4/2.0 (+1) | 1,600 (-9%) | 2mo | $210,000 | $131 | 46 |
| 217 Portsmouth Dr | 0.69mi | 4/2.0 (+1) | 1,576 (-10%) | 2mo | $220,000 | $140 | 44 |
| 327 Holmes Dr | 0.75mi | 4/2.0 (+1) | 1,590 (-9%) | 5mo | $240,000 | $151 | 41 |
| 1037 Saint Joseph St | 0.73mi | 4/2.0 (+1) | 1,908 (+9%) | 8mo | $244,900 | $128 | 39 |
| 225 Drury Ln | 0.75mi | 4/2.0 (+1) | 1,525 (-13%) | 6mo | $154,000 | $101 | 34 |
Match score weights: distance 35% · size 25% · config 20% · recency 20%. Top-matched comps best support the ARV.
Projected returns pro-forma
-3.0% appreciation · 5.91% rent growth · sell at horizon
- IRR
- 5.4%
- Equity multiple
- 1.22×
- Total profit
- $10,592
- Equity at exit
- $26,093
- IRR
- 17.1%
- Equity multiple
- 2.58×
- Total profit
- $77,518
- Equity at exit
- $15,131
Cash invested: $49,000 (down + closing). Projections, not guarantees.
Landlord ↔ Tenant lean methodology
- Overall (STATE)
- 90 Strongly Landlord-Friendly
- State Louisiana
- 90 Strongly Landlord-Friendly · R+12
- County
- — inherits STATE
- City
- — inherits STATE
ZIP-level market 70460
- Rents YoY
- 5.9%
- Active inventory
- 246
- Price-to-rent
- 7.4×
Monthly cashflow live
- Estimated rent
- $1,983 high interval (Pro) →
- Mortgage (P&I)
- −$918
- Tax from tax record
- −$57 /mo · $684/yr
- Insurance
- −$73
- HOA
- −$0
- Vacancy / Maint / Mgmt
- −$416
- Net cashflow
- $519
Break-even live
Sensitivity live
| Price | -10% $618 | -5% $568 | +0% $519 | +5% $469 | +10% $420 |
|---|---|---|---|---|---|
| Rent | -10% $362 | -5% $441 | +0% $519 | +5% $597 | +10% $675 |
| Rate | -1.0pp $607 | -0.5pp $563 | base $519 | +0.5pp $473 | +1.0pp $427 |
UW: 25.0% down · 7.5% · 30yr · 1.5% tax · 5.0% vac · 8.0% maint · 8.0% mgmt
Financing live
Cash to close
- Down payment
- $43,750
- Closing costs
- $5,250
- Reserves months
- —
- Total cash needed
- —
Loan-product check · same deal, 3 products live
Conventional
25% down · 7.5% · 30yr
- Down + closing
- —
- Monthly P&I
- —
- Monthly cashflow
- —
- DSCR
- —
- Eligible?
- —
Personal DTI + credit; lowest rate.
DSCR
20% down · 8.5% · 30yr
- Down + closing
- —
- Monthly P&I
- —
- Monthly cashflow
- —
- DSCR
- —
- Eligible?
- —
No personal income docs; deal must DSCR.
Hard money
10% down · 12.0% · 12mo
- Down + closing
- —
- Monthly P&I
- —
- Monthly cashflow
- —
- DSCR
- —
- Eligible?
- —
Short-term bridge; refi at stabilization.
Rent comps 9 comps
| Address | Beds | Baths | Sqft | Rent | $/sqft | DOM | Units | Dist |
|---|---|---|---|---|---|---|---|---|
| 308 Raleigh Dr Slidell, LA | 4.0 | 2.5 | 2292 | $2,125 | $0.93 | 45d | 1 | 0.46mi |
| 36409 Jackson Rd Slidell, LA | 4.0 | 2.0 | 1670 | $2,100 | $1.26 | 45d | 1 | 0.51mi |
| 35567 Liberty Dr Slidell, LA | 3.0 | 2.0 | 1232 | $1,650 | $1.34 | 46d | 1 | 0.82mi |
| 110 Charles Dr Slidell, LA | 4.0 | 2.0 | 2210 | $2,175 | $0.98 | 13d | 1 | 0.82mi |
| 1111 Saint Scholastica St Slidell, LA | 3.0 | 2.0 | 2037 | $2,000 | $0.98 | 25d | 1 | 0.83mi |
| 444 Holmes Dr Slidell, LA | 4.0 | 2.0 | 1594 | $1,800 | $1.13 | 46d | 1 | 1.01mi |
| 35363 Melody Ln Slidell, LA | 3.0 | 2.0 | 1510 | $1,800 | $1.19 | 45d | 1 | 1.08mi |
| 35621 Oak Ridge Ave Slidell, LA | 3.0 | 2.0 | 1406 | $1,800 | $1.28 | 45d | 1 | 1.33mi |
| 58019 Carroll Rd Slidell, LA | 4.0 | 2.0 | 1400 | $1,695 | $1.21 | 45d | 1 | 1.45mi |
Listing history 29 events
-
2026-06-21days on market $175,000 Active 63 DOM
-
2026-06-18days on market $175,000 Active 60 DOM
-
2026-06-17days on market $175,000 Active 59 DOM
-
2026-06-16days on market $175,000 Active 58 DOM
-
2026-06-15price $175,000 Active 57 DOM
-
2026-06-15days on market $187,000 Active 57 DOM
-
2026-06-13days on market $187,000 Active 55 DOM
-
2026-06-10days on market $187,000 Active 52 DOM
-
2026-06-09days on market $187,000 Active 51 DOM
-
2026-06-08days on market $187,000 Active 50 DOM
-
2026-06-07days on market $187,000 Active 49 DOM
-
2026-06-03days on market $187,000 Active 45 DOM
-
2026-06-02days on market $187,000 Active 44 DOM
-
2026-06-01days on market $187,000 Active 43 DOM
-
2026-05-31days on market $187,000 Active 42 DOM
-
2026-04-18$189,000 Active 516-char remark
Show marketing remark (491 chars)
RELAX ON THE DECK OR FRONT PORCH OF THIS 3BR/2BA HOME WITH A FULL OFFICE *VERY UPDATED HOME AND ALL NEW WINDOWS*WOOD & NAPCO TILE FLOORING*GAS FIREPLACE*JETTED GARDEN TUB & SEP SHOWER IN PRIMARY BATH*CATHEDRAL CEILINGS IN LIVING ROOM*SOLID WOOD CHERRY CABINETS*NEWER APPLIANCES, NEWER A/C, NEWER WATER HEATER, NO CARPET DETACHED GARAGE*FEELS LIKE YOU'RE IN THE COUNTRY -AT END OF STREET*LARGE LOT* This property qualifies for 100 % financing!!! Bring your buyers for this great deal.
-
2026-04-18$189,000 Active 491-char remark
Show marketing remark (491 chars)
RELAX ON THE DECK OR FRONT PORCH OF THIS 3BR/2BA HOME WITH A FULL OFFICE *VERY UPDATED HOME AND ALL NEW WINDOWS*WOOD & NAPCO TILE FLOORING*GAS FIREPLACE*JETTED GARDEN TUB & SEP SHOWER IN PRIMARY BATH*CATHEDRAL CEILINGS IN LIVING ROOM*SOLID WOOD CHERRY CABINETS*NEWER APPLIANCES, NEWER A/C, NEWER WATER HEATER, NO CARPET DETACHED GARAGE*FEELS LIKE YOU'RE IN THE COUNTRY -AT END OF STREET*LARGE LOT* This property qualifies for 100 % financing!!! Bring your buyers for this great deal.
-
2025-10-23price $189,000
-
2025-10-23price $189,000
-
2025-10-09price $197,500
-
2025-10-09price $197,500
-
2025-09-01$199,500 Active
-
2005-11-30soldstatus $130,000
-
2005-08-23$130,000
-
2005-08-23$130,000
-
2004-09-28soldstatus $116,900
-
2004-09-20soldstatus $116,900
-
2004-06-01$119,900
-
2004-06-01$119,900
ⓘ Source: listings_history table (triggers on properties + properties_extension) + one-shot
backfill from property_details.listing_events for pre-trigger history.
Tax reassessment forecast LA · Resets to sale price
- Current annual tax
- $684 · $57/mo
- Projected year-2 tax
- $962 · $80/mo
- Expected delta
- +$278/yr (+$23/mo · 40.7%)
ⓘ Screening estimate from a state-policy table — verify with the county assessor before closing.
Climate risk First Street
- Flood 7/10 Severe 74% chance over 30 yrs
- Wildfire 3/10 Moderate
- Heat 9/10 Extreme 7 d/yr ≥108°F today · 20 d/yr by 30 yrs out
- Wind 9/10 Extreme 99% chance of damaging wind over 30 yrs
- Air quality 2/10 Low 1 unhealthy d/yr today · 2 by 30 yrs out
Nearby sold comps map
Loading sold comps map…
Walkable amenities ~0.75 mi
Loading nearby amenities…
Taxation est. · year 1
- Rental income
- $23,795
- − Mortgage interest
- −$9,803
- − Property taxes
- −$684
- − Insurance
- −$875
- − Repairs & maintenance
- −$1,904
- − Management
- −$1,904
- − Depreciation
- −$5,091
- Taxable income
- $3,535
- Est. tax owed @ 24.0%
- −$848
- After-tax cash flow
- $5,378/yr
For passive investors: Depreciation is non-cash, so a rental often shows a tax loss while cash-flowing — sheltering income. Rental losses are passive: they offset passive income freely, and up to $25,000/yr can offset ordinary (W-2) income if you actively participate and your MAGI is under $100k (phasing out to $0 by $150k); unused losses carry forward. On sale, claimed depreciation is recaptured at up to 25%, and gains may owe capital-gains tax (a 1031 exchange can defer both). Figures are a year-1 estimate at your 24.0% rate — not tax advice; consult a CPA.
Schools (NCES district)
- District
- St. Tammany Parish
- NCES district ID
- 2201650
- Math proficiency
- 43% ▼ -32.00%
- Reading proficiency
- 55% ▼ -26.00%
- Median HH income
- $61,752
- Composite
- 43.04/100
- National rank
- #3098
- State rank
- #11 of 98 in LA
Livability — Slidell
- Score
- 70/100
- State rank
- #57
- US rank
- #7673
Category grades
Schools grade is shown separately in the Schools card above.
Census & demographics
- County
- Saint Tammany Parish · 228,296 people
- City population
- 95,511
- Metro
- New Orleans-Metairie, LA
- Population (ZIP)
- 21,669
- Household income
- $62,565
- Rent vs Own
- Severe rent burden
- 318.0
Population outlook (St. Tammany County) Hauer SSP2
- Today (2025)
- 286,725 people
- By 2030
- 304,175 · +6.1%
- By 2040
- 336,203 · +17.3%
- By 2050
- 364,590 · +27.2%
- By 2075
- 433,362 · +51.1%
- By 2100
- 470,333 · +64.0%
Race, ethnicity, and origin ACS 2023
- Neighborhood character
- Diverse neighborhood (Simpson 0.62)
- Race & ethnicity
- White 53% Black 29% Two or more races 11% Hispanic / Latino 10% Pacific Islander 2%
- Hispanic origin (detail)
- Mexican 3%
- Common ancestry
- Lithuanian 13% Slovak 1% Italian 1%
- Foreign-born
- 5% · Canada
- Languages at home
- 92% English-only · Spanish 6%
Political lean MEDSL · St. Tammany
- 2024 margin
- Solid R (+43.8) · D 27.3% · R 71.1% · Other 1.6%
- 2008→2024 swing
- +9.6pp toward D · 2008: -53.4pp · 2024: -43.8pp
- All cycles
- 2024: R+43.8 2020: R+44.2 2016: R+50.8 2012: R+52.2 2008: R+53.4
Not yet ingested
- Civics
- —
Market trends
- HPI YoY
- ▼ -93.87%
- Current HPI
- 130.56
- Rent YoY
- ▲ 5.91%
- Metro
- New Orleans-Metairie, LA
- State GDP YoY
- ▲ 3.29%
- F500 in state
- 10
Industry mix (Fortune 500 HQ in LA)
| Industry | F500 HQs | Revenue |
|---|---|---|
| Telecommunications | 2 | $23B |
|
||
| Utilities | 1 | $12B |
|
||
| Wholesale / Distribution | 1 | $5B |
|
||
| Advertising | 1 | $2B |
|
||
Price history
+57.6% since first listed14 events — show timeline
- 2026-04-18 Listed $189,000 AcadianaMLS
- 2026-04-18 Listed $189,000 GSREIN
- 2025-10-23 Price Changed $189,000 AcadianaMLS
- 2025-10-23 Price Changed $189,000 GSREIN
- 2025-10-09 Price Changed $197,500 AcadianaMLS
- 2025-10-09 Price Changed $197,500 GSREIN
- 2025-09-01 Listed $199,500 AcadianaMLS
- 2005-11-30 Sold (MLS) $130,000 GSREIN
- 2005-08-23 Listed $130,000 AcadianaMLS
- 2005-08-23 Listed $130,000 GSREIN
- 2004-09-28 Sold (Public Records) $116,900 Public Records
- 2004-09-20 Sold (MLS) $116,900 GSREIN
- 2004-06-01 Listed $119,900 AcadianaMLS
- 2004-06-01 Listed $119,900 GSREIN
Property tax history
-9.4%/yrLatest (2025): $684 · -3.7% YoY. Source: county tax records.
Cash-flow waterfall
monthlySold comps — $/sqft
last 12 mo · ≤1 miLoading sold comps…