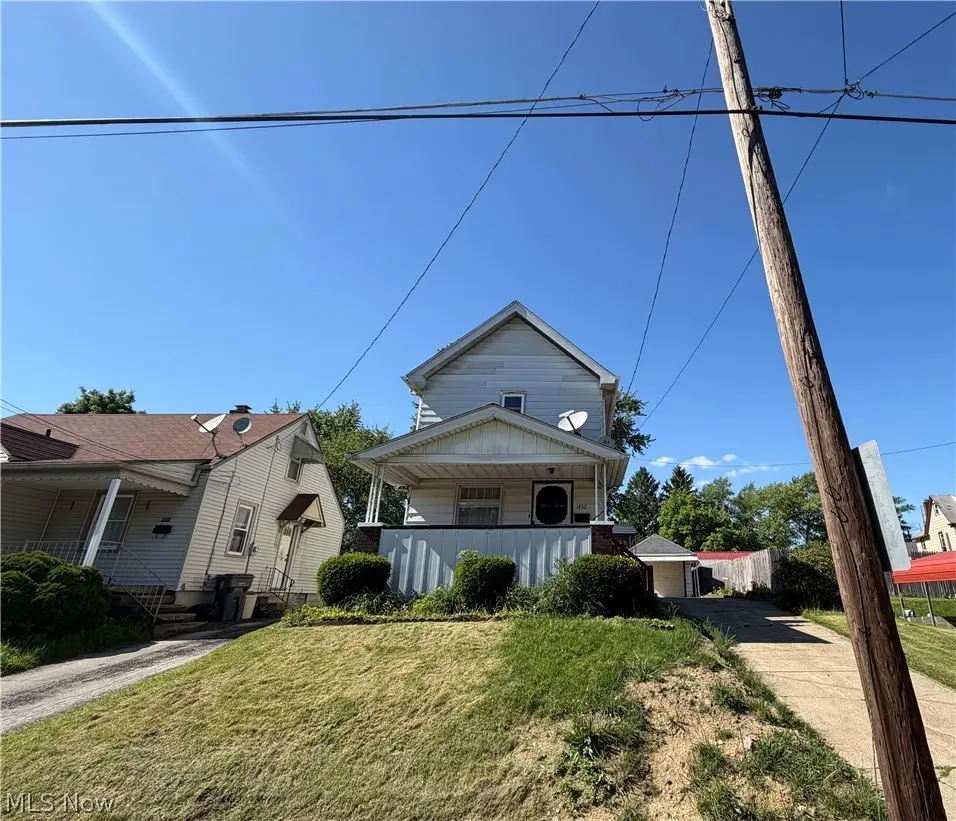
1452 Humbolt Ave · Youngstown, OH
Flood risk 1/10 · Minimal
- FEMA flood zone
- X (unshaded)
- Chance of flooding over 30 yrs
- 0.0%
- Est. flood insurance / yr
- $473 – $860
Fire risk 1/10 · Minimal
- Est. fire insurance / yr
- $713 – $1,323
Heat risk 3/10 · Minor
- Hot days now (above 97°F)
- 7 days/yr
- Hot days in 30 yrs
- 17 days/yr
Wind risk 1/10 · Minimal
- Chance of severe wind over 30 yrs
- —
Air-quality risk 3/10 · Minor
- Unhealthy air days now
- 1 days/yr
- Unhealthy air days in 30 yrs
- 4 days/yr
Risk factors via First Street. Map © Google.
Why this score? — see what drove the B grade
The composite is a weighted blend of 9 inputs, each scored 0–100. Each bar is that input's sub-score; the figure is the points it added to the 100-point composite (weight × sub-score).
- Cash flow +29.4/30.0
- DSCR +10.0/10.0
- ARV discount +9.6/15.0
- 1% rule +8.2/10.0
- Appreciation +5.9/10.0
- Livability +4.0/5.0
- Rent growth +2.5/5.0
- Condition / age +2.5/5.0
- Schools +0.9/10.0
$85,000
🖨 Deal sheet 📄 Offer letter ✓ Due diligence
Listing remarks
Attention first-time buyers and savvy investors. .. this is the one you've been waiting for! This 2-bedroom, 1.5-bath Youngstown charmer is packed with potential and priced to move at $85,000. Built in 1927 with classic character, this two-story features hardwood floor under the carpet, spacious bedrooms with ceiling fans, a covered front porch, detached 1.5 car garage, and a full unfinished basement ready for your finishing touches. Bonus space off the second bedroom has updated electric and could easily serve as a third room. Major mechanicals have been taken care of for you including a newer furnace (2025), new hot water tank (2026), serviced electrical panel (2025), and the main water l
Key facts
- Covered front porch
- Updated electric
- 4,225 sq ft lot
Tags
Property features AI
Exterior
- Parking: Detached garage (1.5-car); Carport (1 space)
- Utilities: Public water; Public sewer
- Home design: Two-story vinyl-sided home; Asphalt/fiberglass roof
- Construction: Vinyl siding; Asphalt/fiberglass roof; Concrete basement
- Exterior features: Small yard on a 0.097-acre lot
Interior
- Kitchen: Kitchen on the first floor
- Bedrooms: Two upstairs bedrooms (carpeted)
- Flooring: Carpet in primary living areas and bedrooms
- Bathrooms: One full bathroom; One half bathroom (main level)
- Heating & cooling: Forced air heating; Central air; Ceiling fans; Wall-mounted cooling units
- Interior features: Basement with concrete construction
Neighborhood map
What this means for you Summary
Snapshot
- This is a 2-bed/1.0-bath single-family listed at $85k.
Deal economics
- At list price, monthly cash flow is $301 ($4k/yr) — positive.
- The deal already cash-flows at list — no discount required.
- Meets the 1% rule at list price ($1k rent vs $85k).
- Recommended offer: $84k (1.5% below list) — sets the bar for market timing.
- Cap rate 10.5% vs local median 7.0% in Youngstown — top-decile yield for the area; either an underpriced asset or a hidden risk that comps aren't pricing in. Stress-test before assuming the spread holds.
Location & tenants
- Location reads 81/100 on livability (#99 in OH, #1,506 nationally) — a professional / high-income tenant draw. Strengths: amenities A+, commute A+, cost of living A+; Watch: crime F, employment F.
- Youngstown City (urban): math 8% / reading 17% proficiency, ranked #649 of 656 in OH (top 99%) — low school quality limits family demand, transient renter base, plan for 1-2y turnover; 88% free/reduced lunch — lower-income household profile, screen leases tightly.
- Market conditions: 45 active listings in the ZIP; 7 comparable units currently listed for rent nearby; rentals at typical pace (median 21d on market — plan ~3-4 weeks tenant-placement turnaround); 43% of comp listings sitting > 30 days — soft ceiling on asking rent; lower-income renter base — watch delinquency; 147 units permitted in Mahoning County in 2024 (0 in 5+ unit buildings).
- This rent runs 43% of the median local income ($31k/yr) — at the standard rent-burdened threshold; future hikes will face affordability resistance.
Forward outlook
- In year one you build about $2k of equity ($588 loan paydown + $2k appreciation (1.8% local appreciation)).
- Mahoning County population projected at -14% by 2050 — secular population decline; favor cash flow + early exit over multi-decade hold.
- At projected returns (1.8% appreciation + 3.0% rent growth), your $24k cash investment doubles in ~4 years — after that, you're playing with house money.
Negotiation context
- It's been on market 21 days — a 2% lower offer ($84k) is reasonable based on typical stale-listing flexibility.
- 2 sale attempts since 34y ago with the ask held roughly flat each time — persistent listings suggest the price (not the market) is what's stuck; bring a comps-based counter.
- Current owner paid $35k; list at $85k implies a 143% gain — meaningful room to come down on a strong offer.
Risks & watch-outs
- Watch-outs: built in 1927 — expect roof / HVAC / electrical / plumbing capex.
Questions for the listing agent
- Built in 1927 — when were the roof, HVAC, electrical panel, plumbing, and water heater last replaced?
- Is there a deadline driving the sale (1031 exchange, divorce, estate, relocation)? That informs how much negotiation room exists.
- Crime grade is F in this area — have there been break-ins, vandalism, or insurance claims at this property in the last 3 years? What carrier currently insures it and at what premium?
- What's the average days-on-market for RENTAL listings here right now (not sales)? A rising rental-DOM trend means longer vacancies and softer asking-rent achievability than the comps imply.
- What's the recent tenant-quality profile in this submarket — average credit score on applications, eviction rate, late-payment / NSF rate, and stable-employment percentage? A property-management company in the area should have these aggregated.
- How much new for-sale + rental construction is in the pipeline within 1–3 miles? Heavy new supply typically softens prices + rents 12–24 months out; constrained supply supports both.
Investment metrics
- 1% rule
- 1.32% ✓
- Cap rate
- 10.54%
- Cash-on-cash
- 15.16%
- DSCR
- 1.67
- GRM
- 6.3
CMA / ARV
- ARV (on-the-fly)
- $89,216
- Comps found
- 12
Show comp detail 12 sales within ~0.75 mi
| Address | Dist | Beds/Ba | Sqft | Sold | Price | $/sf | Match |
|---|---|---|---|---|---|---|---|
| 2692 Taft Ave | 0.04mi | 3/1.0 (+1) | 990 (-9%) | 3mo | $30,000 | $30 | 75 |
| 2675 Hunter Ave | 0.11mi | 2/1.0 | 1,020 (-6%) | 12mo | $58,000 | $57 | 74 |
| 3222 Sheridan Rd | 0.29mi | 3/1.0 (+1) | 1,008 (-7%) | 6mo | $110,000 | $109 | 64 |
| 1321 Detroit Ave | 0.45mi | 3/2.0 (+1) | 1,001 (-8%) | 2mo | $60,000 | $60 | 56 |
| 3332 Sheridan Rd | 0.37mi | 2/1.0 | 924 (-15%) | 3mo | $56,005 | $61 | 55 |
| 1146 Detroit Ave | 0.45mi | 3/2.0 (+1) | 1,042 (-4%) | 12mo | $115,360 | $111 | 53 |
| 3304 Tangent St | 0.32mi | 3/1.0 (+1) | 1,224 (+12%) | 11mo | $120,000 | $98 | 50 |
| 1140 Inverness Ave | 0.52mi | 3/2.0 (+1) | 1,210 (+11%) | 10mo | $99,000 | $82 | 39 |
| 827 E Avondale Ave | 0.69mi | 3/1.0 (+1) | 1,224 (+12%) | 4mo | $64,000 | $52 | 38 |
| 808 Marmion Ave | 0.67mi | 2/1.5 | 928 (-15%) | 4mo | $96,600 | $104 | 38 |
| 1709 S Heights Ave | 0.73mi | 3/2.0 (+1) | 1,216 (+12%) | 6mo | $66,000 | $54 | 32 |
| 3508 Loveland Rd | 0.67mi | 3/2.0 (+1) | 1,232 (+13%) | 13mo | $130,000 | $106 | 27 |
Match score weights: distance 35% · size 25% · config 20% · recency 20%. Top-matched comps best support the ARV.
Projected returns pro-forma
1.78% appreciation · 3.0% rent growth · sell at horizon
- IRR
- 19.0%
- Equity multiple
- 2.01×
- Total profit
- $24,035
- Equity at exit
- $32,504
- IRR
- 21.3%
- Equity multiple
- 3.76×
- Total profit
- $65,790
- Equity at exit
- $46,033
Cash invested: $23,800 (down + closing). Projections, not guarantees.
Landlord ↔ Tenant lean methodology
- Overall (STATE)
- 73 Landlord-Friendly
- State Ohio
- 73 Landlord-Friendly · R+6
- County
- — inherits STATE
- City
- — inherits STATE
ZIP-level market 44502
- Home prices YoY
- 0.7%
- Active inventory
- 45
- Price-to-rent
- 6.3×
Monthly cashflow live
- Estimated rent
- $1,124 high interval (Pro) →
- Mortgage (P&I)
- −$446
- Tax est. 1.5%
- −$106 /mo · $1,275/yr
- Insurance
- −$35
- HOA
- −$0
- Vacancy / Maint / Mgmt
- −$236
- Net cashflow
- $301
Break-even live
UW: 25.0% down · 7.5% · 30yr · 1.5% tax · 5.0% vac · 8.0% maint · 8.0% mgmt
Financing live
Cash to close
- Down payment
- $21,250
- Closing costs
- $2,550
- Reserves months
- —
- Total cash needed
- —
Loan-product check · same deal, 3 products live
Conventional
25% down · 7.5% · 30yr
- Down + closing
- —
- Monthly P&I
- —
- Monthly cashflow
- —
- DSCR
- —
- Eligible?
- —
Personal DTI + credit; lowest rate.
DSCR
20% down · 8.5% · 30yr
- Down + closing
- —
- Monthly P&I
- —
- Monthly cashflow
- —
- DSCR
- —
- Eligible?
- —
No personal income docs; deal must DSCR.
Hard money
10% down · 12.0% · 12mo
- Down + closing
- —
- Monthly P&I
- —
- Monthly cashflow
- —
- DSCR
- —
- Eligible?
- —
Short-term bridge; refi at stabilization.
Rent comps 7 comps
| Address | Beds | Baths | Sqft | Rent | $/sqft | DOM | Units | Dist |
|---|---|---|---|---|---|---|---|---|
| 1803 Pointview Ave Youngstown, OH | 2.0 | 1.0 | 950 | $1,000 | $1.05 | 43d | 1 | 0.72mi |
| 1914 S Heights Ave Youngstown, OH | 3.0 | 1.0 | 1115 | $1,950 | $1.75 | 43d | 1 | 0.79mi |
| 512 E Philadelphia Ave Unit 1 Youngstown, OH | 2.0 | 1.0 | 1200 | $899 | $0.75 | 21d | 1 | 0.98mi |
| 834 E Midlothian Blvd Youngstown, OH | 1.0 | 1.0 | 708 | $750 | $1.06 | 13d | 1 | 1.00mi |
| 2002 Brownlee Ave Youngstown, OH | 1.0 | 1.0 | 820 | $875 | $1.07 | 43d | 1 | 1.13mi |
| 2523 E Midlothian Blvd Apt 5 Struthers, OH | 2.0 | 1.0 | 750 | $800 | $1.07 | 13d | 1 | 1.23mi |
| 610 Elm St Struthers, OH | 3.0 | 1.0 | 1050 | $1,500 | $1.43 | 13d | 1 | 1.34mi |
Listing history 17 events
-
2026-06-19days on market $85,000 Active 21 DOM
-
2026-06-18days on market $85,000 Active 20 DOM
-
2026-06-17days on market $85,000 Active 19 DOM
-
2026-06-16days on market $85,000 Active 18 DOM
-
2026-06-15days on market $85,000 Active 17 DOM
-
2026-06-14days on market $85,000 Active 15 DOM
-
2026-06-13days on market $85,000 Active 14 DOM
-
2026-06-10days on market $85,000 Active 12 DOM
-
2026-06-09days on market $85,000 Active 11 DOM
-
2026-06-08days on market $85,000 Active 10 DOM
-
2026-06-07days on market $85,000 Active 9 DOM
-
2026-06-03days on market $85,000 Active 5 DOM
-
2026-06-02days on market $85,000 Active 4 DOM
-
2026-06-01days on market $85,000 Active 3 DOM
-
2026-05-31days on market $85,000 Active 2 DOM
-
2026-05-30remarks 699-char remark
-
2026-05-30$85,000 Active 1 DOM
ⓘ Source: listings_history table (triggers on properties + properties_extension) + one-shot
backfill from property_details.listing_events for pre-trigger history.
Climate risk First Street
- Flood 1/10 Low FEMA zone X (unshaded) · 0% chance over 30 yrs
- Wildfire 1/10 Low
- Heat 3/10 Moderate 7 d/yr ≥97°F today · 17 d/yr by 30 yrs out
- Wind 1/10 Low
- Air quality 3/10 Moderate 1 unhealthy d/yr today · 4 by 30 yrs out
Nearby sold comps map
Loading sold comps map…
Walkable amenities ~0.75 mi
Loading nearby amenities…
Taxation est. · year 1
- Rental income
- $13,490
- − Mortgage interest
- −$4,761
- − Property taxes
- −$1,275
- − Insurance
- −$425
- − Repairs & maintenance
- −$1,079
- − Management
- −$1,079
- − Depreciation
- −$2,473
- Taxable income
- $2,398
- Est. tax owed @ 24.0%
- −$575
- After-tax cash flow
- $3,033/yr
For passive investors: Depreciation is non-cash, so a rental often shows a tax loss while cash-flowing — sheltering income. Rental losses are passive: they offset passive income freely, and up to $25,000/yr can offset ordinary (W-2) income if you actively participate and your MAGI is under $100k (phasing out to $0 by $150k); unused losses carry forward. On sale, claimed depreciation is recaptured at up to 25%, and gains may owe capital-gains tax (a 1031 exchange can defer both). Figures are a year-1 estimate at your 24.0% rate — not tax advice; consult a CPA.
Schools (NCES district)
- District
- Youngstown City
- NCES district ID
- 3904516
- Math proficiency
- 8% ▼ -15.00%
- Reading proficiency
- 17% ▼ -10.00%
- Median HH income
- $25,257
- Composite
- 9.29/100
- National rank
- #9858
- State rank
- #649 of 656 in OH
Livability — Youngstown
- Score
- 81/100
- State rank
- #99
- US rank
- #1506
Category grades
Schools grade is shown separately in the Schools card above.
Census & demographics
- Census place
- Youngstown, OH
- County
- Mahoning County · 84,956 people
- City population
- 28,503
- Metro
- Youngstown-Warren-Boardman, OH-PA
- Population (ZIP)
- 9,594
- Household income
- $31,170
- Rent vs Own
- Severe rent burden
- 566.0
Population outlook (Mahoning County) Hauer SSP2
- Today (2025)
- 223,932 people
- By 2030
- 218,387 · -2.5%
- By 2040
- 205,367 · -8.3%
- By 2050
- 193,606 · -13.5%
- By 2075
- 173,694 · -22.4%
- By 2100
- 151,147 · -32.5%
Race, ethnicity, and origin ACS 2023
- Neighborhood character
- Diverse neighborhood (Simpson 0.67)
- Race & ethnicity
- White 44% Black 35% Two or more races 12% Hispanic / Latino 11%
- Hispanic origin (detail)
- Mexican 1% Puerto Rican 9%
- Common ancestry
- Romanian 2% Serbian 1% Iranian 1%
- Foreign-born
- 4% · Canada
- Languages at home
- 91% English-only · Spanish 6% Other Indo-European 1% Arabic 1%
Political lean MEDSL · Mahoning
- 2024 margin
- Lean R (+9.4) · D 44.9% · R 54.4%
- 2008→2024 swing
- -36.1pp toward R · 2008: 26.6pp · 2024: -9.4pp
- All cycles
- 2024: R+9.4 2020: R+1.9 2016: D+3.0 2012: D+27.7 2008: D+26.6
Not yet ingested
- Civics
- —
Market trends
- HPI YoY
- ▲ 1.78%
- Current HPI
- 246.2163
- Rent YoY
- —
- Metro
- Youngstown-Warren-Boardman, OH-PA
- State GDP YoY
- ▲ 1.98%
- F500 in state
- 48
Industry mix (Fortune 500 HQ in OH)
| Industry | F500 HQs | Revenue |
|---|---|---|
| Insurance | 3 | $145B |
|
||
| Industrial Machinery | 3 | $49B |
|
||
| Financial Services | 3 | $24B |
|
||
| Consumer Goods | 2 | $93B |
|
||
| Aerospace / Defense | 2 | $47B |
|
||
| Utilities | 2 | $33B |
|
||
Price history
+139.4% since first listed4 events — show timeline
- 2026-05-29 Listed $85,000 MLSNOW
- 2025-06-27 Sold (Public Records) $35,000 Public Records
- 1992-07-24 Listing Removed — MLSNOW
- 1992-04-24 Listed $35,500 MLSNOW
Property tax history
+3.6%/yrLatest (2025): $3 · +0.0% YoY. Source: county tax records.
Cash-flow waterfall
monthlySold comps — $/sqft
last 12 mo · ≤1 miLoading sold comps…