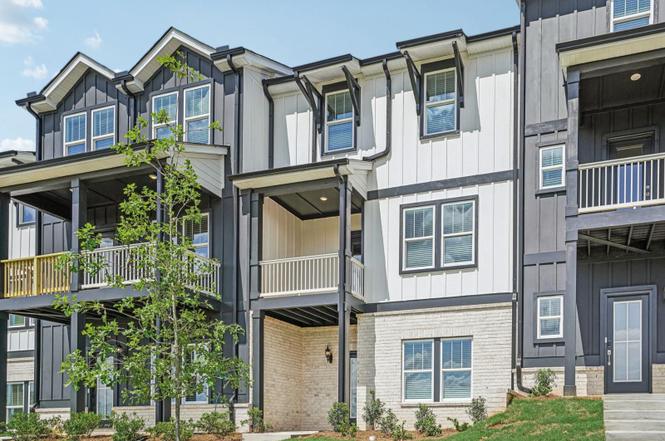
6325 Ole Anderson Way · Cumming, GA
Flood risk No data
- FEMA flood zone
- —
- Chance of flooding over 30 yrs
- —
- Est. flood insurance / yr
- —
Fire risk No data
- Est. fire insurance / yr
- —
Heat risk No data
- Hot days now (above threshold)
- —
- Hot days in 30 yrs
- —
Wind risk No data
- Chance of severe wind over 30 yrs
- —
Air-quality risk No data
- Unhealthy air days now
- —
- Unhealthy air days in 30 yrs
- —
Risk factors via First Street. Map © Google.
Why this score? — see what drove the D- grade
The composite is a weighted blend of 9 inputs, each scored 0–100. Each bar is that input's sub-score; the figure is the points it added to the 100-point composite (weight × sub-score).
- ARV discount +13.7/15.0
- Cash flow +7.5/30.0
- Schools +5.7/10.0
- Livability +3.8/5.0
- Rent growth +2.8/5.0
- Condition / age +2.5/5.0
- DSCR +1.6/10.0
- 1% rule +0.9/10.0
- Appreciation +0.0/10.0
$424,990
🖨 Deal sheet 📄 Offer letter ✓ Due diligence
Listing remarks
Sip your morning coffee from the second-story balcony. Inside, the kitchen boasts ample counter space and a large island. Useful flex space makes a great office or extra bedroom. In the owner's suite, dual sinks and a large closet add convenience.
Key facts
- Dual sinks
- Ample counter space
- Second-story balcony
Tags
Neighborhood map
What this means for you Summary
Snapshot
- This is a 4-bed/3.5-bath other listed at $425k.
Deal economics
- At list price, monthly cash flow is $-528 ($-6k/yr) — negative.
- To cash-flow at today's rent, offer at most $332k (21.9% below list).
- To meet the 1% rule (rent ≥ 1% of price), the offer needs to be $252k (40.8% below list).
- Recommended offer: $252k (40.8% below list) — sets the bar for 1% rule.
- Cap rate 4.8% vs local median 2.8% in Cumming — top-decile yield for the area; either an underpriced asset or a hidden risk that comps aren't pricing in. Stress-test before assuming the spread holds.
Location & tenants
- Location reads 76/100 on livability (#29 in GA, #3,797 nationally) — a middle-class / working-renter tenant base. Strengths: health & safety A+, crime A, housing A; Watch: employment C-, amenities D-, commute F.
- Forsyth County (suburban): math 62% / reading 62% proficiency, ranked #5 of 174 in GA (top 3%) — acceptable for families but not a draw, mixed tenant base, ~2y average lease; only 15% free/reduced lunch — higher-income household profile.
- Market conditions: Rents rising (+1.3%/yr); 809 active listings in the ZIP; high-income renter base; 2,525 units permitted in Forsyth County in 2024 (810 in 5+ unit buildings).
Forward outlook
- Local home prices are declining (-3.0%/yr); year-one equity from $3k of loan paydown is wiped out by about $13k of value loss. Plan a longer hold.
- Forsyth County population projected at +71% by 2050 — long-run rental-demand tailwind backs the buy-and-hold thesis.
Negotiation context
- It's been on market 20 days — a 2% lower offer ($419k) is reasonable based on typical stale-listing flexibility.
Questions for the listing agent
- What do current leases actually rent for vs. the listed asking? Can we see a recent rent roll and the last 12 months of T-12 income?
- Is there a deadline driving the sale (1031 exchange, divorce, estate, relocation)? That informs how much negotiation room exists.
- Schools are B-rated — typically a magnet for longer-tenancy family renters. What's the average tenant stay here, and is there a school-zone premium baked into asking?
- The area grade is low — what's the realistic commute time and amenity access for the typical tenant pool here? Any planned neighborhood developments (good or bad) we should know about?
- What's the average days-on-market for RENTAL listings here right now (not sales)? A rising rental-DOM trend means longer vacancies and softer asking-rent achievability than the comps imply.
- What's the recent tenant-quality profile in this submarket — average credit score on applications, eviction rate, late-payment / NSF rate, and stable-employment percentage? A property-management company in the area should have these aggregated.
- How much new for-sale + rental construction is in the pipeline within 1–3 miles? Heavy new supply typically softens prices + rents 12–24 months out; constrained supply supports both.
Investment metrics
- 1% rule
- 0.59% ✗
- Cap rate
- 4.80%
- Cash-on-cash
- -5.32%
- DSCR
- 0.76
- GRM
- 14.1
CMA / ARV
- ARV (median comp)
- $492,749
- List price
- $424,990
- Delta
- -13.75%
- Verdict
- UNDERPRICED
- Comps
- 20 within 1.0 mi
Projected returns pro-forma
-3.0% appreciation · 1.33% rent growth · sell at horizon
- IRR
- -27.0%
- Equity multiple
- 0.10×
- Total profit
- $-106,864
- Equity at exit
- $63,367
- IRR
- -30.6%
- Equity multiple
- -0.29×
- Total profit
- $-153,745
- Equity at exit
- $36,745
Cash invested: $118,997 (down + closing). Projections, not guarantees.
Landlord ↔ Tenant lean methodology
- Overall (STATE)
- 90 Strongly Landlord-Friendly
- State Georgia
- 90 Strongly Landlord-Friendly · R+3
- County
- — inherits STATE
- City
- — inherits STATE
ZIP-level market 30041
- Home prices YoY
- -22.5%
- Rents YoY
- 1.3%
- Active inventory
- 809
- Price-to-rent
- 14.1×
Monthly cashflow live
- Estimated rent
- $2,517 medium interval (Pro) →
- Mortgage (P&I)
- −$2,229
- Tax from tax record
- −$110 /mo · $1,324/yr
- Insurance
- −$177
- HOA
- −$0
- Vacancy / Maint / Mgmt
- −$529
- Net cashflow
- $-528
Break-even live
UW: 25.0% down · 7.5% · 30yr · 1.5% tax · 5.0% vac · 8.0% maint · 8.0% mgmt
Financing live
Cash to close
- Down payment
- $106,248
- Closing costs
- $12,750
- Reserves months
- —
- Total cash needed
- —
Loan-product check · same deal, 3 products live
Conventional
25% down · 7.5% · 30yr
- Down + closing
- —
- Monthly P&I
- —
- Monthly cashflow
- —
- DSCR
- —
- Eligible?
- —
Personal DTI + credit; lowest rate.
DSCR
20% down · 8.5% · 30yr
- Down + closing
- —
- Monthly P&I
- —
- Monthly cashflow
- —
- DSCR
- —
- Eligible?
- —
No personal income docs; deal must DSCR.
Hard money
10% down · 12.0% · 12mo
- Down + closing
- —
- Monthly P&I
- —
- Monthly cashflow
- —
- DSCR
- —
- Eligible?
- —
Short-term bridge; refi at stabilization.
Listing history 13 events
-
2026-06-18pricedays on market $424,990 Active 20 DOM
-
2026-06-17days on market $419,990 Active 19 DOM
-
2026-06-16days on market $419,990 Active 18 DOM
-
2026-06-15days on market $419,990 Active 17 DOM
-
2026-06-13days on market $419,990 Active 15 DOM
-
2026-06-13days on market $419,990 Active 14 DOM
-
2026-06-09days on market $419,990 Active 11 DOM
-
2026-06-08days on market $419,990 Active 10 DOM
-
2026-06-07pricedays on market $419,990 Active 9 DOM
-
2026-06-04pricedays on market $424,990 Active 6 DOM
-
2026-06-03days on market $472,980 Active 5 DOM
-
2026-06-02remarks 247-char remark
-
2026-06-02statusdays on market $472,980 Active 4 DOM
ⓘ Source: listings_history table (triggers on properties + properties_extension) + one-shot
backfill from property_details.listing_events for pre-trigger history.
Tax reassessment forecast GA · Resets to sale price
- Current annual tax
- $1,324 · $110/mo
- Projected year-2 tax
- $3,910 · $326/mo
- Expected delta
- +$2,586/yr (+$215/mo · 195.3%)
ⓘ Screening estimate from a state-policy table — verify with the county assessor before closing.
Nearby sold comps map
Loading sold comps map…
Walkable amenities ~0.75 mi
Loading nearby amenities…
Taxation est. · year 1
- Rental income
- $30,202
- − Mortgage interest
- −$23,806
- − Property taxes
- −$1,324
- − Insurance
- −$2,125
- − Repairs & maintenance
- −$2,416
- − Management
- −$2,416
- − Depreciation
- −$12,363
- Taxable loss
- −$14,249
- Est. tax savings @ 24.0%
- +$3,420
- After-tax cash flow
- $-2,914/yr
For passive investors: Depreciation is non-cash, so a rental often shows a tax loss while cash-flowing — sheltering income. Rental losses are passive: they offset passive income freely, and up to $25,000/yr can offset ordinary (W-2) income if you actively participate and your MAGI is under $100k (phasing out to $0 by $150k); unused losses carry forward. On sale, claimed depreciation is recaptured at up to 25%, and gains may owe capital-gains tax (a 1031 exchange can defer both). Figures are a year-1 estimate at your 24.0% rate — not tax advice; consult a CPA.
Schools (NCES district)
- District
- Forsyth County
- NCES district ID
- 1302220
- Math proficiency
- 62% ▼ -13.00%
- Reading proficiency
- 62% ▼ -11.00%
- Median HH income
- $89,763
- Composite
- 56.54/100
- National rank
- #1151
- State rank
- #5 of 174 in GA
Livability — Cumming
- Score
- 76/100
- State rank
- #29
- US rank
- #3797
Category grades
Schools grade is shown separately in the Schools card above.
Census & demographics
- County
- Forsyth County · 198,629 people
- City population
- 198,629
- Metro
- Atlanta-Sandy Springs-Alpharetta, GA
- Population (ZIP)
- 77,664
- Household income
- $152,564
- Rent vs Own
- Severe rent burden
- 796.0
Population outlook (Forsyth County) Hauer SSP2
- Today (2025)
- 294,519 people
- By 2030
- 336,546 · +14.3%
- By 2040
- 421,220 · +43.0%
- By 2050
- 502,754 · +70.7%
- By 2075
- 683,179 · +132.0%
- By 2100
- 792,174 · +169.0%
Race, ethnicity, and origin ACS 2023
- Neighborhood character
- Majority White (63%)
- Race & ethnicity
- White 63% Asian 23% Hispanic / Latino 8% Two or more races 6% Black 3%
- Hispanic origin (detail)
- Mexican 4%
- Common ancestry
- Slovak 3% Romanian 2% Italian 2%
- Foreign-born
- 23% · Canada, China, South Korea
- Languages at home
- 72% English-only · Other Asian/Pacific 9% Other Indo-European 7% Spanish 6%
Political lean MEDSL · Forsyth
- 2024 margin
- Solid R (+33.1) · D 32.9% · R 66.0% · Other 1.1%
- 2008→2024 swing
- +24.9pp toward D · 2008: -58.0pp · 2024: -33.1pp
- All cycles
- 2024: R+33.1 2020: R+33.2 2016: R+47.7 2012: R+62.9 2008: R+58.0
Not yet ingested
- Civics
- —
Market trends
- HPI YoY
- ▼ -79.19%
- Current HPI
- 272.1758
- Rent YoY
- ▲ 1.33%
- Metro
- Atlanta-Sandy Springs-Alpharetta, GA
- State GDP YoY
- ▲ 2.66%
- F500 in state
- 28
Industry mix (Fortune 500 HQ in GA)
| Industry | F500 HQs | Revenue |
|---|---|---|
| Paper / Packaging | 2 | $29B |
|
||
| Retail | 1 | $160B |
|
||
| Transportation / Logistics | 1 | $91B |
|
||
| Airlines | 1 | $62B |
|
||
| Consumer Goods | 1 | $47B |
|
||
| Utilities | 1 | $25B |
|
||
Cash-flow waterfall
monthlySold comps — $/sqft
last 12 mo · ≤1 miLoading sold comps…