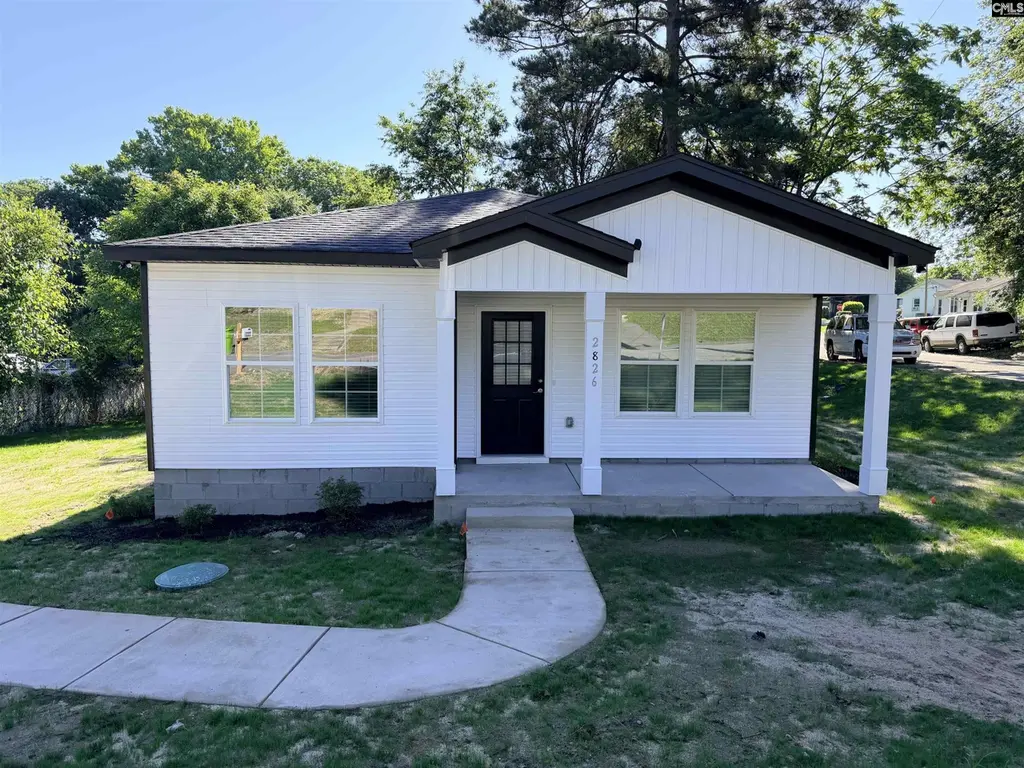
2826 Truman St · Columbia, SC
Flood risk 1/10 · Minimal
- FEMA flood zone
- —
- Chance of flooding over 30 yrs
- 0.0%
- Est. flood insurance / yr
- $435 – $905
Fire risk 2/10 · Minimal
- Est. fire insurance / yr
- $783 – $1,453
Heat risk 6/10 · Moderate
- Hot days now (above threshold)
- 7 days/yr
- Hot days in 30 yrs
- 16 days/yr
Wind risk No data
- Chance of severe wind over 30 yrs
- —
Air-quality risk No data
- Unhealthy air days now
- —
- Unhealthy air days in 30 yrs
- —
Risk factors via First Street. Map © Google.
Why this score? — see what drove the D- grade
The composite is a weighted blend of 9 inputs, each scored 0–100. Each bar is that input's sub-score; the figure is the points it added to the 100-point composite (weight × sub-score).
- Cash flow +12.3/30.0
- ARV discount +7.5/15.0
- Livability +3.9/5.0
- DSCR +3.7/10.0
- Rent growth +3.7/5.0
- Schools +2.6/10.0
- Condition / age +2.5/5.0
- 1% rule +2.3/10.0
- Appreciation +0.0/10.0
$195,000
🖨 Deal sheet 📄 Offer letter ✓ Due diligence
Listing remarks
Disclaimer: CMLS has not reviewed and, therefore, does not endorse vendors who may appear in listings.
Key facts
- 6,534 sq ft lot
- Built 2026
- Listed 87 days
Property features AI
Exterior
- Utilities: Public water; Septic sewer
- Home design: Single-story home
- Construction: Slab foundation
- Exterior features: Vinyl exterior; Paved road access; 0.15-acre lot
Interior
- Bedrooms: Master bedroom on the main level; Bedroom 2 on the main level; Bedroom 3 on the main level
- Bathrooms: 2 full bathrooms
- Interior features: Central heating and central cooling
Neighborhood map
What this means for you Summary
Snapshot
- This is a 3-bed/2.0-bath single-family listed at $195k.
Deal economics
- At list price, monthly cash flow is $-35 ($-418/yr) — negative.
- To cash-flow at today's rent, offer at most $189k (3.2% below list).
- To meet the 1% rule (rent ≥ 1% of price), the offer needs to be $142k (27.2% below list).
- Recommended offer: $142k (27.2% below list) — sets the bar for 1% rule.
- Cap rate 6.1% vs local median 5.0% in Columbia — meaningfully above typical; check what's discounted (condition, days-on-market, listing class) to confirm the premium yield is real.
Location & tenants
- Location reads 78/100 on livability (#18 in SC, #2,436 nationally) — a middle-class / working-renter tenant base. Strengths: amenities A+, commute A+, cost of living A+; Watch: employment D, crime F.
- Richland 01 (urban): math 26% / reading 36% proficiency, ranked #54 of 80 in SC (top 68%) — families likely to look elsewhere, expect single-tenant / working-renter base with shorter leases; 64% free/reduced lunch — lower-income household profile, screen leases tightly.
- Zoned schools: Bradley Elementary (math 22% / reading 32%, grade F, #421 of 597 statewide, top 73%, 437 students, 100% FRL); C. A. Johnson High (math 34% / reading 84%, grade C+, #110 of 196 statewide, top 58%, 364 students, 100% FRL) — zoned schools average 100% FRL vs 64% district-wide (36 pts higher); higher-poverty schools than district average — tighter screening recommended.
- Zoned-school proficiency averages 43% at this address vs 31% district-wide (+12 pts) — the actual schools serving this property are materially stronger than the Richland 01 average implies; a family-tenant draw the district grade alone would hide.
- Market conditions: Rents rising fast (+4.7%/yr); 116 active listings in the ZIP; 23 comparable units currently listed for rent nearby; rentals at typical pace (median 24d on market — plan ~3-4 weeks tenant-placement turnaround); 3,472 units permitted in Richland County in 2024 (1,096 in 5+ unit buildings).
- This rent runs 34% of the median local income ($50k/yr) — at the standard rent-burdened threshold; future hikes will face affordability resistance.
Forward outlook
- Local home prices are declining (-3.0%/yr); year-one equity from $1k of loan paydown is wiped out by about $6k of value loss. Plan a longer hold.
- Richland County population projected at +30% by 2050 — long-run rental-demand tailwind backs the buy-and-hold thesis.
Negotiation context
- It's been on market 87 days — a 6% lower offer ($183k) is reasonable based on typical stale-listing flexibility.
- 4 sale attempts since 6y ago with the ask held roughly flat each time — persistent listings suggest the price (not the market) is what's stuck; bring a comps-based counter.
- Current owner paid $55k; list at $195k implies a 255% gain — meaningful room to come down on a strong offer.
Risks & watch-outs
- Climate carrying-cost: extreme-heat days projected 7→16/yr by 2055 (HVAC capex compounding) — expect insurance premiums to compound above CPI over the hold.
Questions for the listing agent
- What do current leases actually rent for vs. the listed asking? Can we see a recent rent roll and the last 12 months of T-12 income?
- It's been on market 87 days. Have you received any prior offers? Is the seller open to a 27% concession, seller financing, or rate buy-down credit?
- Why hasn't it sold? Are there any deal-killer items the seller is aware of (foundation, flood, title, zoning, code violations)?
- Is there a deadline driving the sale (1031 exchange, divorce, estate, relocation)? That informs how much negotiation room exists.
- Schools are D-rated, which usually means shorter tenancies and higher turnover. Who's the typical renter profile here, and what's been the actual vacancy rate?
- Crime grade is F in this area — have there been break-ins, vandalism, or insurance claims at this property in the last 3 years? What carrier currently insures it and at what premium?
- The area grade is low — what's the realistic commute time and amenity access for the typical tenant pool here? Any planned neighborhood developments (good or bad) we should know about?
- What's the average days-on-market for RENTAL listings here right now (not sales)? A rising rental-DOM trend means longer vacancies and softer asking-rent achievability than the comps imply.
- What's the recent tenant-quality profile in this submarket — average credit score on applications, eviction rate, late-payment / NSF rate, and stable-employment percentage? A property-management company in the area should have these aggregated.
- How much new for-sale + rental construction is in the pipeline within 1–3 miles? Heavy new supply typically softens prices + rents 12–24 months out; constrained supply supports both.
Investment metrics
- 1% rule
- 0.73% ✗
- Cap rate
- 6.08%
- Cash-on-cash
- -0.77%
- DSCR
- 0.97
- GRM
- 11.4
CMA / ARV
- ARV (on-the-fly)
- $122,400
- Comps found
- 1
Show comp detail 1 sale within ~0.75 mi
| Address | Dist | Beds/Ba | Sqft | Sold | Price | $/sf | Match |
|---|---|---|---|---|---|---|---|
| 3057 Truman St | 0.40mi | 3/1.0 | 1,132 (-6%) | 3mo | $115,000 | $102 | 66 |
Match score weights: distance 35% · size 25% · config 20% · recency 20%. Top-matched comps best support the ARV.
Projected returns pro-forma
-3.0% appreciation · 4.73% rent growth · sell at horizon
- IRR
- -16.0%
- Equity multiple
- 0.42×
- Total profit
- $-31,398
- Equity at exit
- $29,075
- IRR
- -5.3%
- Equity multiple
- 0.64×
- Total profit
- $-19,899
- Equity at exit
- $16,860
Cash invested: $54,600 (down + closing). Projections, not guarantees.
Landlord ↔ Tenant lean methodology
- Overall (STATE)
- 90 Strongly Landlord-Friendly
- State South Carolina
- 90 Strongly Landlord-Friendly · R+6
- County
- — inherits STATE
- City
- — inherits STATE
ZIP-level market 29204
- Home prices YoY
- -34.9%
- Rents YoY
- 4.7%
- Active inventory
- 116
- Price-to-rent
- 11.4×
Monthly cashflow live
- Estimated rent
- $1,420 high interval (Pro) →
- Mortgage (P&I)
- −$1,023
- Tax from tax record
- −$53 /mo · $633/yr
- Insurance
- −$81
- HOA
- −$0
- Vacancy / Maint / Mgmt
- −$298
- Net cashflow
- $-35
Break-even live
UW: 25.0% down · 7.5% · 30yr · 1.5% tax · 5.0% vac · 8.0% maint · 8.0% mgmt
Financing live
Cash to close
- Down payment
- $48,750
- Closing costs
- $5,850
- Reserves months
- —
- Total cash needed
- —
Loan-product check · same deal, 3 products live
Conventional
25% down · 7.5% · 30yr
- Down + closing
- —
- Monthly P&I
- —
- Monthly cashflow
- —
- DSCR
- —
- Eligible?
- —
Personal DTI + credit; lowest rate.
DSCR
20% down · 8.5% · 30yr
- Down + closing
- —
- Monthly P&I
- —
- Monthly cashflow
- —
- DSCR
- —
- Eligible?
- —
No personal income docs; deal must DSCR.
Hard money
10% down · 12.0% · 12mo
- Down + closing
- —
- Monthly P&I
- —
- Monthly cashflow
- —
- DSCR
- —
- Eligible?
- —
Short-term bridge; refi at stabilization.
Rent comps 23 comps
| Address | Beds | Baths | Sqft | Rent | $/sqft | DOM | Units | Dist |
|---|---|---|---|---|---|---|---|---|
| 2928 English Ave Unit NA Columbia, SC | 3.0 | 1.0 | 1320 | $1,590 | $1.20 | 11d | 1 | 0.19mi |
| 3015 English Ave Columbia, SC | 2.0 | 1.0 | 981 | $1,250 | $1.27 | 11d | 1 | 0.32mi |
| 3145 Bronx Rd Columbia, SC | 3.0 | 1.5 | 1207 | $1,511 | $1.25 | 23d | 1 | 0.52mi |
| 3540 White St Columbia, SC | 2.0 | 1.0 | 725 | $1,300 | $1.79 | 23d | 1 | 0.59mi |
| 3419 Piedmont Ave Columbia, SC | 3.0 | 1.0 | 1100 | $1,195 | $1.09 | 23d | 1 | 0.60mi |
| 2225 Waites Rd Unit 2225A Columbia, SC | 2.0 | 1.0 | 714 | $1,100 | $1.54 | 23d | 1 | 0.79mi |
| 1115 Carter St Columbia, SC | 1.0–2.0 | 1.0 | 854 | $1,405 | $1.65 | 23d | 1 | 0.80mi |
| 2710 Howell Ct Columbia, SC | 2.0 | 1.0 | 700 | $825 | $1.18 | 14d | 1 | 0.83mi |
| 2308 Manse St Columbia, SC | 3.0 | 1.0 | 999 | $1,300 | $1.30 | 14d | 1 | 0.84mi |
| 2105 Grove St Columbia, SC | 2.0 | 1.0 | 800 | $850 | $1.06 | 23d | 1 | 0.94mi |
| 2511 Chestnut St Columbia, SC | 2.0 | 1.0 | 928 | $1,300 | $1.40 | 14d | 1 | 0.95mi |
| 3500 Grand St Columbia, SC | 3.0 | 2.0 | 1300 | $2,000 | $1.54 | 14d | 1 | 1.01mi |
| 2834 Keats St Columbia, SC | 3.0 | 2.0 | 921 | $2,250 | $2.44 | 14d | 1 | 1.11mi |
| 1506 Charlton St Columbia, SC | 3.0 | 2.0 | 1491 | $1,500 | $1.01 | 23d | 1 | 1.13mi |
| 3700 West Ave Columbia, SC | 1.0–2.0 | 1.0 | 750 | $850 | $1.13 | 14d | 1 | 1.16mi |
| 3117 Quitman St Columbia, SC | 3.0 | 2.0 | 1500 | $1,750 | $1.17 | 23d | 1 | 1.23mi |
| 1931 Chaney St Columbia, SC | 2.0 | 1.0 | 1034 | $1,600 | $1.55 | 23d | 1 | 1.27mi |
| 5779 Ames Rd Unit 13B Columbia, SC | 2.0 | 1.0 | 895 | $1,000 | $1.12 | 11d | 1 | 1.31mi |
| 5779 Ames Rd Columbia, SC | 2.0 | 1.0 | 895 | $1,000 | $1.12 | 14d | 1 | 1.31mi |
| 2508 Laurel St Unit B Columbia, SC | 2.0 | 1.0 | 750 | $950 | $1.27 | 23d | 1 | 1.36mi |
| 2413 Laurel St Unit C Columbia, SC | 2.0 | 1.0 | 800 | $900 | $1.12 | 23d | 1 | 1.37mi |
| 3606 Medical Dr Unit B Columbia, SC | 2.0 | 1.5 | 864 | $1,100 | $1.27 | 23d | 1 | 1.37mi |
| 1319 Hendrix St Columbia, SC | 2.0 | 1.0 | 900 | $1,050 | $1.17 | 23d | 1 | 1.47mi |
Listing history 24 events
-
2026-06-18days on market $195,000 Active 87 DOM
-
2026-06-17days on market $195,000 Active 86 DOM
-
2026-06-16days on market $195,000 Active 85 DOM
-
2026-06-15days on market $195,000 Active 84 DOM
-
2026-06-14pricedays on market $195,000 Active 82 DOM
-
2026-06-10days on market $200,000 Active 79 DOM
-
2026-06-09days on market $200,000 Active 78 DOM
-
2026-06-08days on market $200,000 Active 77 DOM
-
2026-06-07days on market $200,000 Active 76 DOM
-
2026-06-03days on market $200,000 Active 72 DOM
-
2026-06-03days on market $200,000 Active 71 DOM
-
2026-06-01days on market $200,000 Active 70 DOM
-
2026-05-31days on market $200,000 Active 69 DOM
-
2026-03-23$200,000 Active
-
2024-04-21historical
-
2023-10-20$17,000 Active
-
2023-07-19status Pending
-
2023-07-04historical Active - Contingent
-
2023-06-19$9,999 Active
-
2022-05-20price $875
-
2020-03-14historical
-
2020-03-10$40,000 Active
-
2006-03-06soldstatus $55,000
-
1998-12-11soldstatus $42,500
ⓘ Source: listings_history table (triggers on properties + properties_extension) + one-shot
backfill from property_details.listing_events for pre-trigger history.
Tax reassessment forecast SC · Resets to sale price
- Current annual tax
- $633 · $53/mo
- Projected year-2 tax
- $1,112 · $93/mo
- Expected delta
- +$478/yr (+$40/mo · 75.6%)
ⓘ Screening estimate from a state-policy table — verify with the county assessor before closing.
Climate risk First Street
- Flood 1/10 Low 0% chance over 30 yrs
- Wildfire 2/10 Low
- Heat 6/10 Major
Nearby sold comps map
Loading sold comps map…
Walkable amenities ~0.75 mi
Loading nearby amenities…
Taxation est. · year 1
- Rental income
- $17,040
- − Mortgage interest
- −$10,923
- − Property taxes
- −$633
- − Insurance
- −$975
- − Repairs & maintenance
- −$1,363
- − Management
- −$1,363
- − Depreciation
- −$5,673
- Taxable loss
- −$3,890
- Est. tax savings @ 24.0%
- +$934
- After-tax cash flow
- $516/yr
For passive investors: Depreciation is non-cash, so a rental often shows a tax loss while cash-flowing — sheltering income. Rental losses are passive: they offset passive income freely, and up to $25,000/yr can offset ordinary (W-2) income if you actively participate and your MAGI is under $100k (phasing out to $0 by $150k); unused losses carry forward. On sale, claimed depreciation is recaptured at up to 25%, and gains may owe capital-gains tax (a 1031 exchange can defer both). Figures are a year-1 estimate at your 24.0% rate — not tax advice; consult a CPA.
Schools (NCES district)
- District
- Richland 01
- NCES district ID
- 4503360
- Math proficiency
- 26% ▼ -7.00%
- Reading proficiency
- 36% ▼ -5.00%
- Median HH income
- $38,931
- Composite
- 25.94/100
- National rank
- #7335
- State rank
- #54 of 80 in SC
Livability — Columbia
- Score
- 78/100
- State rank
- #18
- US rank
- #2436
Category grades
Schools grade is shown separately in the Schools card above.
Census & demographics
- County
- Richland County · 389,530 people
- City population
- 335,994
- Metro
- Columbia, SC
- Population (ZIP)
- 18,159
- Household income
- $50,189
- Rent vs Own
- Severe rent burden
- 1045.0
Population outlook (Richland County) Hauer SSP2
- Today (2025)
- 459,667 people
- By 2030
- 487,524 · +6.1%
- By 2040
- 542,035 · +17.9%
- By 2050
- 595,371 · +29.5%
- By 2075
- 732,998 · +59.5%
- By 2100
- 820,415 · +78.5%
Race, ethnicity, and origin ACS 2023
- Neighborhood character
- Diverse neighborhood (Simpson 0.57)
- Race & ethnicity
- Black 48% White 44% Two or more races 3% Asian 3% Hispanic / Latino 2%
- Common ancestry
- Serbian 2% Slovak 2% Italian 1%
- Foreign-born
- 3% · Canada
- Languages at home
- 93% English-only · Spanish 2% Tagalog/Filipino 1% Arabic 1%
Political lean MEDSL · Richland
- 2024 margin
- Solid D (+34.6) · D 66.4% · R 31.8% · Other 1.8%
- 2008→2024 swing
- +5.7pp toward D · 2008: 28.9pp · 2024: 34.6pp
- All cycles
- 2024: D+34.6 2020: D+38.3 2016: D+32.9 2012: D+33.3 2008: D+28.9
Not yet ingested
- Civics
- —
Market trends
- HPI YoY
- ▼ -104.76%
- Current HPI
- 195.2246
- Rent YoY
- ▲ 4.73%
- Metro
- Columbia, SC
- State GDP YoY
- ▲ 4.51%
- F500 in state
- 2
Industry mix (Fortune 500 HQ in SC)
| Industry | F500 HQs | Revenue |
|---|---|---|
| Packaging | 1 | $7B |
|
||
Price history
+370.6% since first listed11 events — show timeline
- 2026-03-23 Listed $200,000 Consolidated MLS
- 2024-04-21 Delisted — Consolidated MLS
- 2023-10-20 Listed $17,000 Consolidated MLS
- 2023-07-19 Pending — Consolidated MLS
- 2023-07-04 Contingent — Consolidated MLS
- 2023-06-19 Listed $9,999 Consolidated MLS
- 2022-05-20 Price Changed $875 RENT.
- 2020-03-14 Delisted — Consolidated MLS
- 2020-03-10 Listed $40,000 Consolidated MLS
- 2006-03-06 Sold (Public Records) $55,000 Public Records
- 1998-12-11 Sold (Public Records) $42,500 Public Records
Property tax history
+0.4%/yrLatest (2025): $633 · +3.1% YoY. Source: county tax records.
Cash-flow waterfall
monthlySold comps — $/sqft
last 12 mo · ≤1 miLoading sold comps…