15388 Pavo Real Ln · La Blanca, TX
Flood risk 1/10 · Minimal
- FEMA flood zone
- X
- Chance of flooding over 30 yrs
- 0.0%
- Est. flood insurance / yr
- $507 – $1,088
Fire risk 8/10 · Major
- Est. fire insurance / yr
- $1,222 – $2,270
Heat risk 9/10 · Severe
- Hot days now (above 111°F)
- 7 days/yr
- Hot days in 30 yrs
- 23 days/yr
Wind risk 9/10 · Severe
- Chance of severe wind over 30 yrs
- 99.0%
Air-quality risk 1/10 · Minimal
- Unhealthy air days now
- 0 days/yr
- Unhealthy air days in 30 yrs
- 0 days/yr
Risk factors via First Street. Map © Google.
Why this score? — see what drove the B- grade
The composite is a weighted blend of 9 inputs, each scored 0–100. Each bar is that input's sub-score; the figure is the points it added to the 100-point composite (weight × sub-score).
- Cash flow +30.0/30.0
- 1% rule +10.0/10.0
- DSCR +10.0/10.0
- ARV discount +7.5/15.0
- Livability +3.0/5.0
- Condition / age +2.5/5.0
- Rent growth +2.2/5.0
- Schools +2.2/10.0
- Appreciation +0.0/10.0
$69,000
🖨 Deal sheet 📄 Offer letter ✓ Due diligence
Listing remarks
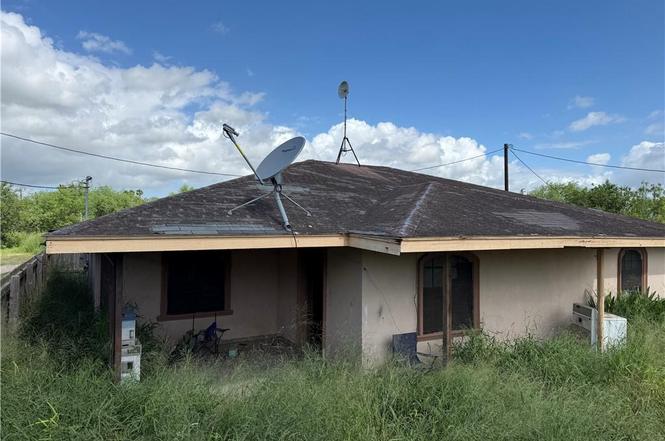
This 3 bedroom, 1 bath home in Edinburg, TX offers 1,209 square feet of living space and sits on a generous 0.46 acre lot. Listed at $69,000, this property is a great opportunity for investors or buyers looking to add their personal touch. With plenty of space both inside and out, the possibilities are endless. Whether you're looking for your next investment property or a project with potential, this one is worth a look.
Key facts
- 0.46 acre lot
- Parking
- Built 1970
Property features AI
Finance
- Other: Lot size approximately 0.46 acres (about 20,038 sq ft); Listing broker: Fox Real Estate Pros
- HOA & community: No HOA
Exterior
- Parking: 1 covered parking space; 1-car carport; Attached parking
- Utilities: Sewer: Other; Road surface: Dirt
- Home design: Single-story (1 living area shown); Entry from Pavo Real Ln
- Construction: Stucco construction; Shingle roof; Slab foundation; Built area about 1,209 square feet
- Exterior features: Mature trees; Patio; Wood fencing
Interior
- Kitchen: No conveying appliances; No water heater included
- Flooring: Tile
- Bathrooms: 1 full bathroom
- Interior features: Tile flooring; Tile countertops; No window coverings; Living area: 1
- Laundry & utility: Dedicated laundry room
Neighborhood map
What this means for you Summary
Snapshot
- This is a 3-bed/1.0-bath single-family listed at $69k.
Deal economics
- At list price, monthly cash flow is $513 ($6k/yr) — positive.
- The deal already cash-flows at list — no discount required.
- Meets the 1% rule at list price ($1k rent vs $69k).
Location & tenants
- Location reads 60/100 on livability (#1,104 in TX) — a middle-class / working-renter tenant base. Strengths: cost of living A+, housing A+, crime B+; Watch: amenities F, commute F, health & safety F.
- Edinburg CISD (urban): math 20% / reading 34% proficiency, ranked #699 of 826 in TX (top 85%) — low school quality limits family demand, transient renter base, plan for 1-2y turnover; 62% free/reduced lunch — lower-income household profile, screen leases tightly.
- Zoned schools: Hargill El (math 17% / reading 22%, grade F, #3,583 of 4,322 statewide, top 86%, 502 students, 94% FRL); Betty Harwell Middle (math 11% / reading 26%, grade F, #1,478 of 1,662 statewide, top 90%, 1,453 students, 96% FRL); Economedes H S (math 19% / reading 24%, grade F, #1,377 of 1,632 statewide, top 85%, 2,762 students, 92% FRL) — zoned schools average 94% FRL vs 62% district-wide (33 pts higher); higher-poverty schools than district average — tighter screening recommended.
- Market conditions: Rents soft (-1.1%/yr); 1003 active listings in the ZIP; 1 comparable units currently listed for rent nearby; 7,378 units permitted in Hidalgo County in 2024 (641 in 5+ unit buildings).
Forward outlook
- Local home prices are declining (-3.0%/yr); year-one equity from $477 of loan paydown is wiped out by about $2k of value loss. Plan a longer hold.
- Hidalgo County population projected at +28% by 2050 — long-run rental-demand tailwind backs the buy-and-hold thesis.
- At projected returns (-3.0% appreciation + 0.0% rent growth), your $19k cash investment doubles in ~5 years — after that, you're playing with house money.
Negotiation context
- Only 3 days on market — expect competitive offers; lowballing is unlikely to land.
Risks & watch-outs
- Climate carrying-cost: severe wind risk, 99% chance of damaging wind over 30y; severe wildfire risk; extreme-heat days projected 7→23/yr by 2055 (HVAC capex compounding) — expect insurance premiums to compound above CPI over the hold.
Questions for the listing agent
- Built in 1970 — when were the roof, HVAC, electrical panel, plumbing, and water heater last replaced?
- Is there a deadline driving the sale (1031 exchange, divorce, estate, relocation)? That informs how much negotiation room exists.
- Schools are F-rated, which usually means shorter tenancies and higher turnover. Who's the typical renter profile here, and what's been the actual vacancy rate?
- What's the average days-on-market for RENTAL listings here right now (not sales)? A rising rental-DOM trend means longer vacancies and softer asking-rent achievability than the comps imply.
- What's the recent tenant-quality profile in this submarket — average credit score on applications, eviction rate, late-payment / NSF rate, and stable-employment percentage? A property-management company in the area should have these aggregated.
- How much new for-sale + rental construction is in the pipeline within 1–3 miles? Heavy new supply typically softens prices + rents 12–24 months out; constrained supply supports both.
Investment metrics
- 1% rule
- 1.90% ✓
- Cap rate
- 15.22%
- Cash-on-cash
- 31.88%
- DSCR
- 2.42
- GRM
- 4.4
CMA / ARV
- ARV (on-the-fly)
- $200,694
- Comps found
- 3
Show comp detail 3 sales within ~0.75 mi
| Address | Dist | Beds/Ba | Sqft | Sold | Price | $/sf | Match |
|---|---|---|---|---|---|---|---|
| 23474 N Valverde Rd N | 0.34mi | 3/2.0 | 1,386 (+15%) | 5mo | $230,000 | $166 | 51 |
| 22504 N Val Verde Rd | 0.71mi | 3/2.0 | 1,145 (-5%) | 11mo | $230,000 | $201 | 45 |
| 23856 N Val Verde Rd | 0.69mi | 3/2.0 | 1,321 (+9%) | 7mo | $215,000 | $163 | 43 |
Match score weights: distance 35% · size 25% · config 20% · recency 20%. Top-matched comps best support the ARV.
Projected returns pro-forma
-3.0% appreciation · 0.0% rent growth · sell at horizon
- IRR
- 23.3%
- Equity multiple
- 1.92×
- Total profit
- $17,717
- Equity at exit
- $10,288
- IRR
- 29.1%
- Equity multiple
- 3.22×
- Total profit
- $42,863
- Equity at exit
- $5,966
Cash invested: $19,320 (down + closing). Projections, not guarantees.
Landlord ↔ Tenant lean methodology
- Overall (STATE)
- 87 Strongly Landlord-Friendly
- State Texas
- 87 Strongly Landlord-Friendly · R+5
- County
- — inherits STATE
- City
- — inherits STATE
ZIP-level market 78542
- Home prices YoY
- -13.4%
- Rents YoY
- -1.1%
- Active inventory
- 1003
- Price-to-rent
- 4.4×
Monthly cashflow live
- Estimated rent
- $1,312 medium interval (Pro) →
- Mortgage (P&I)
- −$362
- Tax from tax record
- −$133 /mo · $1,590/yr
- Insurance
- −$29
- HOA
- −$0
- Vacancy / Maint / Mgmt
- −$276
- Net cashflow
- $513
Break-even live
UW: 25.0% down · 7.5% · 30yr · 1.5% tax · 5.0% vac · 8.0% maint · 8.0% mgmt
Financing live
Cash to close
- Down payment
- $17,250
- Closing costs
- $2,070
- Reserves months
- —
- Total cash needed
- —
Loan-product check · same deal, 3 products live
Conventional
25% down · 7.5% · 30yr
- Down + closing
- —
- Monthly P&I
- —
- Monthly cashflow
- —
- DSCR
- —
- Eligible?
- —
Personal DTI + credit; lowest rate.
DSCR
20% down · 8.5% · 30yr
- Down + closing
- —
- Monthly P&I
- —
- Monthly cashflow
- —
- DSCR
- —
- Eligible?
- —
No personal income docs; deal must DSCR.
Hard money
10% down · 12.0% · 12mo
- Down + closing
- —
- Monthly P&I
- —
- Monthly cashflow
- —
- DSCR
- —
- Eligible?
- —
Short-term bridge; refi at stabilization.
Rent comps 1 comps
| Address | Beds | Baths | Sqft | Rent | $/sqft | DOM | Units | Dist |
|---|---|---|---|---|---|---|---|---|
| 22516 N Val Verde Rd Monte Alto, TX | 3.0 | 2.0 | 1013 | $1,200 | $1.18 | 43d | 1 | 0.64mi |
Listing history 4 events
-
2026-06-18days on market $69,000 Active 3 DOM
-
2026-06-17days on market $69,000 Active 2 DOM
-
2026-06-15remarks 424-char remark
-
2026-06-15$69,000 Active 1 DOM
ⓘ Source: listings_history table (triggers on properties + properties_extension) + one-shot
backfill from property_details.listing_events for pre-trigger history.
Tax reassessment forecast TX · Resets to sale price
- Current annual tax
- $1,590 · $133/mo
- Projected year-2 tax
- $1,590 · $133/mo
- Expected delta
- $0/yr ($0/mo · 0.0%)
ⓘ Screening estimate from a state-policy table — verify with the county assessor before closing.
Climate risk First Street
- Flood 1/10 Low FEMA zone X · 0% chance over 30 yrs
- Wildfire 8/10 Severe
- Heat 9/10 Extreme 7 d/yr ≥111°F today · 23 d/yr by 30 yrs out
- Wind 9/10 Extreme 99% chance of damaging wind over 30 yrs
- Air quality 1/10 Low 0 unhealthy d/yr today · 0 by 30 yrs out
Nearby sold comps map
Loading sold comps map…
Walkable amenities ~0.75 mi
Loading nearby amenities…
Taxation est. · year 1
- Rental income
- $15,743
- − Mortgage interest
- −$3,865
- − Property taxes
- −$1,590
- − Insurance
- −$345
- − Repairs & maintenance
- −$1,259
- − Management
- −$1,259
- − Depreciation
- −$2,007
- Taxable income
- $5,417
- Est. tax owed @ 24.0%
- −$1,300
- After-tax cash flow
- $4,860/yr
For passive investors: Depreciation is non-cash, so a rental often shows a tax loss while cash-flowing — sheltering income. Rental losses are passive: they offset passive income freely, and up to $25,000/yr can offset ordinary (W-2) income if you actively participate and your MAGI is under $100k (phasing out to $0 by $150k); unused losses carry forward. On sale, claimed depreciation is recaptured at up to 25%, and gains may owe capital-gains tax (a 1031 exchange can defer both). Figures are a year-1 estimate at your 24.0% rate — not tax advice; consult a CPA.
Schools (NCES district)
- District
- Edinburg CISD
- NCES district ID
- 4818180
- Math proficiency
- 20% ▼ -34.00%
- Reading proficiency
- 34% ▼ -11.00%
- Median HH income
- $36,985
- Composite
- 22.42/100
- National rank
- #8114
- State rank
- #699 of 826 in TX
Livability — La Blanca
- Score
- 60/100
- State rank
- #1104
- US rank
- #19566
Category grades
Schools grade is shown separately in the Schools card above.
Census & demographics
- County
- Hidalgo County · 623,128 people
- City population
- 905
- Metro
- McAllen-Edinburg-Mission, TX
- Population (ZIP)
- 89,401
- Household income
- $55,243
- Rent vs Own
- Severe rent burden
- 1240.0
Population outlook (Hidalgo County) Hauer SSP2
- Today (2025)
- 955,232 people
- By 2030
- 1,009,774 · +5.7%
- By 2040
- 1,120,332 · +17.3%
- By 2050
- 1,225,036 · +28.2%
- By 2075
- 1,439,189 · +50.7%
- By 2100
- 1,533,429 · +60.5%
Race, ethnicity, and origin ACS 2023
- Neighborhood character
- Predominantly Hispanic (95%)
- Race & ethnicity
- Hispanic / Latino 95% Two or more races 59% White 4%
- Hispanic origin (detail)
- Mexican 91%
- Foreign-born
- 25% · Canada
- Languages at home
- 15% English-only · Spanish 84%
Political lean MEDSL · Hidalgo
- 2024 margin
- Toss-up / Even · D 48.1% · R 51.0%
- 2008→2024 swing
- -41.6pp toward R · 2008: 38.7pp · 2024: -2.9pp
- All cycles
- 2024: R+2.9 2020: D+17.1 2016: D+40.5 2012: D+41.8 2008: D+38.7
Not yet ingested
- Civics
- —
Market trends
- HPI YoY
- ▼ -34.17%
- Current HPI
- 220.921
- Rent YoY
- ▼ -1.07%
- Metro
- McAllen-Edinburg-Mission, TX
- State GDP YoY
- ▲ 3.95%
- F500 in state
- 110
Industry mix (Fortune 500 HQ in TX)
| Industry | F500 HQs | Revenue |
|---|---|---|
| Energy | 16 | $1,198B |
|
||
| Technology | 5 | $198B |
|
||
| Engineering / Construction | 4 | $72B |
|
||
| Energy Services | 3 | $60B |
|
||
| Utilities | 3 | $41B |
|
||
| Healthcare | 2 | $330B |
|
||
Price history
2 events — show timeline
- 2026-06-11 Listed $69,000 MCALLENMLS
- 1994-05-27 Sold (Public Records) — Public Records
Property tax history
+8.6%/yrLatest (2025): $1,590 · +3.3% YoY. Source: county tax records.
Cash-flow waterfall
monthlySold comps — $/sqft
last 12 mo · ≤1 miLoading sold comps…