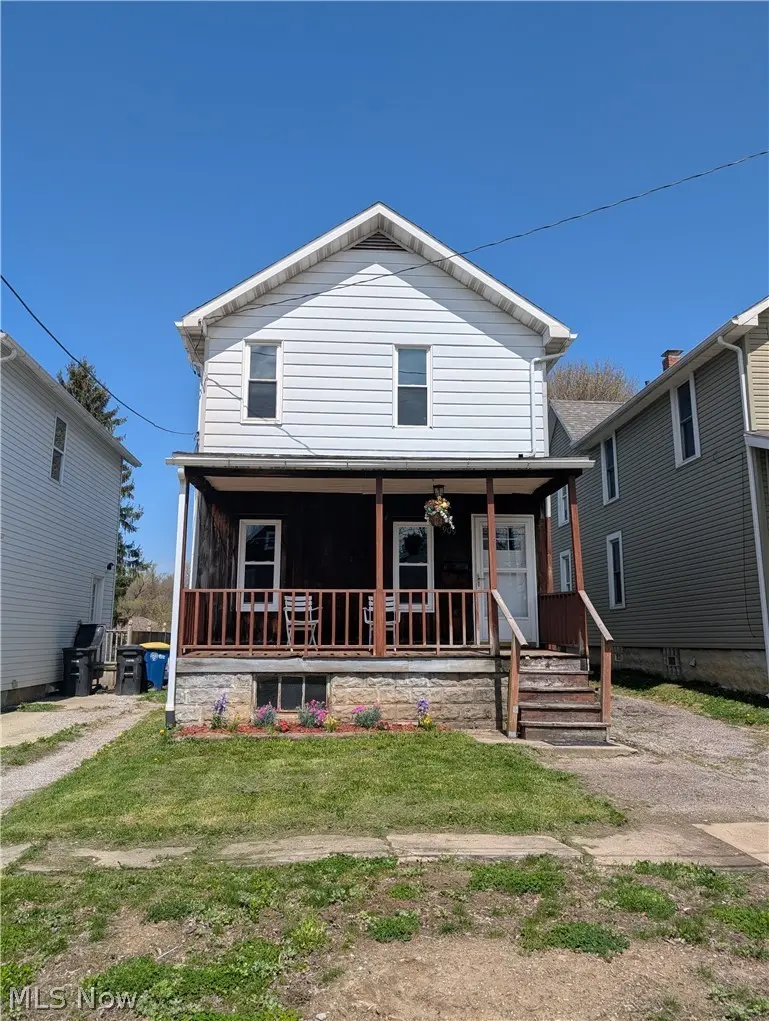
909 E 16th St · Ashtabula, OH
Flood risk 1/10 · Minimal
- FEMA flood zone
- X (unshaded)
- Chance of flooding over 30 yrs
- 0.0%
- Est. flood insurance / yr
- $473 – $860
Fire risk 1/10 · Minimal
- Est. fire insurance / yr
- $713 – $1,323
Heat risk 3/10 · Minor
- Hot days now (above 93°F)
- 7 days/yr
- Hot days in 30 yrs
- 17 days/yr
Wind risk 1/10 · Minimal
- Chance of severe wind over 30 yrs
- —
Air-quality risk 3/10 · Minor
- Unhealthy air days now
- 2 days/yr
- Unhealthy air days in 30 yrs
- 5 days/yr
Risk factors via First Street. Map © Google.
Why this score? — see what drove the B- grade
The composite is a weighted blend of 9 inputs, each scored 0–100. Each bar is that input's sub-score; the figure is the points it added to the 100-point composite (weight × sub-score).
- Cash flow +30.0/30.0
- 1% rule +10.0/10.0
- DSCR +10.0/10.0
- ARV discount +5.0/15.0
- Livability +3.6/5.0
- Rent growth +2.5/5.0
- Condition / age +2.5/5.0
- Schools +2.4/10.0
- Appreciation +0.0/10.0
$139,000
🖨 Deal sheet 📄 Offer letter ✓ Due diligence
Listing remarks
Check out this newly remodeled updated three bedroom, one bath home located close to the Ashtabula Harbor Area and Lakeshore Park. All new vinyl flooring on the main floor and carpet on the second level. Freshly painted throughout with a neutral color palette. Large kitchen with a butcher block island. Enjoy the covered front porch on those lazy summer days.
Key facts
- Covered front porch
- Remodeled
- Vinyl flooring
Tags
Property features AI
Exterior
- Parking: Driveway with gravel surface
- Utilities: Public water; Public sewer
- Home design: Two-story single-family home; Faces west
- Construction: Vinyl and wood siding; Asphalt/fiberglass roof
- Exterior features: Front porch; Patio
Interior
- Kitchen: Kitchen on the main level
- Bedrooms: Three bedrooms on the second floor (carpeted)
- Flooring: Carpet in bedrooms
- Bathrooms: One full bathroom on the main level
- Heating & cooling: Forced air heating (gas)
- Interior features: Full unfinished basement
- Laundry & utility: Laundry area in the kitchen on the main level
Neighborhood map
What this means for you Summary
Snapshot
- This is a 3-bed/1.0-bath single-family listed at $139k.
Deal economics
- At list price, monthly cash flow is $2k ($19k/yr) — positive.
- The deal already cash-flows at list — no discount required.
- Meets the 1% rule at list price ($3k rent vs $139k).
- Recommended offer: $135k (3.0% below list) — sets the bar for market timing.
- Cap rate 20.0% vs local median 8.2% in Ashtabula — top-decile yield for the area; either an underpriced asset or a hidden risk that comps aren't pricing in. Stress-test before assuming the spread holds.
Location & tenants
- Location reads 71/100 on livability (#420 in OH) — a middle-class / working-renter tenant base. Strengths: cost of living A+, health & safety A+, housing A; Watch: schools C-, amenities F, commute F.
- Ashtabula Area City (town): math 24% / reading 35% proficiency, ranked #588 of 656 in OH (top 90%) — low school quality limits family demand, transient renter base, plan for 1-2y turnover; 63% free/reduced lunch — lower-income household profile, screen leases tightly.
- Market conditions: 162 active listings in the ZIP; 2 comparable units currently listed for rent nearby; 155 units permitted in Ashtabula County in 2024 (0 in 5+ unit buildings).
- At $3,096/mo this rent would consume 75% of the median local household income ($50k/yr) — very limited rent-growth headroom before tenants either downsize or default.
Forward outlook
- Local home prices are declining (-3.0%/yr); year-one equity from $961 of loan paydown is wiped out by about $4k of value loss. Plan a longer hold.
- Ashtabula County population projected at -22% by 2050 — secular population decline; favor cash flow + early exit over multi-decade hold.
- At projected returns (-3.0% appreciation + 3.0% rent growth), your $39k cash investment doubles in ~3 years — after that, you're playing with house money.
Negotiation context
- It's been on market 44 days — a 3% lower offer ($135k) is reasonable based on typical stale-listing flexibility.
- Current owner paid $34k; list at $139k implies a 315% gain — meaningful room to come down on a strong offer.
Risks & watch-outs
- Watch-outs: built in 1907 — expect roof / HVAC / electrical / plumbing capex.
Questions for the listing agent
- It's been on market 44 days. Have you received any prior offers? Is the seller open to a 3% concession, seller financing, or rate buy-down credit?
- Built in 1907 — when were the roof, HVAC, electrical panel, plumbing, and water heater last replaced?
- Is there a deadline driving the sale (1031 exchange, divorce, estate, relocation)? That informs how much negotiation room exists.
- What's the average days-on-market for RENTAL listings here right now (not sales)? A rising rental-DOM trend means longer vacancies and softer asking-rent achievability than the comps imply.
- What's the recent tenant-quality profile in this submarket — average credit score on applications, eviction rate, late-payment / NSF rate, and stable-employment percentage? A property-management company in the area should have these aggregated.
- How much new for-sale + rental construction is in the pipeline within 1–3 miles? Heavy new supply typically softens prices + rents 12–24 months out; constrained supply supports both.
Investment metrics
- 1% rule
- 2.23% ✓
- Cap rate
- 20.05%
- Cash-on-cash
- 49.13%
- DSCR
- 3.19
- GRM
- 3.7
CMA / ARV
- ARV (median comp)
- $131,627
- List price
- $139,000
- Delta
- 5.60%
- Verdict
- FAIR
- Comps
- 20 within 1.0 mi
Show comp detail 4 sales within ~0.75 mi
| Address | Dist | Beds/Ba | Sqft | Sold | Price | $/sf | Match |
|---|---|---|---|---|---|---|---|
| 949 E 6th St | 0.51mi | 3/1.5 | 1,166 (+4%) | 5mo | $160,000 | $137 | 63 |
| 1307 W 9th St | 0.58mi | 3/1.0 | 1,170 (+5%) | 4mo | $56,999 | $49 | 62 |
| 2123 Columbus Ave | 0.43mi | 2/1.0 (-1) | 1,088 (-2%) | 23mo | $119,500 | $110 | 52 |
| 1142 W 8th St | 0.58mi | 4/2.0 (+1) | 1,158 (+4%) | 19mo | $117,015 | $101 | 42 |
Match score weights: distance 35% · size 25% · config 20% · recency 20%. Top-matched comps best support the ARV.
Projected returns pro-forma
-3.0% appreciation · 3.0% rent growth · sell at horizon
- IRR
- 46.7%
- Equity multiple
- 3.03×
- Total profit
- $78,938
- Equity at exit
- $20,725
- IRR
- 52.4%
- Equity multiple
- 6.12×
- Total profit
- $199,333
- Equity at exit
- $12,018
Cash invested: $38,920 (down + closing). Projections, not guarantees.
Landlord ↔ Tenant lean methodology
- Overall (STATE)
- 73 Landlord-Friendly
- State Ohio
- 73 Landlord-Friendly · R+6
- County
- — inherits STATE
- City
- — inherits STATE
ZIP-level market 44004
- Home prices YoY
- -30.5%
- Active inventory
- 162
- Price-to-rent
- 3.7×
Monthly cashflow live
- Estimated rent
- $3,096 medium interval (Pro) →
- Mortgage (P&I)
- −$729
- Tax from tax record
- −$66 /mo · $792/yr
- Insurance
- −$58
- HOA
- −$0
- Vacancy / Maint / Mgmt
- −$650
- Net cashflow
- $1,593
Break-even live
UW: 25.0% down · 7.5% · 30yr · 1.5% tax · 5.0% vac · 8.0% maint · 8.0% mgmt
Financing live
Cash to close
- Down payment
- $34,750
- Closing costs
- $4,170
- Reserves months
- —
- Total cash needed
- —
Loan-product check · same deal, 3 products live
Conventional
25% down · 7.5% · 30yr
- Down + closing
- —
- Monthly P&I
- —
- Monthly cashflow
- —
- DSCR
- —
- Eligible?
- —
Personal DTI + credit; lowest rate.
DSCR
20% down · 8.5% · 30yr
- Down + closing
- —
- Monthly P&I
- —
- Monthly cashflow
- —
- DSCR
- —
- Eligible?
- —
No personal income docs; deal must DSCR.
Hard money
10% down · 12.0% · 12mo
- Down + closing
- —
- Monthly P&I
- —
- Monthly cashflow
- —
- DSCR
- —
- Eligible?
- —
Short-term bridge; refi at stabilization.
Rent comps 2 comps
| Address | Beds | Baths | Sqft | Rent | $/sqft | DOM | Units | Dist |
|---|---|---|---|---|---|---|---|---|
| 1115 Myrtle Ave Ashtabula, OH | 3.0 | 1.5 | 1184 | $1,600 | $1.35 | 43d | 1 | 1.24mi |
| 1036 Union Ave Unit 1496086P Ashtabula, OH | 3.0 | 1.0 | 1496 | $5,341 | $3.57 | 43d | 1 | 1.48mi |
Listing history 18 events
-
2026-06-18days on market $139,000 Active 44 DOM
-
2026-06-17days on market $139,000 Active 43 DOM
-
2026-06-16days on market $139,000 Active 42 DOM
-
2026-06-15days on market $139,000 Active 41 DOM
-
2026-06-13days on market $139,000 Active 39 DOM
-
2026-06-12days on market $139,000 Active 38 DOM
-
2026-06-09days on market $139,000 Active 35 DOM
-
2026-06-09price $139,000 Active 34 DOM
-
2026-06-08days on market $149,900 Active 34 DOM
-
2026-06-07days on market $149,900 Active 33 DOM
-
2026-06-07days on market $149,900 Active 32 DOM
-
2026-06-04days on market $149,900 Active 29 DOM
-
2026-06-02days on market $149,900 Active 28 DOM
-
2026-06-01days on market $149,900 Active 27 DOM
-
2026-05-31days on market $149,900 Active 26 DOM
-
2026-05-05$149,900 Active 360-char remark
-
1997-06-30soldstatus $33,500
-
1994-11-18soldstatus $25,000
ⓘ Source: listings_history table (triggers on properties + properties_extension) + one-shot
backfill from property_details.listing_events for pre-trigger history.
Tax reassessment forecast OH · Partial reset (capped growth)
- Current annual tax
- $792 · $66/mo
- Projected year-2 tax
- $1,480 · $123/mo
- Expected delta
- +$688/yr (+$57/mo · 86.8%)
ⓘ Screening estimate from a state-policy table — verify with the county assessor before closing.
Climate risk First Street
- Flood 1/10 Low FEMA zone X (unshaded) · 0% chance over 30 yrs
- Wildfire 1/10 Low
- Heat 3/10 Moderate 7 d/yr ≥93°F today · 17 d/yr by 30 yrs out
- Wind 1/10 Low
- Air quality 3/10 Moderate 2 unhealthy d/yr today · 5 by 30 yrs out
Nearby sold comps map
Loading sold comps map…
Walkable amenities ~0.75 mi
Loading nearby amenities…
Taxation est. · year 1
- Rental income
- $37,158
- − Mortgage interest
- −$7,786
- − Property taxes
- −$792
- − Insurance
- −$695
- − Repairs & maintenance
- −$2,973
- − Management
- −$2,973
- − Depreciation
- −$4,044
- Taxable income
- $17,896
- Est. tax owed @ 24.0%
- −$4,295
- After-tax cash flow
- $14,825/yr
For passive investors: Depreciation is non-cash, so a rental often shows a tax loss while cash-flowing — sheltering income. Rental losses are passive: they offset passive income freely, and up to $25,000/yr can offset ordinary (W-2) income if you actively participate and your MAGI is under $100k (phasing out to $0 by $150k); unused losses carry forward. On sale, claimed depreciation is recaptured at up to 25%, and gains may owe capital-gains tax (a 1031 exchange can defer both). Figures are a year-1 estimate at your 24.0% rate — not tax advice; consult a CPA.
Schools (NCES district)
- District
- Ashtabula Area City
- NCES district ID
- 3904351
- Math proficiency
- 24% ▼ -27.00%
- Reading proficiency
- 35% ▼ -13.00%
- Median HH income
- $34,812
- Composite
- 24.3/100
- National rank
- #7712
- State rank
- #588 of 656 in OH
Livability — Ashtabula
- Score
- 71/100
- State rank
- #420
- US rank
- #6883
Category grades
Schools grade is shown separately in the Schools card above.
Census & demographics
- Census place
- Ashtabula, OH
- County
- Ashtabula · 97,617 people
- City population
- 31,076
- Metro
- Cleveland, OH
- Population (ZIP)
- 31,076
- Household income
- $49,507
- Rent vs Own
- Severe rent burden
- 14.1
Population outlook (Ashtabula County) Hauer SSP2
- Today (2025)
- 92,950 people
- By 2030
- 89,146 · -4.1%
- By 2040
- 80,715 · -13.2%
- By 2050
- 72,270 · -22.2%
- By 2075
- 55,780 · -40.0%
- By 2100
- 40,928 · -56.0%
Race, ethnicity, and origin ACS 2023
- Neighborhood character
- Predominantly White (79%)
- Race & ethnicity
- White 79% Hispanic / Latino 9% Two or more races 7% Black 6%
- Hispanic origin (detail)
- Mexican 3% Puerto Rican 5%
- Common ancestry
- Romanian 4% Iranian 2% Slovak 1%
- Foreign-born
- 3% · Canada
- Languages at home
- 94% English-only · Spanish 4%
Political lean MEDSL · Ashtabula
- 2024 margin
- Strong R (+28.4) · D 35.4% · R 63.8%
- 2008→2024 swing
- -41.9pp toward R · 2008: 13.5pp · 2024: -28.4pp
- All cycles
- 2024: R+28.4 2020: R+23.5 2016: R+19.0 2012: D+12.1 2008: D+13.5
Not yet ingested
- Civics
- —
Market trends
- HPI YoY
- ▼ -114.51%
- Current HPI
- 260.7146
- Rent YoY
- —
- Metro
- —
- State GDP YoY
- ▲ 1.98%
- F500 in state
- 48
Industry mix (Fortune 500 HQ in OH)
| Industry | F500 HQs | Revenue |
|---|---|---|
| Insurance | 3 | $145B |
|
||
| Industrial Machinery | 3 | $49B |
|
||
| Financial Services | 3 | $24B |
|
||
| Consumer Goods | 2 | $93B |
|
||
| Aerospace / Defense | 2 | $47B |
|
||
| Utilities | 2 | $33B |
|
||
Price history
+456.0% since first listed4 events — show timeline
- 2026-06-08 Price Changed $139,000 MLSNOW
- 2026-05-05 Listed $149,900 MLSNOW
- 1997-06-30 Sold (Public Records) $33,500 Public Records
- 1994-11-18 Sold (Public Records) $25,000 Public Records
Property tax history
-0.6%/yrLatest (2025): $792 · -0.3% YoY. Source: county tax records.
Cash-flow waterfall
monthlySold comps — $/sqft
last 12 mo · ≤1 miLoading sold comps…