 🏢 Co-op
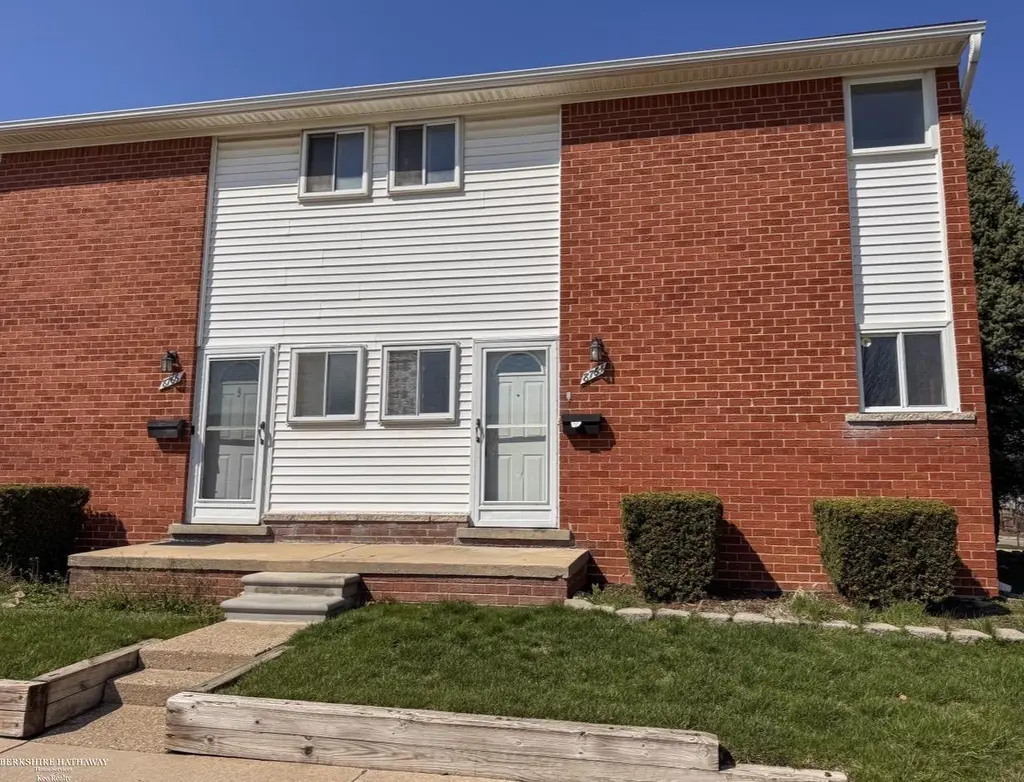
8764 Kaltz Ave · Center Line, MI
Flood risk No data
- FEMA flood zone
- —
- Chance of flooding over 30 yrs
- —
- Est. flood insurance / yr
- —
Fire risk No data
- Est. fire insurance / yr
- —
Heat risk No data
- Hot days now (above threshold)
- —
- Hot days in 30 yrs
- —
Wind risk No data
- Chance of severe wind over 30 yrs
- —
Air-quality risk No data
- Unhealthy air days now
- —
- Unhealthy air days in 30 yrs
- —
Risk factors via First Street. Map © Google.
Why this score? — see what drove the C grade
The composite is a weighted blend of 9 inputs, each scored 0–100. Each bar is that input's sub-score; the figure is the points it added to the 100-point composite (weight × sub-score).
- Cash flow +24.2/30.0
- 1% rule +10.0/10.0
- DSCR +7.8/10.0
- ARV discount +7.1/15.0
- Livability +3.7/5.0
- Rent growth +2.5/5.0
- Condition / age +2.5/5.0
- Schools +1.0/10.0
- Appreciation +0.0/10.0
$65,000
🖨 Deal sheet 📄 Offer letter ✓ Due diligence
Listing remarks MLS
* Under Renovation * Welcome home to this well maintained two bedroom, one and half bath cooperative. This townhouse style unit is an end unit with approximately 1,000sqft of finished living space plus a freshly painted basement, this home offers comfortable, functional living throughout. Inside you'll find new flooring and refinished hardwood flooring, fresh paint and thoughtful updates that make this unit move-in ready. The spacious living area flows in the a bright kitchen and dining space, while the basement provides additional flexible space. This cooperative community has a monthly carrying charge that covers interior and exterior maintenance along with water, trash, snow removal, clubhouse access, taxes and more. Sale is cash only and must be owner-occupied.
Key facts
- $450 HOA
- Built 1966
- Listed 71 days
Neighborhood map
What this means for you Summary
Snapshot
- This is a 2-bed/1.5-bath condo listed at $65k.
Deal economics
- At list price, monthly cash flow is $130 ($2k/yr) — positive.
- The deal already cash-flows at list — no discount required.
- Meets the 1% rule at list price ($1k rent vs $65k).
- Recommended offer: $61k (6.0% below list) — sets the bar for market timing.
- Cap rate 8.7% vs local median 5.9% in Center Line — top-decile yield for the area; either an underpriced asset or a hidden risk that comps aren't pricing in. Stress-test before assuming the spread holds.
Location & tenants
- Location reads 74/100 on livability (#190 in MI, #4,835 nationally) — a middle-class / working-renter tenant base. Strengths: commute A+, cost of living A+, housing A+; Watch: amenities C-, crime D+, health & safety D.
- Van Dyke Public Schools (urban): math 7% / reading 19% proficiency, ranked #512 of 540 in MI (top 95%) — low school quality limits family demand, transient renter base, plan for 1-2y turnover; 80% free/reduced lunch — lower-income household profile, screen leases tightly.
- Market conditions: 34 active listings in the ZIP; 35 comparable units currently listed for rent nearby; rentals at typical pace (median 25d on market — plan ~3-4 weeks tenant-placement turnaround); 1,321 units permitted in Macomb County in 2024 (86 in 5+ unit buildings).
Forward outlook
- Local home prices are declining (-3.0%/yr); year-one equity from $449 of loan paydown is wiped out by about $2k of value loss. Plan a longer hold.
- Macomb County population projected at +9% by 2050 — modest demand growth; plan on rents tracking national, not racing it.
Negotiation context
- It's been on market 71 days — a 6% lower offer ($61k) is reasonable based on typical stale-listing flexibility.
- 6 sale attempts since 7y ago with the ask held roughly flat each time — persistent listings suggest the price (not the market) is what's stuck; bring a comps-based counter.
- Current owner paid $42k; list at $65k implies a 55% gain — meaningful room to come down on a strong offer.
Risks & watch-outs
- Watch-outs: HOA is 35% of rent.
Questions for the listing agent
- It's been on market 71 days. Have you received any prior offers? Is the seller open to a 6% concession, seller financing, or rate buy-down credit?
- Built in 1966 — when were the roof, HVAC, electrical panel, plumbing, and water heater last replaced?
- What does the HOA fee cover, when was the last increase, and are there any pending special assessments or reserve-fund shortfalls?
- Any open or pending special assessments — roof, HVAC, plumbing, elevator, façade? What's the per-unit balance and payoff schedule, and is the seller paying it off at close or rolling it to the buyer?
- Why hasn't it sold? Are there any deal-killer items the seller is aware of (foundation, flood, title, zoning, code violations)?
- Is there a deadline driving the sale (1031 exchange, divorce, estate, relocation)? That informs how much negotiation room exists.
- Schools are D-rated, which usually means shorter tenancies and higher turnover. Who's the typical renter profile here, and what's been the actual vacancy rate?
- Crime grade is D in this area — have there been break-ins, vandalism, or insurance claims at this property in the last 3 years? What carrier currently insures it and at what premium?
- What's the average days-on-market for RENTAL listings here right now (not sales)? A rising rental-DOM trend means longer vacancies and softer asking-rent achievability than the comps imply.
- What's the recent tenant-quality profile in this submarket — average credit score on applications, eviction rate, late-payment / NSF rate, and stable-employment percentage? A property-management company in the area should have these aggregated.
- How much new apartment / multifamily construction is in the pipeline within 1–3 miles? Heavy new supply (>2% of stock underway) typically softens rents 12–24 months out; light construction supports rent growth.
Investment metrics
- 1% rule
- 2.00% ✓
- Cap rate
- 8.69%
- Cash-on-cash
- 8.56%
- DSCR
- 1.38
- GRM
- 4.2
CMA / ARV
- ARV (median comp)
- $64,374
- List price
- $65,000
- Delta
- 0.97%
- Verdict
- FAIR
- Comps
- 20 within 1.0 mi
Projected returns pro-forma
-3.0% appreciation · 3.0% rent growth · sell at horizon
- IRR
- -2.9%
- Equity multiple
- 0.89×
- Total profit
- $-1,965
- Equity at exit
- $9,692
- IRR
- 7.3%
- Equity multiple
- 1.56×
- Total profit
- $10,144
- Equity at exit
- $5,620
Cash invested: $18,200 (down + closing). Projections, not guarantees.
Landlord ↔ Tenant lean methodology
- Overall (STATE)
- 62 Landlord-Friendly
- State Michigan
- 62 Landlord-Friendly · EVEN
- County
- — inherits STATE
- City
- — inherits STATE
ZIP-level market 48015
- Home prices YoY
- -20.6%
- Active inventory
- 34
- Price-to-rent
- 4.2×
Monthly cashflow live
- Estimated rent
- $1,303 high interval (Pro) →
- Mortgage (P&I)
- −$341
- Tax est. 1.5%
- −$81 /mo · $975/yr
- Insurance
- −$27
- HOA
- −$450
- Vacancy / Maint / Mgmt
- −$274
- Net cashflow
- $130
Break-even live
UW: 25.0% down · 7.5% · 30yr · 1.5% tax · 5.0% vac · 8.0% maint · 8.0% mgmt
Financing live
Cash to close
- Down payment
- $16,250
- Closing costs
- $1,950
- Reserves months
- —
- Total cash needed
- —
Loan-product check · same deal, 3 products live
Conventional
25% down · 7.5% · 30yr
- Down + closing
- —
- Monthly P&I
- —
- Monthly cashflow
- —
- DSCR
- —
- Eligible?
- —
Personal DTI + credit; lowest rate.
DSCR
20% down · 8.5% · 30yr
- Down + closing
- —
- Monthly P&I
- —
- Monthly cashflow
- —
- DSCR
- —
- Eligible?
- —
No personal income docs; deal must DSCR.
Hard money
10% down · 12.0% · 12mo
- Down + closing
- —
- Monthly P&I
- —
- Monthly cashflow
- —
- DSCR
- —
- Eligible?
- —
Short-term bridge; refi at stabilization.
Rent comps 35 comps
| Address | Beds | Baths | Sqft | Rent | $/sqft | DOM | Units | Dist |
|---|---|---|---|---|---|---|---|---|
| 11130 Stephens Rd Warren, MI | 2.0 | 1.0 | 750 | $1,300 | $1.73 | 44d | 1 | 0.28mi |
| 8716 Timken Ave Warren, MI | 3.0 | 1.0 | 1008 | $1,400 | $1.39 | 24d | 1 | 0.48mi |
| 8428 Timken Ave Warren, MI | 3.0 | 1.0 | 860 | $1,250 | $1.45 | 24d | 1 | 0.54mi |
| 11404 Warren Blvd Unit 102 Warren, MI | 2.0 | 1.0 | 900 | $1,250 | $1.39 | 24d | 1 | 0.54mi |
| 11500 Warren Blvd Warren, MI | 1.0 | 1.0 | 800 | $1,125 | $1.41 | 15d | 1 | 0.54mi |
| 11476 Warren Blvd Unit 114 Warren, MI | 1.0 | 1.0 | 800 | $1,125 | $1.41 | 44d | 1 | 0.55mi |
| 8636 Republic Ave Warren, MI | 2.0 | 1.0 | 800 | $1,250 | $1.56 | 15d | 1 | 0.60mi |
| 8707 Continental Ave Warren, MI | 3.0 | 1.0 | 1100 | $1,200 | $1.09 | 5d | 1 | 0.62mi |
| 8707 Continental Ave Warren, MI | 3.0 | 1.0 | 968 | $1,200 | $1.24 | 18d | 1 | 0.62mi |
| 25108 Hoover Rd Warren, MI | 1.0–2.0 | 1.0 | 702 | $1,324 | $1.88 | 2d | 65 | 0.62mi |
| 8212 Timken Ave Warren, MI | 2.0 | 1.0 | 756 | $1,320 | $1.75 | 24d | 1 | 0.62mi |
| 8125 Timken Ave Warren, MI | 3.0 | 1.0 | 948 | $1,270 | $1.34 | 5d | 1 | 0.63mi |
| 11332 Republic Ave Warren, MI | 3.0 | 1.0 | 1140 | $1,500 | $1.32 | 24d | 1 | 0.64mi |
| 11331 Continental Ave Warren, MI | 2.0 | 1.0 | 765 | $1,250 | $1.63 | 24d | 1 | 0.66mi |
| 8693 Paige Ave Warren, MI | 3.0 | 1.0 | 900 | $1,300 | $1.44 | 24d | 1 | 0.67mi |
| 8625 Dale Center Line, MI | 3.0 | 1.5 | 1179 | $1,796 | $1.52 | 44d | 1 | 0.69mi |
| 8509 Paige Ave Warren, MI | 3.0 | 1.0 | 950 | $1,300 | $1.37 | 24d | 1 | 0.69mi |
| 11099 Dodge Ave Warren, MI | 2.0 | 1.0 | 1190 | $1,150 | $0.97 | 20d | 1 | 0.78mi |
| 7256 Ready Ave Warren, MI | 3.0 | 2.0 | 1300 | $1,500 | $1.15 | 24d | 1 | 0.84mi |
| 25005 Lawrence Ave Center Line, MI | 1.0–2.0 | 1.0–1.5 | 1000 | $955 | $0.95 | 44d | 1 | 0.89mi |
| 11359 Maxwell Ave Unit 11359 Warren, MI | 2.0 | 1.0 | 900 | $1,000 | $1.11 | 4d | 1 | 0.89mi |
| 25146 Wagner Ave Warren, MI | 3.0 | 1.0 | 906 | $1,900 | $2.10 | 24d | 1 | 0.89mi |
| 11076 Hudson Ave Warren, MI | 3.0 | 1.0 | 936 | $1,395 | $1.49 | 3d | 1 | 1.11mi |
| 8251 Hudson Ave Warren, MI | 3.0 | 1.0 | 908 | $1,400 | $1.54 | 24d | 1 | 1.14mi |
| 8632 Studebaker Ave Warren, MI | 3.0 | 1.0 | 761 | $1,300 | $1.71 | 3d | 1 | 1.16mi |
| 11319 Chalmers Ave Warren, MI | 3.0 | 1.0 | 975 | $1,500 | $1.54 | 24d | 1 | 1.20mi |
| 8640 Chalmers Ave Warren, MI | 3.0 | 1.0 | 804 | $1,423 | $1.77 | 24d | 1 | 1.21mi |
| 11809 McKinley Dr Warren, MI | 3.0 | 1.5 | 1212 | $1,800 | $1.49 | 18d | 1 | 1.25mi |
| 7568 Hudson Ave Unit 1 Warren, MI | 3.0 | 1.0 | 1415 | $1,100 | $0.78 | 5d | 1 | 1.27mi |
| 7568 Hudson Ave Unit 2 Warren, MI | 2.0 | 1.0 | 1415 | $900 | $0.64 | 5d | 1 | 1.27mi |
| 8162 Orchard Ave Warren, MI | 2.0 | 1.0 | 900 | $1,000 | $1.11 | 44d | 1 | 1.37mi |
| 7275 Chalmers Ave Warren, MI | 2.0 | 1.0 | 703 | $1,200 | $1.71 | 24d | 1 | 1.38mi |
| 7511 Toepfer Rd Warren, MI | 3.0 | 1.0 | 1032 | $1,199 | $1.16 | 22d | 1 | 1.41mi |
| 8065 Meadow Ave Warren, MI | 2.0 | 1.0 | 800 | $1,050 | $1.31 | 24d | 1 | 1.43mi |
| 27107 Seyburn Ave Warren, MI | 2.0 | 1.0 | 750 | $1,300 | $1.73 | 22d | 1 | 1.46mi |
HOA detail condo
- Monthly dues
- $450 · $5,400/yr
- Likely covers
- watertrashsnow removalexterior maint.
- Assessments
- None detected in remarks — confirm with the listing agent.
Listing history 27 events
-
2026-06-18days on market $65,000 Active 71 DOM
-
2026-06-17days on market $65,000 Active 70 DOM
-
2026-06-16days on market $65,000 Active 69 DOM
-
2026-06-15days on market $65,000 Active 68 DOM
-
2026-06-13days on market $65,000 Active 66 DOM
-
2026-06-13days on market $65,000 Active 65 DOM
-
2026-06-09days on market $65,000 Active 62 DOM
-
2026-06-08days on market $65,000 Active 61 DOM
-
2026-06-07days on market $65,000 Active 60 DOM
-
2026-06-04days on market $65,000 Active 57 DOM
-
2026-06-03days on market $65,000 Active 56 DOM
-
2026-06-02days on market $65,000 Active 55 DOM
-
2026-06-01days on market $65,000 Active 54 DOM
-
2026-05-31days on market $65,000 Active 53 DOM
-
2026-04-08$65,000 Active 776-char remark
Show marketing remark (776 chars)
* Under Renovation * Welcome home to this well maintained two bedroom, one and half bath cooperative. This townhouse style unit is an end unit with approximately 1,000sqft of finished living space plus a freshly painted basement, this home offers comfortable, functional living throughout. Inside you'll find new flooring and refinished hardwood flooring, fresh paint and thoughtful updates that make this unit move-in ready. The spacious living area flows in the a bright kitchen and dining space, while the basement provides additional flexible space. This cooperative community has a monthly carrying charge that covers interior and exterior maintenance along with water, trash, snow removal, clubhouse access, taxes and more. Sale is cash only and must be owner-occupied.
-
2023-02-03soldstatus $42,000
-
2023-02-03soldstatus $42,000 Closed
-
2023-01-04status Pending
-
2022-12-08$46,599
-
2022-12-08$46,599 Active
-
2019-11-04soldstatus $32,000 Sold
-
2019-11-04soldstatus $32,000 Closed
-
2019-09-30status Pending
-
2019-09-30status Pending
-
2019-09-09$32,000 Active
-
2019-09-09$32,000 Active
ⓘ Source: listings_history table (triggers on properties + properties_extension) + one-shot
backfill from property_details.listing_events for pre-trigger history.
Nearby sold comps map
Loading sold comps map…
Walkable amenities ~0.75 mi
Loading nearby amenities…
Taxation est. · year 1
- Rental income
- $15,632
- − Mortgage interest
- −$3,641
- − Property taxes
- −$975
- − Insurance
- −$325
- − Repairs & maintenance
- −$1,251
- − Management
- −$1,251
- − HOA
- −$5,400
- − Depreciation
- −$1,891
- Taxable income
- $899
- Est. tax owed @ 24.0%
- −$216
- After-tax cash flow
- $1,343/yr
For passive investors: Depreciation is non-cash, so a rental often shows a tax loss while cash-flowing — sheltering income. Rental losses are passive: they offset passive income freely, and up to $25,000/yr can offset ordinary (W-2) income if you actively participate and your MAGI is under $100k (phasing out to $0 by $150k); unused losses carry forward. On sale, claimed depreciation is recaptured at up to 25%, and gains may owe capital-gains tax (a 1031 exchange can defer both). Figures are a year-1 estimate at your 24.0% rate — not tax advice; consult a CPA.
Schools (NCES district)
- District
- Van Dyke Public Schools
- NCES district ID
- 2634680
- Math proficiency
- 7% ▼ -11.00%
- Reading proficiency
- 19% ▼ -5.00%
- Median HH income
- $33,231
- Composite
- 10.46/100
- National rank
- #9784
- State rank
- #512 of 540 in MI
Livability — Center Line
- Score
- 74/100
- State rank
- #190
- US rank
- #4835
Category grades
Schools grade is shown separately in the Schools card above.
Census & demographics
- Census place
- Center Line, MI
- City population
- 8,448
- Population (ZIP)
- 8,448
Population outlook (Macomb County) Hauer SSP2
- Today (2025)
- 925,296 people
- By 2030
- 948,226 · +2.5%
- By 2040
- 983,961 · +6.3%
- By 2050
- 1,010,200 · +9.2%
- By 2075
- 1,076,222 · +16.3%
- By 2100
- 1,077,065 · +16.4%
Race, ethnicity, and origin ACS 2023
- Neighborhood character
- Diverse neighborhood (Simpson 0.64)
- Race & ethnicity
- White 51% Black 30% Asian 11% Two or more races 4% Hispanic / Latino 4% Native American 1%
- Common ancestry
- Romanian 7% Lithuanian 3% German 2%
- Foreign-born
- 15% · Canada, Vietnam
- Languages at home
- 81% English-only · Other Indo-European 9% Russian/Polish/Slavic 5% Spanish 1%
Political lean MEDSL · Macomb
- 2024 margin
- R (+13.7) · D 42.2% · R 55.9% · Other 1.9%
- 2008→2024 swing
- -22.3pp toward R · 2008: 8.6pp · 2024: -13.7pp
- All cycles
- 2024: R+13.7 2020: R+8.1 2016: R+11.6 2012: D+4.0 2008: D+8.6
Not yet ingested
- Civics
- —
Market trends
- HPI YoY
- ▼ -66.73%
- Current HPI
- 256.7842
- Rent YoY
- —
- Metro
- —
- State GDP YoY
- ▲ 1.37%
- F500 in state
- 28
Industry mix (Fortune 500 HQ in MI)
| Industry | F500 HQs | Revenue |
|---|---|---|
| Automotive Parts | 3 | $48B |
|
||
| Automotive | 2 | $372B |
|
||
| Chemicals | 1 | $45B |
|
||
| Automotive Retail | 1 | $29B |
|
||
| Healthcare / Medical Devices | 1 | $23B |
|
||
| Automotive Technology | 1 | $20B |
|
||
Price history
+103.1% since first listed13 events — show timeline
- 2026-04-08 Listed $65,000 REALCOMP
- 2026-04-08 Listed $65,000 MiRealSource-MiMLS
- 2023-02-03 Sold (MLS) $42,000 MiRealSource-MiMLS
- 2023-02-03 Sold (MLS) $42,000 REALCOMP
- 2023-01-04 Pending — MiRealSource-MiMLS
- 2022-12-08 Listed $46,599 MiRealSource-MiMLS
- 2022-12-08 Listed $46,599 REALCOMP
- 2019-11-04 Sold (MLS) $32,000 MiRealSource-MiMLS
- 2019-11-04 Sold (MLS) $32,000 REALCOMP
- 2019-09-30 Pending — MiRealSource-MiMLS
- 2019-09-30 Pending — REALCOMP
- 2019-09-09 Listed $32,000 MiRealSource-MiMLS
- 2019-09-09 Listed $32,000 REALCOMP
Cash-flow waterfall
monthlySold comps — $/sqft
last 12 mo · ≤1 miLoading sold comps…