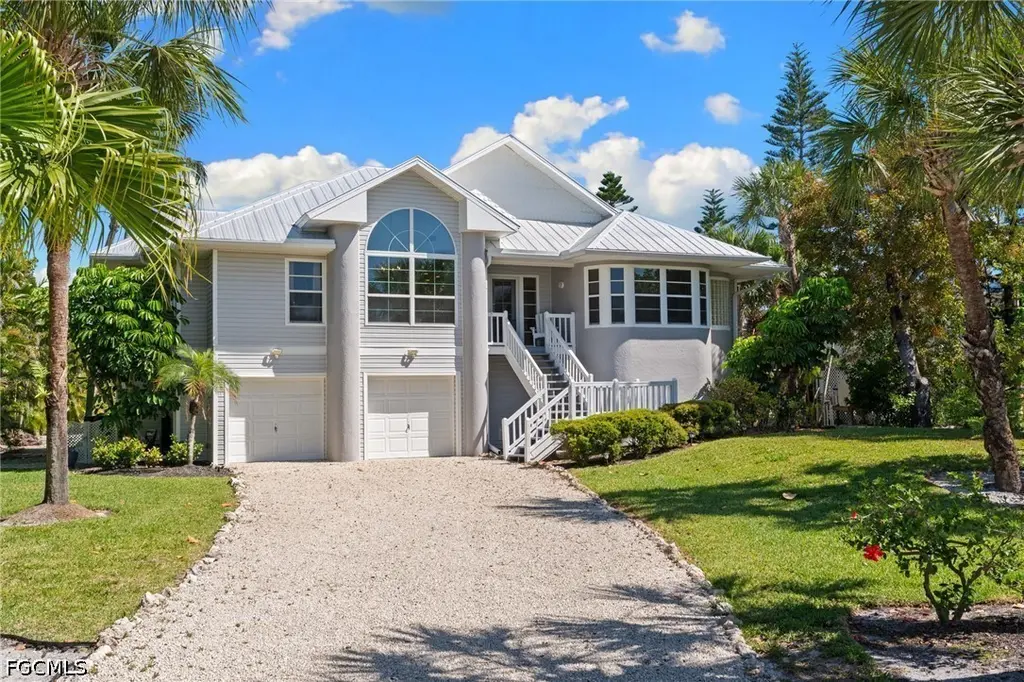
480 Las Tiendas Ln · Sanibel, FL
Flood risk 10/10 · Severe
- FEMA flood zone
- AE
- Chance of flooding over 30 yrs
- 0.99%
- Est. flood insurance / yr
- $1,737 – $8,500
Fire risk 1/10 · Minimal
- Est. fire insurance / yr
- $947 – $1,759
Heat risk 10/10 · Severe
- Hot days now (above 113°F)
- 7 days/yr
- Hot days in 30 yrs
- 26 days/yr
Wind risk 10/10 · Severe
- Chance of severe wind over 30 yrs
- 99.0%
Air-quality risk 2/10 · Minimal
- Unhealthy air days now
- 1 days/yr
- Unhealthy air days in 30 yrs
- 1 days/yr
Risk factors via First Street. Map © Google.
Why this score? — see what drove the B+ grade
The composite is a weighted blend of 9 inputs, each scored 0–100. Each bar is that input's sub-score; the figure is the points it added to the 100-point composite (weight × sub-score).
- Cash flow +30.0/30.0
- ARV discount +13.6/15.0
- 1% rule +10.0/10.0
- DSCR +10.0/10.0
- Schools +4.1/10.0
- Livability +3.4/5.0
- Rent growth +2.5/5.0
- Condition / age +2.5/5.0
- Appreciation +0.0/10.0
$999,000
🖨 Deal sheet 📄 Offer letter ✓ Due diligence
Listing remarks
Located along the charming and quiet Las Tiendas Lane in the East End of Sanibel, this 3 bedroom plus den/ 3 bath elevated island home offers a rare opportunity to own in one of Sanibel’s most coveted locations. Surrounded by lush tropical landscaping, the property is set on a spacious lot along a quiet, shell-lined street, providing both privacy and a true sense of Old Florida charm as well as only a five-minute walk to Sanibel’s world-renowned beaches. Inside, the home features a bright and open floor plan with abundant natural light, three comfortable bedrooms, and a bright den/office providing a seamless flow that is perfect for both relaxing and entertaining. The kitchen op
Key facts
- Elevated island home
- French doors
- Bright den office
Tags
Property features AI
Finance
- Other: Private in-ground heated pool with electric heat and pool equipment
- Financial info: Pets allowed
- HOA & community: Association provides beach access and beach rights; Non-gated community
Exterior
- Parking: Attached garage with 2 spaces; Driveway parking; Unpaved parking areas; Garage door opener
- Security: Smoke detectors
- Utilities: Public water; Public sewer; Cable available; High-speed internet available
- Home design: Single-story home; Resale property; Faces south; North exposure noted; Raised foundation with pillar/post/pier
- Construction: Metal roof; Stucco, vinyl siding and wood frame construction; Built on a raised pier/pillar foundation; Built prior to resale (existing home)
- Exterior features: Fenced yard; Automatic sprinklers (municipal irrigation); Patio and screened porch; Balcony
Interior
- Kitchen: Built-in oven and double oven; Electric cooktop; Dishwasher; Disposal; Microwave; Refrigerator with ice maker; Icemaker
- Bedrooms: Includes den and office (additional flexible rooms)
- Flooring: Carpet and tile
- Bathrooms: Three full bathrooms; Dual sinks in at least one bath; Separate shower and bathtub
- Heating & cooling: Central heating (electric); Central air conditioning (electric); Ceiling fans
- Interior features: Arched, single-hung and sliding windows with window coverings; French doors and atrium-style French door(s); Partially furnished; Breakfast bar and built-in features; Bathtub and separate shower; Dual sinks; Entrance foyer; Fireplace; High ceilings; Living/dining room; Cable TV; Walk-in closets; Window treatments; Home office; Split-bedroom layout
- Laundry & utility: Washer and dryer inside the home
Neighborhood map
What this means for you Summary
Snapshot
- This is a 3-bed/3.0-bath single-family listed at $999k.
Deal economics
- At list price, monthly cash flow is $7k ($84k/yr) — positive.
- The deal already cash-flows at list — no discount required.
- Meets the 1% rule at list price ($18k rent vs $999k).
- Recommended offer: $984k (1.5% below list) — sets the bar for market timing.
- Cap rate 15.2% vs local median 3.8% in Sanibel — top-decile yield for the area; either an underpriced asset or a hidden risk that comps aren't pricing in. Stress-test before assuming the spread holds.
Location & tenants
- Location reads 67/100 on livability (#541 in FL) — a middle-class / working-renter tenant base. Strengths: schools A+, crime A+, employment A+; Watch: housing D+, amenities F, commute F.
- Lee (suburban): math 47% / reading 50% proficiency, ranked #42 of 73 in FL (top 58%) — families likely to look elsewhere, expect single-tenant / working-renter base with shorter leases.
- Market conditions: 526 active listings in the ZIP; 1 comparable units currently listed for rent nearby; 15,411 units permitted in Lee County in 2024 (4,686 in 5+ unit buildings).
Forward outlook
- Local home prices are declining (-3.0%/yr); year-one equity from $7k of loan paydown is wiped out by about $30k of value loss. Plan a longer hold.
- Lee County population projected at +44% by 2050 — long-run rental-demand tailwind backs the buy-and-hold thesis.
- At projected returns (-3.0% appreciation + 3.0% rent growth), your $280k cash investment doubles in ~4 years — after that, you're playing with house money.
Negotiation context
- It's been on market 24 days — a 2% lower offer ($984k) is reasonable based on typical stale-listing flexibility.
- 2 sale attempts since 8y ago with the ask held roughly flat each time — persistent listings suggest the price (not the market) is what's stuck; bring a comps-based counter.
- Current owner paid $433k; list at $999k implies a 131% gain — meaningful room to come down on a strong offer.
Risks & watch-outs
- Watch-outs: flood insurance adds $427/mo.
- Climate carrying-cost: in FEMA flood zone AE (mandatory federal flood insurance); severe wind risk, 99% chance of damaging wind over 30y; extreme-heat days projected 7→26/yr by 2055 (HVAC capex compounding) — expect insurance premiums to compound above CPI over the hold.
Questions for the listing agent
- What's the actual annual flood-insurance premium (NFIP or private), and is the property in a SFHA with mandatory coverage?
- Is there a deadline driving the sale (1031 exchange, divorce, estate, relocation)? That informs how much negotiation room exists.
- Schools are A-rated — typically a magnet for longer-tenancy family renters. What's the average tenant stay here, and is there a school-zone premium baked into asking?
- What's the average days-on-market for RENTAL listings here right now (not sales)? A rising rental-DOM trend means longer vacancies and softer asking-rent achievability than the comps imply.
- What's the recent tenant-quality profile in this submarket — average credit score on applications, eviction rate, late-payment / NSF rate, and stable-employment percentage? A property-management company in the area should have these aggregated.
- How much new for-sale + rental construction is in the pipeline within 1–3 miles? Heavy new supply typically softens prices + rents 12–24 months out; constrained supply supports both.
Investment metrics
- 1% rule
- 1.82% ✓
- Cap rate
- 15.25%
- Cash-on-cash
- 31.98%
- DSCR
- 2.42
- GRM
- 4.6
CMA / ARV
- ARV (on-the-fly)
- $1,156,480
- Comps found
- 1
Show comp detail 1 sale within ~0.75 mi
| Address | Dist | Beds/Ba | Sqft | Sold | Price | $/sf | Match |
|---|---|---|---|---|---|---|---|
| 279 Ferry Landing Dr | 0.42mi | 3/2.0 | 2,031 (+12%) | 1mo | $1,300,000 | $640 | 55 |
Match score weights: distance 35% · size 25% · config 20% · recency 20%. Top-matched comps best support the ARV.
Projected returns pro-forma
-3.0% appreciation · 3.0% rent growth · sell at horizon
- IRR
- 24.8%
- Equity multiple
- 2.02×
- Total profit
- $286,238
- Equity at exit
- $148,954
- IRR
- 32.6%
- Equity multiple
- 3.96×
- Total profit
- $827,801
- Equity at exit
- $86,375
Cash invested: $279,720 (down + closing). Projections, not guarantees.
Landlord ↔ Tenant lean methodology
- Overall (STATE)
- 87 Strongly Landlord-Friendly
- State Florida
- 87 Strongly Landlord-Friendly · R+3
- County
- — inherits STATE
- City
- — inherits STATE
ZIP-level market 33957
- Home prices YoY
- -15.7%
- Active inventory
- 526
- Price-to-rent
- 4.6×
Monthly cashflow live
- Estimated rent
- $18,200 medium interval (Pro) →
- Mortgage (P&I)
- −$5,239
- Tax from tax record
- −$1,269 /mo · $15,229/yr
- Insurance
- −$416
- Flood insurance flood zone
- −$427 /mo · $5,118/yr
- HOA
- −$0
- Vacancy / Maint / Mgmt
- −$3,822
- Net cashflow
- $7,027
Break-even live
UW: 25.0% down · 7.5% · 30yr · 1.5% tax · 5.0% vac · 8.0% maint · 8.0% mgmt
Financing live
Cash to close
- Down payment
- $249,750
- Closing costs
- $29,970
- Reserves months
- —
- Total cash needed
- —
Loan-product check · same deal, 3 products live
Conventional
25% down · 7.5% · 30yr
- Down + closing
- —
- Monthly P&I
- —
- Monthly cashflow
- —
- DSCR
- —
- Eligible?
- —
Personal DTI + credit; lowest rate.
DSCR
20% down · 8.5% · 30yr
- Down + closing
- —
- Monthly P&I
- —
- Monthly cashflow
- —
- DSCR
- —
- Eligible?
- —
No personal income docs; deal must DSCR.
Hard money
10% down · 12.0% · 12mo
- Down + closing
- —
- Monthly P&I
- —
- Monthly cashflow
- —
- DSCR
- —
- Eligible?
- —
Short-term bridge; refi at stabilization.
Rent comps 1 comps
| Address | Beds | Baths | Sqft | Rent | $/sqft | DOM | Units | Dist |
|---|---|---|---|---|---|---|---|---|
| 424 Lagoon Dr Sanibel, FL | 3.0 | 2.0 | 1704 | $18,200 | $10.68 | 23d | 1 | 0.05mi |
Listing history 8 events
-
2026-05-11status Pending
-
2026-04-17$999,000 Active
-
2018-11-28soldstatus $433,000
-
2018-11-05historical
-
2018-09-12price $749,000
-
2018-07-09$799,000 Active
-
2000-02-08soldstatus $390,000
-
1991-02-01soldstatus $96,000
ⓘ Source: listings_history table (triggers on properties + properties_extension) + one-shot
backfill from property_details.listing_events for pre-trigger history.
Tax reassessment forecast FL · Resets to sale price
- Current annual tax
- $15,229 · $1,269/mo
- Projected year-2 tax
- $15,229 · $1,269/mo
- Expected delta
- $0/yr ($0/mo · 0.0%)
ⓘ Screening estimate from a state-policy table — verify with the county assessor before closing.
Climate risk First Street
- Flood 10/10 Extreme FEMA zone AE · 99% chance over 30 yrs
- Wildfire 1/10 Low
- Heat 10/10 Extreme 7 d/yr ≥113°F today · 26 d/yr by 30 yrs out
- Wind 10/10 Extreme 99% chance of damaging wind over 30 yrs
- Air quality 2/10 Low 1 unhealthy d/yr today · 1 by 30 yrs out
Nearby sold comps map
Loading sold comps map…
Walkable amenities ~0.75 mi
Loading nearby amenities…
Taxation est. · year 1
- Rental income
- $218,400
- − Mortgage interest
- −$55,960
- − Property taxes
- −$15,229
- − Insurance
- −$10,114
- − Repairs & maintenance
- −$17,472
- − Management
- −$17,472
- − Depreciation
- −$29,062
- Taxable income
- $73,092
- Est. tax owed @ 24.0%
- −$17,542
- After-tax cash flow
- $66,785/yr
For passive investors: Depreciation is non-cash, so a rental often shows a tax loss while cash-flowing — sheltering income. Rental losses are passive: they offset passive income freely, and up to $25,000/yr can offset ordinary (W-2) income if you actively participate and your MAGI is under $100k (phasing out to $0 by $150k); unused losses carry forward. On sale, claimed depreciation is recaptured at up to 25%, and gains may owe capital-gains tax (a 1031 exchange can defer both). Figures are a year-1 estimate at your 24.0% rate — not tax advice; consult a CPA.
Schools (NCES district)
- District
- Lee
- NCES district ID
- 1201080
- Math proficiency
- 47% ▼ -11.00%
- Reading proficiency
- 50% ▼ -4.00%
- Median HH income
- $49,518
- Composite
- 41.49/100
- National rank
- #3458
- State rank
- #42 of 73 in FL
Livability — Sanibel
- Score
- 67/100
- State rank
- #541
- US rank
- #10166
Category grades
Schools grade is shown separately in the Schools card above.
Census & demographics
- Census place
- Sanibel, FL
- City population
- 6,402
- Population (ZIP)
- 6,402
Population outlook (Lee County) Hauer SSP2
- Today (2025)
- 871,946 people
- By 2030
- 955,468 · +9.6%
- By 2040
- 1,113,587 · +27.7%
- By 2050
- 1,256,891 · +44.1%
- By 2075
- 1,560,270 · +78.9%
- By 2100
- 1,726,848 · +98.0%
Race, ethnicity, and origin ACS 2023
- Neighborhood character
- Predominantly White (95%)
- Race & ethnicity
- White 95% Two or more races 2% Asian 1%
- Common ancestry
- Italian 4% Romanian 4% Slovak 2%
- Foreign-born
- 5% · Canada, China
- Languages at home
- 96% English-only · German/W. Germanic 1% Spanish 1% French/Haitian/Cajun 1%
Political lean MEDSL · Lee
- 2024 margin
- Strong R (+28.4) · D 35.5% · R 63.9%
- 2008→2024 swing
- -18.0pp toward R · 2008: -10.4pp · 2024: -28.4pp
- All cycles
- 2024: R+28.4 2020: R+19.2 2016: R+20.4 2012: R+16.6 2008: R+10.4
Not yet ingested
- Civics
- —
Market trends
- HPI YoY
- ▼ -93.08%
- Current HPI
- 501.0
- Rent YoY
- —
- Metro
- —
- State GDP YoY
- ▲ 3.28%
- F500 in state
- 36
Industry mix (Fortune 500 HQ in FL)
| Industry | F500 HQs | Revenue |
|---|---|---|
| Industrial Technology | 2 | $29B |
|
||
| Insurance | 2 | $17B |
|
||
| Retail | 1 | $60B |
|
||
| Technology Distribution | 1 | $58B |
|
||
| Homebuilding | 1 | $35B |
|
||
| Technology Manufacturing | 1 | $35B |
|
||
Price history
+940.6% since first listed8 events — show timeline
- 2026-05-11 Pending — FORTMLS
- 2026-04-17 Listed $999,000 FORTMLS
- 2018-11-28 Sold (Public Records) $433,000 Public Records
- 2018-11-05 Listing Removed — FORTMLS
- 2018-09-12 Price Changed $749,000 FORTMLS
- 2018-07-09 Listed $799,000 FORTMLS
- 2000-02-08 Sold (Public Records) $390,000 Public Records
- 1991-02-01 Sold (Public Records) $96,000 Public Records
Property tax history
+3.7%/yrLatest (2025): $15,229 · +6.6% YoY. Source: county tax records.
Cash-flow waterfall
monthlySold comps — $/sqft
last 12 mo · ≤1 miLoading sold comps…