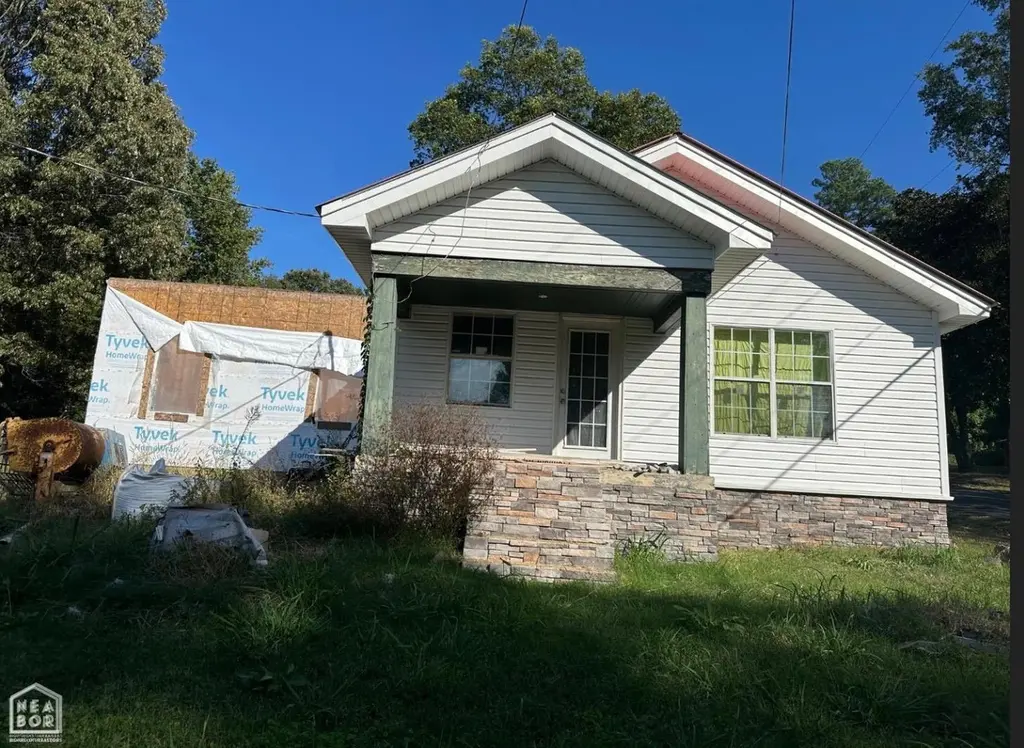
614 Gould St · Harrisburg, AR
Flood risk 1/10 · Minimal
- FEMA flood zone
- X (unshaded)
- Chance of flooding over 30 yrs
- 0.0%
- Est. flood insurance / yr
- $507 – $1,088
Fire risk 2/10 · Minimal
- Est. fire insurance / yr
- $1,499 – $2,785
Heat risk 5/10 · Moderate
- Hot days now (above 110°F)
- 7 days/yr
- Hot days in 30 yrs
- 20 days/yr
Wind risk 4/10 · Minor
- Chance of severe wind over 30 yrs
- 9.0%
Air-quality risk 2/10 · Minimal
- Unhealthy air days now
- 1 days/yr
- Unhealthy air days in 30 yrs
- 1 days/yr
Risk factors via First Street. Map © Google.
Why this score? — see what drove the B- grade
The composite is a weighted blend of 9 inputs, each scored 0–100. Each bar is that input's sub-score; the figure is the points it added to the 100-point composite (weight × sub-score).
- Cash flow +26.0/30.0
- ARV discount +15.0/15.0
- DSCR +8.7/10.0
- 1% rule +5.7/10.0
- Appreciation +3.8/10.0
- Livability +2.8/5.0
- Schools +2.7/10.0
- Rent growth +2.5/5.0
- Condition / age +2.5/5.0
$90,000
🖨 Deal sheet 📄 Offer letter ✓ Due diligence
Listing remarks MLS
New pictures coming soon! Motivated seller!! Welcome to 614 Gould St, Harrisburg - A Project with Promise! This 3-bedroom, 2-bathroom home sits on a spacious half corner lot at Gould & Griffin, offering 1,200 sq ft of potential. Whether you're a savvy investor or a family ready to create your forever home, this property is a fantastic opportunity to finish and customize to your taste. Recently appraised in current condition. Solid bones and a great layout Peaceful, spacious yard with room to grow With the right vision, this house can be transformed into a stunning home or a valuable rental/investment property. Don't miss out on this diamond in the rough with everything you need to bring it to life!
Key facts
- Great layout
- 0.5 acre lot
- Built 2009
Tags
Neighborhood map
What this means for you Summary
Snapshot
- This is a 3-bed/1.0-bath single-family listed at $90k.
Deal economics
- At list price, monthly cash flow is $224 ($3k/yr) — positive.
- The deal already cash-flows at list — no discount required.
- Meets the 1% rule at list price ($962 rent vs $90k).
- Recommended offer: $82k (9.0% below list) — sets the bar for market timing.
Location & tenants
- Location reads 56/100 on livability (#375 in AR) — a working-class tenant base; expect higher turnover. Strengths: cost of living A+, health & safety A, housing A-; Watch: schools D, employment D, crime D-.
- Harrisburg School District (rural): math 31% / reading 35% proficiency, ranked #137 of 238 in AR (top 58%) — families likely to look elsewhere, expect single-tenant / working-renter base with shorter leases; 86% free/reduced lunch — lower-income household profile, screen leases tightly.
- Market conditions: 55 active listings in the ZIP; 67 units permitted in Poinsett County in 2024 (5 in 5+ unit buildings).
Forward outlook
- Local home prices are declining (-2.4%/yr); year-one equity from $622 of loan paydown is wiped out by about $2k of value loss. Plan a longer hold.
- Poinsett County population projected at -13% by 2050 — secular population decline; favor cash flow + early exit over multi-decade hold.
- At projected returns (-2.4% appreciation + 3.0% rent growth), your $25k cash investment doubles in ~10 years — after that, you're playing with house money.
Negotiation context
- It's been on market 111 days — a 9% lower offer ($82k) is reasonable based on typical stale-listing flexibility.
- 2 sale attempts with the ask held roughly flat each time — persistent listings suggest the price (not the market) is what's stuck; bring a comps-based counter.
- Current owner paid $25k; list at $90k implies a 260% gain — meaningful room to come down on a strong offer.
Risks & watch-outs
- Climate carrying-cost: extreme-heat days projected 7→20/yr by 2055 (HVAC capex compounding) — expect insurance premiums to compound above CPI over the hold.
Questions for the listing agent
- It's been on market 111 days. Have you received any prior offers? Is the seller open to a 9% concession, seller financing, or rate buy-down credit?
- Why hasn't it sold? Are there any deal-killer items the seller is aware of (foundation, flood, title, zoning, code violations)?
- Is there a deadline driving the sale (1031 exchange, divorce, estate, relocation)? That informs how much negotiation room exists.
- Schools are D-rated, which usually means shorter tenancies and higher turnover. Who's the typical renter profile here, and what's been the actual vacancy rate?
- Crime grade is D in this area — have there been break-ins, vandalism, or insurance claims at this property in the last 3 years? What carrier currently insures it and at what premium?
- What's the average days-on-market for RENTAL listings here right now (not sales)? A rising rental-DOM trend means longer vacancies and softer asking-rent achievability than the comps imply.
- What's the recent tenant-quality profile in this submarket — average credit score on applications, eviction rate, late-payment / NSF rate, and stable-employment percentage? A property-management company in the area should have these aggregated.
- How much new for-sale + rental construction is in the pipeline within 1–3 miles? Heavy new supply typically softens prices + rents 12–24 months out; constrained supply supports both.
Investment metrics
- 1% rule
- 1.07% ✓
- Cap rate
- 9.28%
- Cash-on-cash
- 10.66%
- DSCR
- 1.47
- GRM
- 7.8
CMA / ARV
- ARV (median comp)
- $120,755
- List price
- $90,000
- Delta
- -25.47%
- Verdict
- UNDERPRICED
- Comps
- 20 within 1.0 mi
Show comp detail 1 sale within ~0.75 mi
| Address | Dist | Beds/Ba | Sqft | Sold | Price | $/sf | Match |
|---|---|---|---|---|---|---|---|
| 202 W South St | 0.58mi | 2/1.0 (-1) | 956 (+15%) | 15mo | $55,000 | $58 | 30 |
Match score weights: distance 35% · size 25% · config 20% · recency 20%. Top-matched comps best support the ARV.
Projected returns pro-forma
-2.43% appreciation · 3.0% rent growth · sell at horizon
- IRR
- 1.8%
- Equity multiple
- 1.07×
- Total profit
- $1,810
- Equity at exit
- $15,728
- IRR
- 10.4%
- Equity multiple
- 1.86×
- Total profit
- $21,679
- Equity at exit
- $11,806
Cash invested: $25,200 (down + closing). Projections, not guarantees.
Landlord ↔ Tenant lean methodology
- Overall (STATE)
- 92 Strongly Landlord-Friendly
- State Arkansas
- 92 Strongly Landlord-Friendly · R+14
- County
- — inherits STATE
- City
- — inherits STATE
ZIP-level market 72432
- Home prices YoY
- -1.2%
- Active inventory
- 55
- Price-to-rent
- 7.8×
Monthly cashflow live
- Estimated rent
- $962 medium interval (Pro) →
- Mortgage (P&I)
- −$472
- Tax from tax record
- −$27 /mo · $323/yr
- Insurance
- −$38
- HOA
- −$0
- Vacancy / Maint / Mgmt
- −$202
- Net cashflow
- $224
Break-even live
UW: 25.0% down · 7.5% · 30yr · 1.5% tax · 5.0% vac · 8.0% maint · 8.0% mgmt
Financing live
Cash to close
- Down payment
- $22,500
- Closing costs
- $2,700
- Reserves months
- —
- Total cash needed
- —
Loan-product check · same deal, 3 products live
Conventional
25% down · 7.5% · 30yr
- Down + closing
- —
- Monthly P&I
- —
- Monthly cashflow
- —
- DSCR
- —
- Eligible?
- —
Personal DTI + credit; lowest rate.
DSCR
20% down · 8.5% · 30yr
- Down + closing
- —
- Monthly P&I
- —
- Monthly cashflow
- —
- DSCR
- —
- Eligible?
- —
No personal income docs; deal must DSCR.
Hard money
10% down · 12.0% · 12mo
- Down + closing
- —
- Monthly P&I
- —
- Monthly cashflow
- —
- DSCR
- —
- Eligible?
- —
Short-term bridge; refi at stabilization.
Listing history 24 events
-
2026-06-19days on market $90,000 Active 111 DOM
-
2026-06-18days on market $90,000 Active 110 DOM
-
2026-06-17days on market $90,000 Active 109 DOM
-
2026-06-16days on market $90,000 Active 108 DOM
-
2026-06-15days on market $90,000 Active 107 DOM
-
2026-06-14days on market $90,000 Active 105 DOM
-
2026-06-13days on market $90,000 Active 104 DOM
-
2026-06-10days on market $90,000 Active 102 DOM
-
2026-06-09days on market $90,000 Active 101 DOM
-
2026-06-08days on market $90,000 Active 100 DOM
-
2026-06-07days on market $90,000 Active 99 DOM
-
2026-06-05days on market $90,000 Active 96 DOM
-
2026-06-03days on market $90,000 Active 95 DOM
-
2026-06-02days on market $90,000 Active 94 DOM
-
2026-06-01days on market $90,000 Active 93 DOM
-
2026-05-31days on market $90,000 Active 92 DOM
-
2026-05-30days on market $90,000 Active 91 DOM
-
2026-02-28$90,000 Active 713-char remark
Show marketing remark (713 chars)
New pictures coming soon! Motivated seller!! Welcome to 614 Gould St, Harrisburg - A Project with Promise! This 3-bedroom, 2-bathroom home sits on a spacious half corner lot at Gould & Griffin, offering 1,200 sq ft of potential. Whether you're a savvy investor or a family ready to create your forever home, this property is a fantastic opportunity to finish and customize to your taste. Recently appraised in current condition. Solid bones and a great layout Peaceful, spacious yard with room to grow With the right vision, this house can be transformed into a stunning home or a valuable rental/investment property. Don't miss out on this diamond in the rough with everything you need to bring it to life!
-
2026-02-21price $88,500
-
2026-01-03price $125,000
-
2025-11-29price $158,000
-
2025-10-17$168,000 Active
-
2009-10-08soldstatus $25,000
-
2006-06-23soldstatus $10,000
ⓘ Source: listings_history table (triggers on properties + properties_extension) + one-shot
backfill from property_details.listing_events for pre-trigger history.
Tax reassessment forecast AR · Resets to sale price
- Current annual tax
- $323 · $27/mo
- Projected year-2 tax
- $576 · $48/mo
- Expected delta
- +$253/yr (+$21/mo · 78.2%)
ⓘ Screening estimate from a state-policy table — verify with the county assessor before closing.
Climate risk First Street
- Flood 1/10 Low FEMA zone X (unshaded) · 0% chance over 30 yrs
- Wildfire 2/10 Low
- Heat 5/10 Major 7 d/yr ≥110°F today · 20 d/yr by 30 yrs out
- Wind 4/10 Moderate 9% chance of damaging wind over 30 yrs
- Air quality 2/10 Low 1 unhealthy d/yr today · 1 by 30 yrs out
Nearby sold comps map
Loading sold comps map…
Walkable amenities ~0.75 mi
Loading nearby amenities…
Taxation est. · year 1
- Rental income
- $11,549
- − Mortgage interest
- −$5,041
- − Property taxes
- −$323
- − Insurance
- −$450
- − Repairs & maintenance
- −$924
- − Management
- −$924
- − Depreciation
- −$2,618
- Taxable income
- $1,269
- Est. tax owed @ 24.0%
- −$304
- After-tax cash flow
- $2,383/yr
For passive investors: Depreciation is non-cash, so a rental often shows a tax loss while cash-flowing — sheltering income. Rental losses are passive: they offset passive income freely, and up to $25,000/yr can offset ordinary (W-2) income if you actively participate and your MAGI is under $100k (phasing out to $0 by $150k); unused losses carry forward. On sale, claimed depreciation is recaptured at up to 25%, and gains may owe capital-gains tax (a 1031 exchange can defer both). Figures are a year-1 estimate at your 24.0% rate — not tax advice; consult a CPA.
Schools (NCES district)
- District
- Harrisburg School District
- NCES district ID
- 0507350
- Math proficiency
- 31% ▼ -11.00%
- Reading proficiency
- 35% ▼ -5.00%
- Median HH income
- $34,332
- Composite
- 27.19/100
- National rank
- #7021
- State rank
- #137 of 238 in AR
Livability — Harrisburg
- Score
- 56/100
- State rank
- #375
- US rank
- #22427
Category grades
Schools grade is shown separately in the Schools card above.
Census & demographics
- Census place
- Harrisburg, AR
- City population
- 6,537
- Population (ZIP)
- 6,537
Population outlook (Poinsett County) Hauer SSP2
- Today (2025)
- 22,998 people
- By 2030
- 22,356 · -2.8%
- By 2040
- 21,150 · -8.0%
- By 2050
- 20,035 · -12.9%
- By 2075
- 17,745 · -22.8%
- By 2100
- 15,358 · -33.2%
Race, ethnicity, and origin ACS 2023
- Neighborhood character
- Predominantly White (91%)
- Race & ethnicity
- White 91% Two or more races 5% Hispanic / Latino 3% Black 3%
- Common ancestry
- Iranian 1%
- Foreign-born
- 1%
- Languages at home
- 97% English-only · Spanish 2% French/Haitian/Cajun 1%
Political lean MEDSL · Poinsett
- 2024 margin
- Solid R (+63.5) · D 17.4% · R 81.0% · Other 1.6%
- 2008→2024 swing
- -36.3pp toward R · 2008: -27.2pp · 2024: -63.5pp
- All cycles
- 2024: R+63.5 2020: R+59.8 2016: R+24.1 2012: R+34.2 2008: R+27.2
Not yet ingested
- Civics
- —
Market trends
- HPI YoY
- ▼ -2.43%
- Current HPI
- 205.4239
- Rent YoY
- —
- Metro
- —
- State GDP YoY
- ▲ 3.80%
- F500 in state
- 10
Industry mix (Fortune 500 HQ in AR)
| Industry | F500 HQs | Revenue |
|---|---|---|
| Retail | 1 | $681B |
|
||
| Food / Agriculture | 1 | $53B |
|
||
| Retail / Energy | 1 | $22B |
|
||
| Transportation / Logistics | 1 | $12B |
|
||
| Energy | 1 | $4B |
|
||
Price history
+800.0% since first listed7 events — show timeline
- 2026-02-28 Listed $90,000 NEABOR MLS
- 2026-02-21 Price Changed $88,500 NEABOR MLS
- 2026-01-03 Price Changed $125,000 NEABOR MLS
- 2025-11-29 Price Changed $158,000 NEABOR MLS
- 2025-10-17 Listed $168,000 NEABOR MLS
- 2009-10-08 Sold (Public Records) $25,000 Public Records
- 2006-06-23 Sold (Public Records) $10,000 Public Records
Property tax history
+0.8%/yrLatest (2025): $323 · +7.7% YoY. Source: county tax records.
Cash-flow waterfall
monthlySold comps — $/sqft
last 12 mo · ≤1 miLoading sold comps…