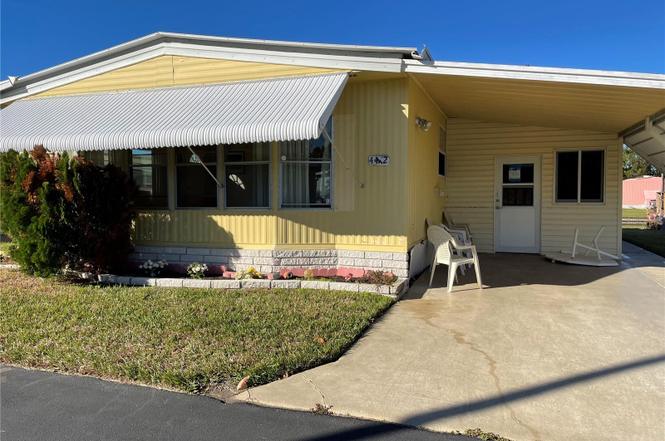
4442 Tucker Sq · Beacon Square, FL
Flood risk 10/10 · Severe
- FEMA flood zone
- AE
- Chance of flooding over 30 yrs
- 0.99%
- Est. flood insurance / yr
- $1,737 – $8,500
Fire risk 3/10 · Minor
- Est. fire insurance / yr
- $947 – $1,759
Heat risk 10/10 · Severe
- Hot days now (above 109°F)
- 7 days/yr
- Hot days in 30 yrs
- 26 days/yr
Wind risk 10/10 · Severe
- Chance of severe wind over 30 yrs
- 99.0%
Air-quality risk 2/10 · Minimal
- Unhealthy air days now
- 1 days/yr
- Unhealthy air days in 30 yrs
- 1 days/yr
Risk factors via First Street. Map © Google.
Why this score? — see what drove the B grade
The composite is a weighted blend of 9 inputs, each scored 0–100. Each bar is that input's sub-score; the figure is the points it added to the 100-point composite (weight × sub-score).
- Cash flow +30.0/30.0
- 1% rule +10.0/10.0
- DSCR +10.0/10.0
- ARV discount +7.5/15.0
- Schools +4.3/10.0
- Livability +3.3/5.0
- Rent growth +2.7/5.0
- Condition / age +2.5/5.0
- Appreciation +0.0/10.0
$40,000
🖨 Deal sheet (PDF) 📄 Offer letter ✓ Due diligence
Listing remarks
Ready for your creative design aspirations! Remediated and partially renovated. Contractors ready to go to implement your dream kitchen! Capitalize on this opportunity and make this your Florida Winter, or Forever Home!
Key facts
- 5,707 sq ft lot
- Parking
- Built 1980
Property features AI
Finance
- Other: Property type: Residential — Manufactured Home; Lot roughly 0.13 acres (paved road); On waterfront designation (no water frontage or access reported)
- Financial info: Total monthly fees $175; total annual fees $2,100; Lease restrictions apply
- HOA & community: HOA required; monthly fee $175 (includes cable TV, internet, trash); Association approval required; Senior community; Pets allowed
Exterior
- Parking: Covered carport (1 space)
- Utilities: Public water; Public sewer; Electricity connected; Cable available; BB/HS internet available; Phone available; Sewer connected; Water connected
- Home design: Residential manufactured home (double wide); Single-story; Faces east; Listed as fixer condition
- Construction: Vinyl siding; Shingle roof; Crawlspace foundation
- Exterior features: Awnings
Interior
- Kitchen: No appliances reported
- Bedrooms: 2 bedrooms
- Flooring: Other flooring
- Bathrooms: 2 full bathrooms
- Heating & cooling: Central heating; Central air conditioning
- Interior features: No notable built-in interior features reported; Storage rooms
- Laundry & utility: Dedicated laundry room
Neighborhood map
What this means for you Summary
Snapshot
- This is a 2-bed/2.0-bath manufactured listed at $40k.
Deal economics
- At list price, monthly cash flow is $102 ($1k/yr) — positive.
- The deal already cash-flows at list — no discount required.
- Meets the 1% rule at list price ($1k rent vs $40k).
- Recommended offer: $38k (6.0% below list) — sets the bar for market timing.
- Cap rate 22.2% vs local median 2.7% in Beacon Square — top-decile yield for the area; either an underpriced asset or a hidden risk that comps aren't pricing in. Stress-test before assuming the spread holds.
Location & tenants
- Location reads 66/100 on livability (#600 in FL) — a middle-class / working-renter tenant base. Strengths: cost of living A+, housing A+, health & safety B; Watch: employment D, amenities F, commute F.
- Pasco (suburban): math 50% / reading 52% proficiency, ranked #32 of 73 in FL (top 44%) — acceptable for families but not a draw, mixed tenant base, ~2y average lease.
- Zoned schools: Mittye P. Locke Elementary School (math 35% / reading 39%, grade F, #1,609 of 2,144 statewide, top 77%, 491 students, 89% FRL); Paul R. Smith Middle School (math 32% / reading 38%, grade F, #416 of 571 statewide, top 74%, 994 students, 82% FRL); Anclote High School (math 28% / reading 38%, grade F, #406 of 667 statewide, top 61%, 1,205 students, 77% FRL) — zoned schools average 83% FRL vs 48% district-wide (34 pts higher); higher-poverty schools than district average — tighter screening recommended.
- Zoned-school proficiency averages 35% at this address vs 51% district-wide (-16 pts) — the specific schools serving this property underperform the Pasco average; the district grade overstates school quality for this exact location.
- Market conditions: Rents flat; 645 active listings in the ZIP; 40 comparable units currently listed for rent nearby; rentals at typical pace (median 21d on market — plan ~3-4 weeks tenant-placement turnaround); 6,765 units permitted in Pasco County in 2024 (1,250 in 5+ unit buildings).
Forward outlook
- Local home prices are declining (-3.0%/yr); year-one equity from $277 of loan paydown is wiped out by about $1k of value loss. Plan a longer hold.
- Pasco County population projected at +29% by 2050 — long-run rental-demand tailwind backs the buy-and-hold thesis.
Negotiation context
- It's been on market 82 days — a 6% lower offer ($38k) is reasonable based on typical stale-listing flexibility.
- 2 sale attempts since 2y ago with the ask held roughly flat each time — persistent listings suggest the price (not the market) is what's stuck; bring a comps-based counter.
- Current owner paid $25k; list at $40k implies a 60% gain — meaningful room to come down on a strong offer.
Risks & watch-outs
- Watch-outs: flood insurance adds $427/mo.
- Climate carrying-cost: in FEMA flood zone AE (mandatory federal flood insurance); severe wind risk, 99% chance of damaging wind over 30y; extreme-heat days projected 7→26/yr by 2055 (HVAC capex compounding) — expect insurance premiums to compound above CPI over the hold.
Questions for the listing agent
- It's been on market 82 days. Have you received any prior offers? Is the seller open to a 6% concession, seller financing, or rate buy-down credit?
- What's the actual annual flood-insurance premium (NFIP or private), and is the property in a SFHA with mandatory coverage?
- What does the HOA fee cover, when was the last increase, and are there any pending special assessments or reserve-fund shortfalls?
- Why hasn't it sold? Are there any deal-killer items the seller is aware of (foundation, flood, title, zoning, code violations)?
- Is there a deadline driving the sale (1031 exchange, divorce, estate, relocation)? That informs how much negotiation room exists.
- Schools are F-rated, which usually means shorter tenancies and higher turnover. Who's the typical renter profile here, and what's been the actual vacancy rate?
- What's the average days-on-market for RENTAL listings here right now (not sales)? A rising rental-DOM trend means longer vacancies and softer asking-rent achievability than the comps imply.
- What's the recent tenant-quality profile in this submarket — average credit score on applications, eviction rate, late-payment / NSF rate, and stable-employment percentage? A property-management company in the area should have these aggregated.
- How much new for-sale + rental construction is in the pipeline within 1–3 miles? Heavy new supply typically softens prices + rents 12–24 months out; constrained supply supports both.
Investment metrics
- 1% rule
- 3.19% ✓
- Cap rate
- 22.16%
- Cash-on-cash
- 56.66%
- DSCR
- 3.52
- GRM
- 2.6
CMA / ARV
No comps found within radius.
Projected returns pro-forma
-3.0% appreciation · 0.72% rent growth · sell at horizon
- IRR
- -6.2%
- Equity multiple
- 0.78×
- Total profit
- $-2,424
- Equity at exit
- $5,964
- IRR
- -6.3%
- Equity multiple
- 0.71×
- Total profit
- $-3,293
- Equity at exit
- $3,458
Cash invested: $11,200 (down + closing). Projections, not guarantees.
Landlord ↔ Tenant lean methodology
- Overall (STATE)
- 87 Strongly Landlord-Friendly
- State Florida
- 87 Strongly Landlord-Friendly · R+3
- County
- — inherits STATE
- City
- — inherits STATE
ZIP-level market 34652
- Home prices YoY
- -26.1%
- Rents YoY
- 0.7%
- Active inventory
- 645
- Price-to-rent
- 2.6×
Monthly cashflow live
- Estimated rent
- $1,276 high interval (Pro) →
- Mortgage (P&I)
- −$210
- Tax from tax record
- −$78 /mo · $933/yr
- Insurance
- −$17
- Flood insurance flood zone
- −$427 /mo · $5,118/yr
- HOA
- −$175
- Lot rent leased land?
- −$0
- Vacancy / Maint / Mgmt
- −$268
- Net cashflow
- $102
Break-even live
Sensitivity live
| Price | -10% $125 | -5% $114 | +0% $102 | +5% $91 | +10% $80 |
|---|---|---|---|---|---|
| Rent | -10% $1 | -5% $52 | +0% $102 | +5% $153 | +10% $203 |
| Rate | -1.0pp $122 | -0.5pp $112 | base $102 | +0.5pp $92 | +1.0pp $81 |
UW: 25.0% down · 7.5% · 30yr · 1.5% tax · 5.0% vac · 8.0% maint · 8.0% mgmt
Financing live
Cash to close
- Down payment
- $10,000
- Closing costs
- $1,200
- Reserves months
- —
- Total cash needed
- —
Loan-product check · same deal, 3 products live
Conventional
25% down · 7.5% · 30yr
- Down + closing
- —
- Monthly P&I
- —
- Monthly cashflow
- —
- DSCR
- —
- Eligible?
- —
Personal DTI + credit; lowest rate.
DSCR
20% down · 8.5% · 30yr
- Down + closing
- —
- Monthly P&I
- —
- Monthly cashflow
- —
- DSCR
- —
- Eligible?
- —
No personal income docs; deal must DSCR.
Hard money
10% down · 12.0% · 12mo
- Down + closing
- —
- Monthly P&I
- —
- Monthly cashflow
- —
- DSCR
- —
- Eligible?
- —
Short-term bridge; refi at stabilization.
Rent comps 40 comps
| Address | Beds | Baths | Sqft | Rent | $/sqft | DOM | Units | Dist |
|---|---|---|---|---|---|---|---|---|
| 4408 Rustic Dr New Port Richey, FL | 2.0 | 1.0 | 1101 | $1,500 | $1.36 | 27d | 1 | 0.22mi |
| 4221 Touchton Pl New Port Richey, FL | 2.0 | 2.0 | 888 | $1,300 | $1.46 | 26d | 1 | 0.25mi |
| 4411 Rustic Dr Unit 1 New Port Richey, FL | 2.0 | 2.0 | 1050 | $1,450 | $1.38 | 15d | 1 | 0.25mi |
| 4211 Stratford Dr Unit 4211 New Port Richey, FL | 2.0 | 2.0 | 1080 | $1,500 | $1.39 | 0d | 1 | 0.28mi |
| 4540 Irene Loop New Port Richey, FL | 2.0 | 1.0 | 768 | $1,550 | $2.02 | 27d | 1 | 0.33mi |
| 4645 Irene Loop New Port Richey, FL | 3.0 | 1.0 | 1158 | $1,700 | $1.47 | 2d | 1 | 0.35mi |
| 4022 Davit Dr New Port Richey, FL | 2.0 | 2.0 | 1144 | $1,600 | $1.40 | 20d | 1 | 0.36mi |
| 4721 Naftis Ln New Port Richey, FL | 3.0 | 2.0 | 1104 | $1,700 | $1.54 | 15d | 1 | 0.36mi |
| 4031 Davit Dr New Port Richey, FL | 2.0 | 2.0 | 1144 | $1,600 | $1.40 | 20d | 1 | 0.37mi |
| 4122 Hampton Dr New Port Richey, FL | 2.0 | 2.0 | 1050 | $1,795 | $1.71 | 1d | 1 | 0.38mi |
| 4616 Irene Loop New Port Richey, FL | 2.0 | 1.0 | 898 | $1,600 | $1.78 | 22d | 1 | 0.39mi |
| 4282 Rudder Way New Port Richey, FL | 3.0 | 2.0 | 1310 | $2,000 | $1.53 | 6d | 1 | 0.40mi |
| 4282 Rudder Way New Port Richey, FL | 3.0 | 2.0 | 1454 | $2,000 | $1.38 | 27d | 1 | 0.40mi |
| 4124 Flamingo Dr New Port Richey, FL | 3.0 | 1.0 | 744 | $1,500 | $2.02 | 17d | 1 | 0.45mi |
| 4124 Flamingo Dr New Port Richey, FL | 3.0 | 1.0 | 744 | $1,500 | $2.02 | 6d | 1 | 0.45mi |
| 4852 Pompano Dr New Port Richey, FL | 2.0 | 2.0 | 1104 | $2,900 | $2.63 | 27d | 1 | 0.49mi |
| 4301 Straits Ln New Port Richey, FL | 3.0 | 1.5 | 1284 | $1,790 | $1.39 | 27d | 1 | 0.51mi |
| 3847 Lighthouse Way New Port Richey, FL | 2.0 | 2.0 | 1144 | $1,595 | $1.39 | 24d | 1 | 0.54mi |
| 5020 Vickers Dr New Port Richey, FL | 2.0 | 1.0 | 863 | $1,495 | $1.73 | 2d | 1 | 0.59mi |
| 4133 Grayton Dr New Port Richey, FL | 2.0 | 1.5 | 1068 | $1,727 | $1.62 | 7d | 1 | 0.62mi |
| 4554 Nimmer Dr New Port Richey, FL | 3.0 | 2.0 | 1180 | $1,600 | $1.36 | 17d | 1 | 0.63mi |
| 4548 Belfast Dr New Port Richey, FL | 3.0 | 1.0 | 1075 | $1,575 | $1.47 | 20d | 1 | 0.67mi |
| 4939 Floramar Ter New Port Richey, FL | 2.0 | 2.0 | 1050 | $1,600 | $1.52 | 4d | 2 | 0.69mi |
| 4939 Floramar Ter New Port Richey, FL | 2.0 | 2.0 | 1050 | $1,675 | $1.60 | 27d | 2 | 0.69mi |
| 4939 Floramar Ter New Port Richey, FL | 2.0 | 2.0 | 1050 | $1,648 | $1.57 | 19d | 3 | 0.69mi |
| 4117 Highland Loop New Port Richey, FL | 3.0 | 2.0 | 1384 | $1,599 | $1.16 | 15d | 1 | 0.72mi |
| 4834 Salem Dr New Port Richey, FL | 2.0 | 1.0 | 864 | $1,400 | $1.62 | 1d | 1 | 0.74mi |
| 4436 Floramar Ter New Port Richey, FL | 2.0 | 1.5 | 890 | $2,295 | $2.58 | 7d | 1 | 0.77mi |
| 4430 Floramar Ter New Port Richey, FL | 2.0 | 1.5 | 1094 | $2,500 | $2.29 | 5d | 1 | 0.77mi |
| 4518 Audrey Ln Unit 4551 New Port Richey, FL | 2.0 | 1.0 | 750 | $1,295 | $1.73 | 24d | 1 | 0.77mi |
| 4529 Audrey Ln New Port Richey, FL | 2.0 | 1.0 | 750 | $1,295 | $1.73 | 24d | 1 | 0.78mi |
| 4551 Audrey Ln NEW PRT RCHY, FL | 2.0 | 1.0 | 750 | $1,295 | $1.73 | 24d | 1 | 0.80mi |
| 4540 Audrey Ln New Port Richey, FL | 2.0 | 1.0 | 750 | $1,150 | $1.53 | 27d | 1 | 0.80mi |
| 5197 Silent Loop #124 New Port Richey, FL | 2.0 | 2.0 | 956 | $2,200 | $2.30 | 27d | 1 | 0.83mi |
| 5197 Silent Loop New Port Richey, FL | 2.0 | 2.0 | 956 | $2,200 | $2.30 | 6d | 1 | 0.83mi |
| 4754 Marine Pkwy Unit 2 New Port Richey, FL | 3.0 | 2.0 | 1312 | $1,750 | $1.33 | 17d | 1 | 0.84mi |
| 4754 Marine Pkwy Unit 102-I New Port Richey, FL | 2.0 | 2.0 | 1088 | $1,500 | $1.38 | 27d | 1 | 0.84mi |
| 4854 Marine Pkwy #103 New Port Richey, FL | 1.0 | 2.0 | 1088 | $1,500 | $1.38 | 27d | 1 | 0.84mi |
| 5132 Amulet Dr #107 New Port Richey, FL | 1.0 | 1.0 | 928 | $1,395 | $1.50 | 15d | 1 | 0.84mi |
| 4747 Azalea Dr #208 New Port Richey, FL | 2.0 | 2.0 | 1128 | $1,200 | $1.06 | 20d | 1 | 0.85mi |
HOA detail
- Monthly dues
- $175 · $2,100/yr
Listing history 6 events
-
2026-05-13status Pending
-
2026-02-20$40,000 Active
-
2024-12-04status Pending
-
2024-12-03historical
-
2024-11-26$30,000 Active
-
2004-02-01soldstatus $25,000
ⓘ Source: listings_history table (triggers on properties + properties_extension) + one-shot
backfill from property_details.listing_events for pre-trigger history.
Tax reassessment forecast FL · Resets to sale price
- Current annual tax
- $933 · $78/mo
- Projected year-2 tax
- $933 · $78/mo
- Expected delta
- $0/yr ($0/mo · 0.0%)
ⓘ Screening estimate from a state-policy table — verify with the county assessor before closing.
Climate risk First Street
- Flood 10/10 Extreme FEMA zone AE · 99% chance over 30 yrs
- Wildfire 3/10 Moderate
- Heat 10/10 Extreme 7 d/yr ≥109°F today · 26 d/yr by 30 yrs out
- Wind 10/10 Extreme 99% chance of damaging wind over 30 yrs
- Air quality 2/10 Low 1 unhealthy d/yr today · 1 by 30 yrs out
Nearby sold comps map
Loading sold comps map…
Walkable amenities ~0.75 mi
Loading nearby amenities…
Taxation est. · year 1
- Rental income
- $15,311
- − Mortgage interest
- −$2,241
- − Property taxes
- −$933
- − Insurance
- −$5,318
- − Repairs & maintenance
- −$1,225
- − Management
- −$1,225
- − HOA
- −$2,100
- − Depreciation
- −$1,164
- Taxable income
- $1,106
- Est. tax owed @ 24.0%
- −$265
- After-tax cash flow
- $962/yr
For passive investors: Depreciation is non-cash, so a rental often shows a tax loss while cash-flowing — sheltering income. Rental losses are passive: they offset passive income freely, and up to $25,000/yr can offset ordinary (W-2) income if you actively participate and your MAGI is under $100k (phasing out to $0 by $150k); unused losses carry forward. On sale, claimed depreciation is recaptured at up to 25%, and gains may owe capital-gains tax (a 1031 exchange can defer both). Figures are a year-1 estimate at your 24.0% rate — not tax advice; consult a CPA.
Schools (NCES district)
- District
- Pasco
- NCES district ID
- 1201530
- Math proficiency
- 50% ▼ -10.00%
- Reading proficiency
- 52% ▼ -5.00%
- Median HH income
- $45,039
- Composite
- 43.14/100
- National rank
- #3074
- State rank
- #32 of 73 in FL
Livability — Beacon Square
- Score
- 66/100
- State rank
- #600
- US rank
- #11494
Category grades
Schools grade is shown separately in the Schools card above.
Census & demographics
- Census place
- Beacon Square, FL
- County
- Pasco County · 524,098 people
- Metro
- Tampa-St. Petersburg-Clearwater, FL
- Population (ZIP)
- 27,444
- Household income
- $56,931
- Rent vs Own
- Severe rent burden
- 1190.0
Population outlook (Pasco County) Hauer SSP2
- Today (2025)
- 570,045 people
- By 2030
- 605,844 · +6.3%
- By 2040
- 674,806 · +18.4%
- By 2050
- 736,022 · +29.1%
- By 2075
- 862,900 · +51.4%
- By 2100
- 906,364 · +59.0%
Race, ethnicity, and origin ACS 2023
- Neighborhood character
- Predominantly White (78%)
- Race & ethnicity
- White 78% Hispanic / Latino 13% Two or more races 9% Black 4%
- Hispanic origin (detail)
- Mexican 3% Puerto Rican 4% Cuban 4%
- Common ancestry
- Romanian 4% Lithuanian 3% Slovak 2%
- Foreign-born
- 9% · Canada
- Languages at home
- 87% English-only · Spanish 9% Other Indo-European 1% Russian/Polish/Slavic 1%
Political lean MEDSL · Pasco
- 2024 margin
- Strong R (+25.2) · D 36.9% · R 62.1% · Other 1.0%
- 2008→2024 swing
- -21.6pp toward R · 2008: -3.6pp · 2024: -25.2pp
- All cycles
- 2024: R+25.2 2020: R+20.1 2016: R+21.6 2012: R+6.7 2008: R+3.6
Not yet ingested
- Civics
- —
Market trends
- HPI YoY
- ▼ -109.49%
- Current HPI
- 310.8347
- Rent YoY
- ▲ 0.72%
- Metro
- Tampa-St. Petersburg-Clearwater, FL
- State GDP YoY
- ▲ 3.28%
- F500 in state
- 36
Industry mix (Fortune 500 HQ in FL)
| Industry | F500 HQs | Revenue |
|---|---|---|
| Industrial Technology | 2 | $29B |
|
||
| Insurance | 2 | $17B |
|
||
| Retail | 1 | $60B |
|
||
| Technology Distribution | 1 | $58B |
|
||
| Homebuilding | 1 | $35B |
|
||
| Technology Manufacturing | 1 | $35B |
|
||
Price history
+60.0% since first listed6 events — show timeline
- 2026-05-13 Pending — Stellar MLS as Distributed by MLS Grid
- 2026-02-20 Listed $40,000 Stellar MLS as Distributed by MLS Grid
- 2024-12-04 Pending — Stellar MLS as Distributed by MLS Grid
- 2024-12-03 Listing Removed — Stellar MLS as Distributed by MLS Grid
- 2024-11-26 Listed $30,000 Stellar MLS as Distributed by MLS Grid
- 2004-02-01 Sold (Public Records) $25,000 Public Records
Property tax history
+15.6%/yrLatest (2025): $933 · -38.8% YoY. Source: county tax records.
Cash-flow waterfall
monthlySold comps — $/sqft
last 12 mo · ≤1 miLoading sold comps…