 🏷️ Likely Rental
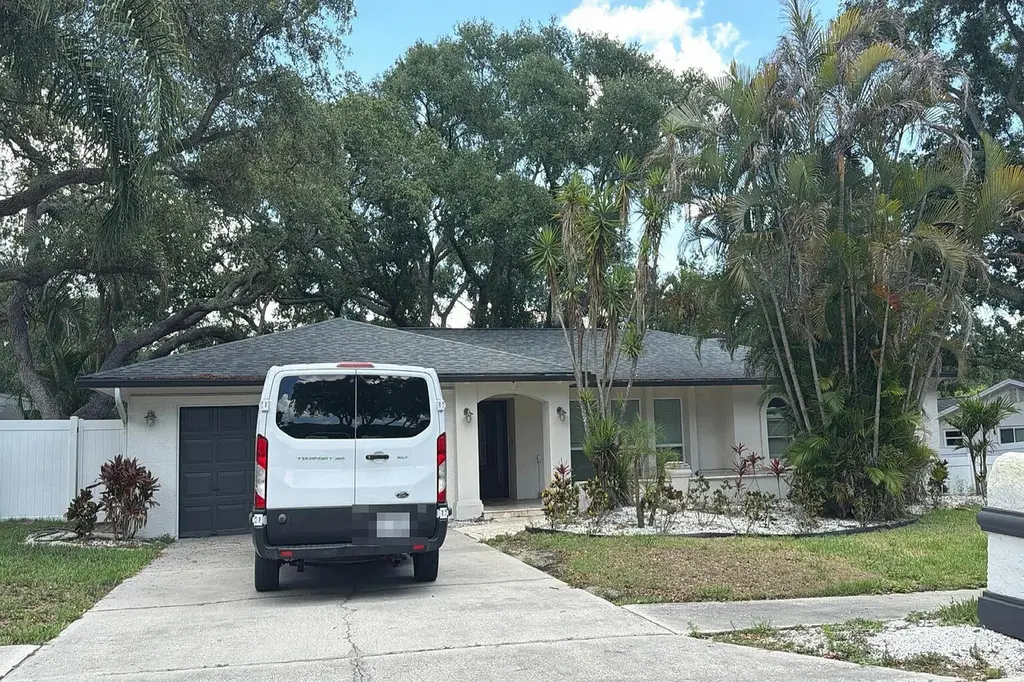
904 High View Dr · Palm Harbor, FL
Flood risk 1/10 · Minimal
- FEMA flood zone
- X (unshaded)
- Chance of flooding over 30 yrs
- 0.0%
- Est. flood insurance / yr
- $507 – $1,088
Fire risk 1/10 · Minimal
- Est. fire insurance / yr
- $947 – $1,759
Heat risk 10/10 · Severe
- Hot days now (above 107°F)
- 7 days/yr
- Hot days in 30 yrs
- 26 days/yr
Wind risk 10/10 · Severe
- Chance of severe wind over 30 yrs
- 99.0%
Air-quality risk 3/10 · Minor
- Unhealthy air days now
- 3 days/yr
- Unhealthy air days in 30 yrs
- 3 days/yr
Risk factors via First Street. Map © Google.
Why this score? — see what drove the D grade
The composite is a weighted blend of 9 inputs, each scored 0–100. Each bar is that input's sub-score; the figure is the points it added to the 100-point composite (weight × sub-score).
- Cash flow +15.0/30.0
- ARV discount +7.5/15.0
- 1% rule +5.0/10.0
- DSCR +5.0/10.0
- Schools +4.3/10.0
- Livability +4.0/5.0
- Condition / age +2.5/5.0
- Rent growth +1.4/5.0
- Appreciation +0.0/10.0
$5,000
🖨 Deal sheet 📄 Offer letter ✓ Due diligence
Listing remarks MLS
You'll fall in love with this creatively crafted home that has been recently remodeled to encompass all of the elements for relaxation, comfort, and easy-living. It is a quintessential Palm Harbor paradise! The 4 bedroom 2 bathroom home has been meticulously designed with unique features, mindful updates, and provides plenty of living and storage space. As you step through the front door you are greeted by a welcoming foyer and grand dining room with oversized windows to allow natural light to pour in. The kitchen and dry bar sparkle with level 6 granite, clean, bright cabinetry, and Samsung appliance package. Perfectly placed within the home to provide quick access to the living room and quick passthrough to the breakfast nook. Your master ensuite is a retreat within itself Featuring a large bedroom with abundant natural light, an amazing walk-in closet/dressing room, a spa-like master bathroom with a walk-in shower and spacious separate vanities. The three additional bedrooms are of ample size and thoughtfully placed throughout the home to provide privacy and functionality. The outdoor living space is the cherry on top! French doors throughout the home provide entry to your secluded screened-in lanai, large enough for an outdoor dining table. There is a cozy corner with an outdoor fireplace and wet bar to wind down after a long day. The backyard features a detached, air conditioned studio which provides endless possibilities and the side yard has a bricked patio that would be the perfect area for a grillmaster's set-up. The home has newly landscaped front & back yard, new roof 2021, AC 2017, and 55 gallon water heater replaced in 2020. The home boasts a spacious indoor laundry room with additional refrigerator, a walk-in pantry, 2 car garage, vinyl fencing, fresh interior and exterior paint, and gorgeous travertine tile flooring. Conveniently located near the Pinellas Trail, Honeymoon Island State Park, easy access to shopping, dining, and Tampa International Airport, and zoned for top-rated schools. Attention to detail is unmatched in this enchanting Palm Harbor home. It is truly a MUST-SEE!
Key facts
- 9,583 sq ft lot
- Built 1977
- Listed 7 days
Property features AI
Finance
- Other: Lot is less than 1/4 acre (approximately 0.22 acre); Deed restrictions: none; Pets: other (see remarks)
- Financial info: Property listed as auction
- HOA & community: No association fee; Association does not have first right of refusal; Association fee covers other items
Exterior
- Utilities: Utilities: other (see remarks)
- Home design: Single building (1 unit); Built in 1977; Other zoning; Located on Bay/Gulf side
- Construction: Other construction; Not built above flood
- Exterior features: No waterfront; No waterview; Dockage: other
Interior
- Bedrooms: 4 bedrooms
- Bathrooms: 2 full bathrooms
- Interior features: Other appliances (see remarks)
Neighborhood map
What this means for you Summary
Snapshot
- This is a 4-bed/2.5-bath single-family listed at $5k.
Deal economics
- At list price, monthly cash flow is $3k ($36k/yr) — positive.
- The deal already cash-flows at list — no discount required.
- Meets the 1% rule at list price ($4k rent vs $5k).
- Cap rate 730.4% vs local median 3.1% in Palm Harbor — top-decile yield for the area; either an underpriced asset or a hidden risk that comps aren't pricing in. Stress-test before assuming the spread holds.
Location & tenants
- Location reads 81/100 on livability (#95 in FL, #1,470 nationally) — a professional / high-income tenant draw. Strengths: schools A+, housing A+, commute A; Watch: amenities F.
- Pinellas (suburban): math 51% / reading 51% proficiency, ranked #31 of 73 in FL (top 42%) — acceptable for families but not a draw, mixed tenant base, ~2y average lease.
- Market conditions: Rents falling (-4.3%/yr); 387 active listings in the ZIP; 9 comparable units currently listed for rent nearby; rentals at typical pace (median 22d on market — plan ~3-4 weeks tenant-placement turnaround); solid renter incomes; 2,676 units permitted in Pinellas County in 2024 (1,422 in 5+ unit buildings).
- At $3,863/mo this rent would consume 50% of the median local household income ($93k/yr) (locally 919% of renters already pay >50% of income on rent) — very limited rent-growth headroom before tenants either downsize or default.
Forward outlook
- Local home prices are declining (-3.0%/yr); year-one equity from $35 of loan paydown is wiped out by about $150 of value loss. Plan a longer hold.
- Pinellas County population projected at +14% by 2050 — modest demand growth; plan on rents tracking national, not racing it.
- At projected returns (-3.0% appreciation + 0.0% rent growth), your $1k cash investment doubles in ~1 year — after that, you're playing with house money.
Negotiation context
- Only 8 days on market — expect competitive offers; lowballing is unlikely to land.
- 7 sale attempts since 10y ago with the ask held roughly flat each time — persistent listings suggest the price (not the market) is what's stuck; bring a comps-based counter.
Risks & watch-outs
- Climate carrying-cost: severe wind risk, 99% chance of damaging wind over 30y; extreme-heat days projected 7→26/yr by 2055 (HVAC capex compounding) — expect insurance premiums to compound above CPI over the hold.
Questions for the listing agent
- Built in 1977 — when were the roof, HVAC, electrical panel, plumbing, and water heater last replaced?
- Is there a deadline driving the sale (1031 exchange, divorce, estate, relocation)? That informs how much negotiation room exists.
- Schools are A-rated — typically a magnet for longer-tenancy family renters. What's the average tenant stay here, and is there a school-zone premium baked into asking?
- The area grade is low — what's the realistic commute time and amenity access for the typical tenant pool here? Any planned neighborhood developments (good or bad) we should know about?
- What's the average days-on-market for RENTAL listings here right now (not sales)? A rising rental-DOM trend means longer vacancies and softer asking-rent achievability than the comps imply.
- What's the recent tenant-quality profile in this submarket — average credit score on applications, eviction rate, late-payment / NSF rate, and stable-employment percentage? A property-management company in the area should have these aggregated.
- How much new for-sale + rental construction is in the pipeline within 1–3 miles? Heavy new supply typically softens prices + rents 12–24 months out; constrained supply supports both.
Investment metrics
- 1% rule
- 77.26% ✓
- Cap rate
- 730.40%
- Cash-on-cash
- 2586.10%
- DSCR
- 116.07
- GRM
- 0.1
CMA / ARV
- ARV (on-the-fly)
- $768,544
- Comps found
- 12
Show comp detail 12 sales within ~0.75 mi
| Address | Dist | Beds/Ba | Sqft | Sold | Price | $/sf | Match |
|---|---|---|---|---|---|---|---|
| 1796 Painted Bunting Cir | 0.12mi | 4/3.0 | 2,358 (+1%) | 0mo | $828,000 | $351 | 90 |
| 927 Whippoorwill Dr | 0.19mi | 4/2.5 | 2,312 (-1%) | 1mo | $565,000 | $244 | 89 |
| 774 Tomoka Dr | 0.32mi | 4/2.0 | 2,307 (-1%) | 6mo | $750,000 | $325 | 76 |
| 1748 Hermit Thrush Cir | 0.51mi | 4/2.0 | 2,301 (-2%) | 0mo | $780,000 | $339 | 72 |
| 469 Pine Warbler Way N | 0.58mi | 4/3.0 | 2,366 (+1%) | 2mo | $750,000 | $317 | 67 |
| 537 Belted Kingfisher Dr N | 0.51mi | 3/2.0 (-1) | 2,205 (-6%) | 1mo | $670,000 | $304 | 59 |
| 695 House Wren Cir | 0.28mi | 3/2.0 (-1) | 2,075 (-11%) | 5mo | $740,000 | $357 | 57 |
| 2803 Jarvis Cir | 0.62mi | 5/3.0 (+1) | 2,398 (+3%) | 4mo | $821,000 | $342 | 56 |
| 2831 Jarvis Cir | 0.66mi | 3/3.0 (-1) | 2,221 (-5%) | 3mo | $605,000 | $272 | 51 |
| 1967 Castille Dr | 0.47mi | 4/2.0 | 2,010 (-14%) | 2mo | $525,000 | $261 | 51 |
| 1848 Barn Owl Way | 0.61mi | 4/3.0 | 2,614 (+12%) | 1mo | $859,600 | $329 | 49 |
| 2021 Spanish Pines Dr | 0.59mi | 3/2.0 (-1) | 2,092 (-10%) | 4mo | $850,000 | $406 | 45 |
Match score weights: distance 35% · size 25% · config 20% · recency 20%. Top-matched comps best support the ARV.
Projected returns pro-forma
-3.0% appreciation · 0.0% rent growth · sell at horizon
- IRR
- —
- Equity multiple
- 129.64×
- Total profit
- $180,089
- Equity at exit
- $746
- IRR
- —
- Equity multiple
- 258.67×
- Total profit
- $360,744
- Equity at exit
- $432
Cash invested: $1,400 (down + closing). Projections, not guarantees.
Landlord ↔ Tenant lean methodology
- Overall (STATE)
- 87 Strongly Landlord-Friendly
- State Florida
- 87 Strongly Landlord-Friendly · R+3
- County
- — inherits STATE
- City
- — inherits STATE
ZIP-level market 34683
- Rents YoY
- -4.3%
- Active inventory
- 387
- Price-to-rent
- 0.1×
Monthly cashflow live
- Estimated rent
- $3,863 high interval (Pro) →
- Mortgage (P&I)
- −$26
- Tax est. 1.5%
- −$6 /mo · $75/yr
- Insurance
- −$2
- HOA
- −$0
- Vacancy / Maint / Mgmt
- −$811
- Net cashflow
- $3,017
Break-even live
UW: 25.0% down · 7.5% · 30yr · 1.5% tax · 5.0% vac · 8.0% maint · 8.0% mgmt
Financing live
Cash to close
- Down payment
- $1,250
- Closing costs
- $150
- Reserves months
- —
- Total cash needed
- —
Loan-product check · same deal, 3 products live
Conventional
25% down · 7.5% · 30yr
- Down + closing
- —
- Monthly P&I
- —
- Monthly cashflow
- —
- DSCR
- —
- Eligible?
- —
Personal DTI + credit; lowest rate.
DSCR
20% down · 8.5% · 30yr
- Down + closing
- —
- Monthly P&I
- —
- Monthly cashflow
- —
- DSCR
- —
- Eligible?
- —
No personal income docs; deal must DSCR.
Hard money
10% down · 12.0% · 12mo
- Down + closing
- —
- Monthly P&I
- —
- Monthly cashflow
- —
- DSCR
- —
- Eligible?
- —
Short-term bridge; refi at stabilization.
Rent comps 9 comps
| Address | Beds | Baths | Sqft | Rent | $/sqft | DOM | Units | Dist |
|---|---|---|---|---|---|---|---|---|
| 2204 Elizabeth Way Dunedin, FL | 4.0 | 3.0 | 2800 | $3,900 | $1.39 | 24d | 1 | 0.65mi |
| 2204 Elizabeth Way Dunedin, FL | 4.0 | 3.0 | 2532 | $3,750 | $1.48 | 22d | 1 | 0.65mi |
| 2379 Azalea Dr Palm Harbor, FL | 3.0 | 2.0 | 2035 | $3,700 | $1.82 | 22d | 1 | 0.65mi |
| 2424 Summerwood Ct Dunedin, FL | 4.0 | 3.5 | 2469 | $7,900 | $3.20 | 24d | 1 | 1.07mi |
| 1480 Chukar Rdg Palm Harbor, FL | 3.0 | 2.0 | 1998 | $3,595 | $1.80 | 24d | 1 | 1.11mi |
| 161 Overstreet Ct Palm Harbor, FL | 3.0 | 2.0 | 1799 | $1,300 | $0.72 | 7d | 1 | 1.12mi |
| 3139 Carlos Dr Dunedin, FL | 4.0 | 2.0 | 2414 | $3,400 | $1.41 | 4d | 1 | 1.29mi |
| 3775 Springhill Cir Palm Harbor, FL | 4.0 | 2.0 | 1682 | $5,000 | $2.97 | 4d | 1 | 1.36mi |
| 4907 Parson Brown Ln Palm Harbor, FL | 3.0 | 2.0 | 1947 | $4,500 | $2.31 | 4d | 1 | 1.37mi |
Listing history 7 events
-
2026-06-09days on market $5,000 Active 8 DOM
-
2026-06-08days on market $5,000 Active 7 DOM
-
2026-06-07days on market $5,000 Active 6 DOM
-
2026-06-04days on market $5,000 Active 3 DOM
-
2026-06-03days on market $5,000 Active 2 DOM
-
2026-06-02remarks 299-char remark
-
2026-06-02$5,000 Active 1 DOM
ⓘ Source: listings_history table (triggers on properties + properties_extension) + one-shot
backfill from property_details.listing_events for pre-trigger history.
Climate risk First Street
- Flood 1/10 Low FEMA zone X (unshaded) · 0% chance over 30 yrs
- Wildfire 1/10 Low
- Heat 10/10 Extreme 7 d/yr ≥107°F today · 26 d/yr by 30 yrs out
- Wind 10/10 Extreme 99% chance of damaging wind over 30 yrs
- Air quality 3/10 Moderate 3 unhealthy d/yr today · 3 by 30 yrs out
Nearby sold comps map
Loading sold comps map…
Walkable amenities ~0.75 mi
Loading nearby amenities…
Taxation est. · year 1
- Rental income
- $46,354
- − Mortgage interest
- −$280
- − Property taxes
- −$75
- − Insurance
- −$25
- − Repairs & maintenance
- −$3,708
- − Management
- −$3,708
- − Depreciation
- −$145
- Taxable income
- $38,412
- Est. tax owed @ 24.0%
- −$9,219
- After-tax cash flow
- $26,986/yr
For passive investors: Depreciation is non-cash, so a rental often shows a tax loss while cash-flowing — sheltering income. Rental losses are passive: they offset passive income freely, and up to $25,000/yr can offset ordinary (W-2) income if you actively participate and your MAGI is under $100k (phasing out to $0 by $150k); unused losses carry forward. On sale, claimed depreciation is recaptured at up to 25%, and gains may owe capital-gains tax (a 1031 exchange can defer both). Figures are a year-1 estimate at your 24.0% rate — not tax advice; consult a CPA.
Schools (NCES district)
- District
- Pinellas
- NCES district ID
- 1201560
- Math proficiency
- 51% ▼ -5.00%
- Reading proficiency
- 51% ▼ -3.00%
- Median HH income
- $46,270
- Composite
- 43.27/100
- National rank
- #3046
- State rank
- #31 of 73 in FL
Livability — Palm Harbor
- Score
- 81/100
- State rank
- #95
- US rank
- #1470
Category grades
Schools grade is shown separately in the Schools card above.
Census & demographics
- Census place
- Palm Harbor, FL
- County
- Pinellas County · 939,478 people
- City population
- 79,072
- Metro
- Tampa-St. Petersburg-Clearwater, FL
- Population (ZIP)
- 33,911
- Household income
- $92,885
- Rent vs Own
- Severe rent burden
- 919.0
Population outlook (Pinellas County) Hauer SSP2
- Today (2025)
- 1,027,532 people
- By 2030
- 1,063,586 · +3.5%
- By 2040
- 1,125,020 · +9.5%
- By 2050
- 1,168,637 · +13.7%
- By 2075
- 1,265,188 · +23.1%
- By 2100
- 1,260,357 · +22.7%
Race, ethnicity, and origin ACS 2023
- Neighborhood character
- Predominantly White (85%)
- Race & ethnicity
- White 85% Hispanic / Latino 8% Two or more races 7% Asian 2% Black 1%
- Hispanic origin (detail)
- Mexican 2% Puerto Rican 2% Cuban 1%
- Common ancestry
- Romanian 5% Lithuanian 2% Slovak 2%
- Foreign-born
- 14% · Canada, China, Dominican Republic
- Languages at home
- 83% English-only · Spanish 5% Arabic 4% Russian/Polish/Slavic 3%
Political lean MEDSL · Pinellas
- 2024 margin
- Lean R (+5.2) · D 46.9% · R 52.1%
- 2008→2024 swing
- -13.5pp toward R · 2008: 8.3pp · 2024: -5.2pp
- All cycles
- 2024: R+5.2 2020: D+0.2 2016: R+1.1 2012: D+5.6 2008: D+8.3
Not yet ingested
- Civics
- —
Market trends
- HPI YoY
- ▼ -295.95%
- Current HPI
- 314.8777
- Rent YoY
- ▼ -4.33%
- Metro
- Tampa-St. Petersburg-Clearwater, FL
- State GDP YoY
- ▲ 3.28%
- F500 in state
- 36
Industry mix (Fortune 500 HQ in FL)
| Industry | F500 HQs | Revenue |
|---|---|---|
| Industrial Technology | 2 | $29B |
|
||
| Insurance | 2 | $17B |
|
||
| Retail | 1 | $60B |
|
||
| Technology Distribution | 1 | $58B |
|
||
| Homebuilding | 1 | $35B |
|
||
| Technology Manufacturing | 1 | $35B |
|
||
Price history
-94.2% since first listed25 events — show timeline
- 2026-06-01 Listed $5,000 FLKMLS
- 2022-12-31 Listing Removed — Stellar MLS as Distributed by MLS Grid
- 2022-12-10 Price Changed $685,000 Stellar MLS as Distributed by MLS Grid
- 2022-08-25 Price Changed $700,000 Stellar MLS as Distributed by MLS Grid
- 2022-08-09 Price Changed $729,000 Stellar MLS as Distributed by MLS Grid
- 2022-07-22 Listed $735,000 Stellar MLS as Distributed by MLS Grid
- 2021-07-21 Sold (MLS) $538,000 Stellar MLS as Distributed by MLS Grid
- 2021-06-11 Pending — Stellar MLS as Distributed by MLS Grid
- 2021-06-03 Listed $535,000 Stellar MLS as Distributed by MLS Grid
- 2019-01-04 Sold (Public Records) $398,700 Public Records
- 2018-12-31 Sold (MLS) $398,700 Stellar MLS as Distributed by MLS Grid
- 2018-11-14 Pending — Stellar MLS as Distributed by MLS Grid
- 2018-11-05 Listed $414,900 Stellar MLS as Distributed by MLS Grid
- 2017-04-24 Pending — Stellar MLS as Distributed by MLS Grid
- 2017-04-23 Listing Removed — Stellar MLS as Distributed by MLS Grid
- 2017-04-17 Relisted — Stellar MLS as Distributed by MLS Grid
- 2017-04-10 Pending — Stellar MLS as Distributed by MLS Grid
- 2017-04-05 Price Changed $367,000 Stellar MLS as Distributed by MLS Grid
- 2017-02-21 Relisted — Stellar MLS as Distributed by MLS Grid
- 2017-01-03 Pending — Stellar MLS as Distributed by MLS Grid
- 2017-01-03 Listing Removed — Stellar MLS as Distributed by MLS Grid
- 2016-12-24 Listed $369,900 Stellar MLS as Distributed by MLS Grid
- 1994-05-20 Sold (Public Records) $92,500 Public Records
- 1990-07-10 Sold (Public Records) $103,000 Public Records
- 1984-11-01 Sold (Public Records) $86,900 Public Records
Property tax history
+9.8%/yrLatest (2025): $8,973 · +2.4% YoY. Source: county tax records.
Cash-flow waterfall
monthlySold comps — $/sqft
last 12 mo · ≤1 miLoading sold comps…