 🏷️ Likely Rental
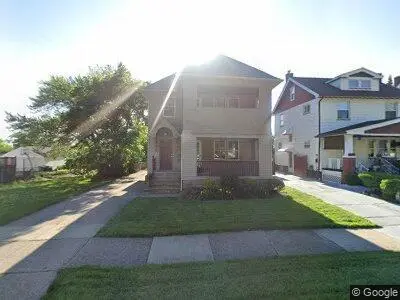
4748 E 90th St · Garfield Heights, OH
Flood risk 1/10 · Minimal
- FEMA flood zone
- X (unshaded)
- Chance of flooding over 30 yrs
- 0.0%
- Est. flood insurance / yr
- $473 – $860
Fire risk 1/10 · Minimal
- Est. fire insurance / yr
- $713 – $1,323
Heat risk 3/10 · Minor
- Hot days now (above 96°F)
- 7 days/yr
- Hot days in 30 yrs
- 17 days/yr
Wind risk 1/10 · Minimal
- Chance of severe wind over 30 yrs
- —
Air-quality risk 3/10 · Minor
- Unhealthy air days now
- 2 days/yr
- Unhealthy air days in 30 yrs
- 3 days/yr
Risk factors via First Street. Map © Google.
Why this score? — see what drove the B+ grade
The composite is a weighted blend of 9 inputs, each scored 0–100. Each bar is that input's sub-score; the figure is the points it added to the 100-point composite (weight × sub-score).
- Cash flow +30.0/30.0
- ARV discount +15.0/15.0
- 1% rule +10.0/10.0
- DSCR +10.0/10.0
- Rent growth +3.7/5.0
- Livability +3.4/5.0
- Condition / age +2.5/5.0
- Schools +1.3/10.0
- Appreciation +0.0/10.0
$134,900
🖨 Deal sheet 📄 Offer letter ✓ Due diligence
Multi-family units
County records classify this as Multi-Family (2-4 Unit). Listing-text estimate: 2 units. confirmed
Listing remarks
2 Family Home, 2 Bedrooms each suite, Kitchen, Dining Room w/ Built Ins, 2 Car Garage, Both suites rented, $1900/month cash flow
Key facts
- Built 1962
- Listed 21 days
Neighborhood map
What this means for you Summary
Snapshot
- This is a 2 × 2-bed/1.0-bath units multifamily listed at $135k.
Deal economics
- At list price, monthly cash flow is $1k ($13k/yr) — positive. Per door: $528/mo.
- The deal already cash-flows at list — no discount required.
- Meets the 1% rule at list price ($3k rent vs $135k).
- Recommended offer: $133k (1.5% below list) — sets the bar for market timing.
- Cap rate 15.7% vs local median 6.8% in Garfield Heights — top-decile yield for the area; either an underpriced asset or a hidden risk that comps aren't pricing in. Stress-test before assuming the spread holds.
Location & tenants
- Location reads 67/100 on livability (#593 in OH) — a middle-class / working-renter tenant base. Strengths: cost of living A+, housing A+, health & safety A; Watch: schools C-, crime D-, amenities F.
- Garfield Heights City Schools (suburban): math 8% / reading 22% proficiency, ranked #643 of 656 in OH (top 98%) — low school quality limits family demand, transient renter base, plan for 1-2y turnover; 64% free/reduced lunch — lower-income household profile, screen leases tightly.
- Market conditions: Rents rising fast (+4.8%/yr); 120 active listings in the ZIP; 4 comparable units currently listed for rent nearby; rentals at typical pace (median 21d on market — plan ~3-4 weeks tenant-placement turnaround); 1,441 units permitted in Cuyahoga County in 2024 (700 in 5+ unit buildings).
- At $2,726/mo this rent would consume 57% of the median local household income ($57k/yr) (locally 1738% of renters already pay >50% of income on rent) — very limited rent-growth headroom before tenants either downsize or default.
Forward outlook
- Local home prices are declining (-3.0%/yr); year-one equity from $933 of loan paydown is wiped out by about $4k of value loss. Plan a longer hold.
- Cuyahoga County population projected to shrink 8% by 2050 — rents likely to lag national; underwrite the cash flow, not the appreciation.
- At projected returns (-3.0% appreciation + 4.8% rent growth), your $38k cash investment doubles in ~4 years — after that, you're playing with house money.
Negotiation context
- It's been on market 21 days — a 2% lower offer ($133k) is reasonable based on typical stale-listing flexibility.
- 2 sale attempts since 28y ago with the ask held roughly flat each time — persistent listings suggest the price (not the market) is what's stuck; bring a comps-based counter.
- Current owner paid $68k; list at $135k implies a 98% gain — meaningful room to come down on a strong offer.
Risks & watch-outs
- Watch-outs: property tax is 3.0% of price.
Questions for the listing agent
- Can we see the unit-by-unit rent roll, current vacancy, and any below-market leases? What's the average tenancy length?
- What capital expenditures (roof, boiler, parking lot, exteriors) have been made in the last 5 years, and what's planned in the next 2?
- Built in 1962 — when were the roof, HVAC, electrical panel, plumbing, and water heater last replaced?
- Property tax is high relative to price — has the assessment been appealed recently, and will the sale trigger a re-assessment?
- Is there a deadline driving the sale (1031 exchange, divorce, estate, relocation)? That informs how much negotiation room exists.
- Crime grade is D in this area — have there been break-ins, vandalism, or insurance claims at this property in the last 3 years? What carrier currently insures it and at what premium?
- What's the average days-on-market for RENTAL listings here right now (not sales)? A rising rental-DOM trend means longer vacancies and softer asking-rent achievability than the comps imply.
- What's the recent tenant-quality profile in this submarket — average credit score on applications, eviction rate, late-payment / NSF rate, and stable-employment percentage? A property-management company in the area should have these aggregated.
- How much new apartment / multifamily construction is in the pipeline within 1–3 miles? Heavy new supply (>2% of stock underway) typically softens rents 12–24 months out; light construction supports rent growth.
Investment metrics
- 1% rule
- 2.02% ✓
- Cap rate
- 15.68%
- Cash-on-cash
- 33.54%
- DSCR
- 2.49
- GRM
- 4.1
CMA / ARV
- ARV (on-the-fly)
- $173,376
- Comps found
- 12
Show comp detail 12 sales within ~0.75 mi
| Address | Dist | Beds/Ba | Sqft | Sold | Price | $/sf | Match |
|---|---|---|---|---|---|---|---|
| 4666 E 86th St | 0.19mi | 4/2.0 | 2,016 (-2%) | 4mo | $195,000 | $97 | 84 |
| 4830 E 88th St | 0.17mi | 4/2.0 | 2,160 (+5%) | 5mo | $165,000 | $76 | 80 |
| 9309 Garfield Blvd | 0.12mi | 5/2.0 (+1) | 2,098 (+2%) | 11mo | $200,000 | $95 | 78 |
| 4917 E 85th St | 0.35mi | 4/2.0 | 2,032 (-2%) | 12mo | $151,000 | $74 | 71 |
| 8200 Garfield Blvd | 0.33mi | 4/2.0 | 2,200 (+7%) | 4mo | $159,000 | $72 | 71 |
| 4933 E 106th St | 0.65mi | 4/2.0 | 2,053 (-0%) | 4mo | $185,000 | $90 | 65 |
| 4646 E 86th St | 0.22mi | 5/2.0 (+1) | 1,872 (-9%) | 6mo | $180,000 | $96 | 64 |
| 10118 Russell Ave | 0.49mi | 4/2.0 | 1,914 (-7%) | 4mo | $195,000 | $102 | 62 |
| 10109 Richland Ave | 0.48mi | 4/2.0 | 2,144 (+4%) | 13mo | $180,000 | $84 | 60 |
| 10403 Russell Ave | 0.56mi | 4/2.0 | 1,946 (-6%) | 7mo | $125,000 | $64 | 58 |
| 9817 Parkview Ave | 0.40mi | 4/2.0 | 1,901 (-8%) | 12mo | $143,000 | $75 | 58 |
| 10012 Greenview Ave | 0.45mi | 4/2.0 | 1,850 (-10%) | 10mo | $115,000 | $62 | 54 |
Match score weights: distance 35% · size 25% · config 20% · recency 20%. Top-matched comps best support the ARV.
Projected returns pro-forma
-3.0% appreciation · 4.8% rent growth · sell at horizon
- IRR
- 31.1%
- Equity multiple
- 2.34×
- Total profit
- $50,552
- Equity at exit
- $20,114
- IRR
- 39.3%
- Equity multiple
- 5.04×
- Total profit
- $152,582
- Equity at exit
- $11,664
Cash invested: $37,772 (down + closing). Projections, not guarantees.
Landlord ↔ Tenant lean methodology
- Overall (STATE)
- 73 Landlord-Friendly
- State Ohio
- 73 Landlord-Friendly · R+6
- County
- — inherits STATE
- City
- — inherits STATE
ZIP-level market 44125
- Rents YoY
- 4.8%
- Active inventory
- 120
- Price-to-rent
- 8.2×
Monthly cashflow live
- Estimated rent
- $2,726 high interval (Pro) →
- Mortgage (P&I)
- −$707
- Tax from tax record
- −$334 /mo · $4,009/yr
- Insurance
- −$56
- HOA
- −$0
- Vacancy / Maint / Mgmt
- −$572
- Net cashflow
- $1,056
Break-even live
2-unit breakdown (identical units grouped — click to expand)
| Units | Beds | Baths | Est. rent |
|---|---|---|---|
| 2× units | 2 | 1 | $2,726 |
| #1 | 2 | 1 | $1,363 |
| #2 | 2 | 1 | $1,363 |
| Total (2 units) | $2,726 | ||
UW: 25.0% down · 7.5% · 30yr · 1.5% tax · 5.0% vac · 8.0% maint · 8.0% mgmt
Financing live
Cash to close
- Down payment
- $33,725
- Closing costs
- $4,047
- Reserves months
- —
- Total cash needed
- —
Loan-product check · same deal, 3 products live
Conventional
25% down · 7.5% · 30yr
- Down + closing
- —
- Monthly P&I
- —
- Monthly cashflow
- —
- DSCR
- —
- Eligible?
- —
Personal DTI + credit; lowest rate.
DSCR
20% down · 8.5% · 30yr
- Down + closing
- —
- Monthly P&I
- —
- Monthly cashflow
- —
- DSCR
- —
- Eligible?
- —
No personal income docs; deal must DSCR.
Hard money
10% down · 12.0% · 12mo
- Down + closing
- —
- Monthly P&I
- —
- Monthly cashflow
- —
- DSCR
- —
- Eligible?
- —
Short-term bridge; refi at stabilization.
Rent comps 4 comps
| Address | Beds | Baths | Sqft | Rent | $/sqft | DOM | Units | Dist |
|---|---|---|---|---|---|---|---|---|
| 9516 Alexander Rd Cleveland, OH | 3.0 | 1.0 | 1500 | $2,000 | $1.33 | 19d | 1 | 0.47mi |
| 11107 Park Heights Ave Cleveland, OH | 4.0 | 2.0 | 1640 | $2,000 | $1.22 | 1d | 1 | 0.95mi |
| 7133 Bletch Ct Cleveland, OH | 3.0 | 1.5 | 1471 | $2,000 | $1.36 | 43d | 1 | 1.01mi |
| 5069 Henry St Cleveland, OH | 3.0 | 2.0 | 1575 | $2,000 | $1.27 | 21d | 1 | 1.37mi |
Listing history 19 events
-
2026-06-18days on market $134,900 Active 21 DOM
-
2026-06-17days on market $134,900 Active 20 DOM
-
2026-06-16days on market $134,900 Active 19 DOM
-
2026-06-15days on market $134,900 Active 18 DOM
-
2026-06-13days on market $134,900 Active 16 DOM
-
2026-06-13days on market $134,900 Active 15 DOM
-
2026-06-09days on market $134,900 Active 12 DOM
-
2026-06-08days on market $134,900 Active 11 DOM
-
2026-06-07days on market $134,900 Active 10 DOM
-
2026-06-05days on market $134,900 Active 7 DOM
-
2026-06-03days on market $134,900 Active 6 DOM
-
2026-06-02days on market $134,900 Active 5 DOM
-
2026-06-01days on market $134,900 Active 4 DOM
-
2026-05-31days on market $134,900 Active 3 DOM
-
2026-05-29$134,900 Active
-
1998-11-25soldstatus $68,000
-
1998-04-10historical
-
1998-01-09$79,900
-
1986-02-12soldstatus $52,000
ⓘ Source: listings_history table (triggers on properties + properties_extension) + one-shot
backfill from property_details.listing_events for pre-trigger history.
Tax reassessment forecast OH · Partial reset (capped growth)
- Current annual tax
- $4,009 · $334/mo
- Projected year-2 tax
- $4,009 · $334/mo
- Expected delta
- $0/yr ($0/mo · 0.0%)
ⓘ Screening estimate from a state-policy table — verify with the county assessor before closing.
Climate risk First Street
- Flood 1/10 Low FEMA zone X (unshaded) · 0% chance over 30 yrs
- Wildfire 1/10 Low
- Heat 3/10 Moderate 7 d/yr ≥96°F today · 17 d/yr by 30 yrs out
- Wind 1/10 Low
- Air quality 3/10 Moderate 2 unhealthy d/yr today · 3 by 30 yrs out
Nearby sold comps map
Loading sold comps map…
Walkable amenities ~0.75 mi
Loading nearby amenities…
Taxation est. · year 1
- Rental income
- $32,712
- − Mortgage interest
- −$7,556
- − Property taxes
- −$4,009
- − Insurance
- −$674
- − Repairs & maintenance
- −$2,617
- − Management
- −$2,617
- − Depreciation
- −$3,924
- Taxable income
- $11,313
- Est. tax owed @ 24.0%
- −$2,715
- After-tax cash flow
- $9,954/yr
For passive investors: Depreciation is non-cash, so a rental often shows a tax loss while cash-flowing — sheltering income. Rental losses are passive: they offset passive income freely, and up to $25,000/yr can offset ordinary (W-2) income if you actively participate and your MAGI is under $100k (phasing out to $0 by $150k); unused losses carry forward. On sale, claimed depreciation is recaptured at up to 25%, and gains may owe capital-gains tax (a 1031 exchange can defer both). Figures are a year-1 estimate at your 24.0% rate — not tax advice; consult a CPA.
Schools (NCES district)
- District
- Garfield Heights City Schools
- NCES district ID
- 3904404
- Math proficiency
- 8% ▼ -19.00%
- Reading proficiency
- 22% ▼ -18.00%
- Median HH income
- $41,334
- Composite
- 12.88/100
- National rank
- #9590
- State rank
- #643 of 656 in OH
Livability — Garfield Heights
- Score
- 67/100
- State rank
- #593
- US rank
- #10152
Category grades
Schools grade is shown separately in the Schools card above.
Census & demographics
- Census place
- Garfield Heights, OH
- County
- Cuyahoga County · 1,090,369 people
- City population
- 29,461
- Metro
- Cleveland-Elyria, OH
- Population (ZIP)
- 29,461
- Household income
- $57,363
- Rent vs Own
- Severe rent burden
- 1738.0
Population outlook (Cuyahoga County) Hauer SSP2
- Today (2025)
- 1,244,621 people
- By 2030
- 1,230,093 · -1.2%
- By 2040
- 1,189,108 · -4.5%
- By 2050
- 1,145,706 · -7.9%
- By 2075
- 1,076,557 · -13.5%
- By 2100
- 978,987 · -21.3%
Race, ethnicity, and origin ACS 2023
- Neighborhood character
- Diverse neighborhood (Simpson 0.61)
- Race & ethnicity
- Black 47% White 41% Two or more races 7% Hispanic / Latino 6%
- Hispanic origin (detail)
- Mexican 2% Puerto Rican 3%
- Common ancestry
- Romanian 11% Slovak 1% Lithuanian 1%
- Foreign-born
- 3% · Canada
- Languages at home
- 94% English-only · Spanish 4% Russian/Polish/Slavic 1%
Political lean MEDSL · Cuyahoga
- 2024 margin
- Solid D (+31.5) · D 65.4% · R 33.9%
- 2008→2024 swing
- -7.4pp toward R · 2008: 38.9pp · 2024: 31.5pp
- All cycles
- 2024: D+31.5 2020: D+34.1 2016: D+35.0 2012: D+38.7 2008: D+38.9
Not yet ingested
- Civics
- —
Market trends
- HPI YoY
- ▼ -116.98%
- Current HPI
- 155.1507
- Rent YoY
- ▲ 4.80%
- Metro
- Cleveland-Elyria, OH
- State GDP YoY
- ▲ 1.98%
- F500 in state
- 48
Industry mix (Fortune 500 HQ in OH)
| Industry | F500 HQs | Revenue |
|---|---|---|
| Insurance | 3 | $145B |
|
||
| Industrial Machinery | 3 | $49B |
|
||
| Financial Services | 3 | $24B |
|
||
| Consumer Goods | 2 | $93B |
|
||
| Aerospace / Defense | 2 | $47B |
|
||
| Utilities | 2 | $33B |
|
||
Price history
+159.4% since first listed5 events — show timeline
- 2026-05-29 Listed $134,900 FSBO.com
- 1998-11-25 Sold (Public Records) $68,000 Public Records
- 1998-04-10 Listing Removed — MLSNOW
- 1998-01-09 Listed $79,900 MLSNOW
- 1986-02-12 Sold (Public Records) $52,000 Public Records
Property tax history
+3.5%/yrLatest (2025): $4,009 · -19.1% YoY. Source: county tax records.
Cash-flow waterfall
monthlySold comps — $/sqft
last 12 mo · ≤1 miLoading sold comps…