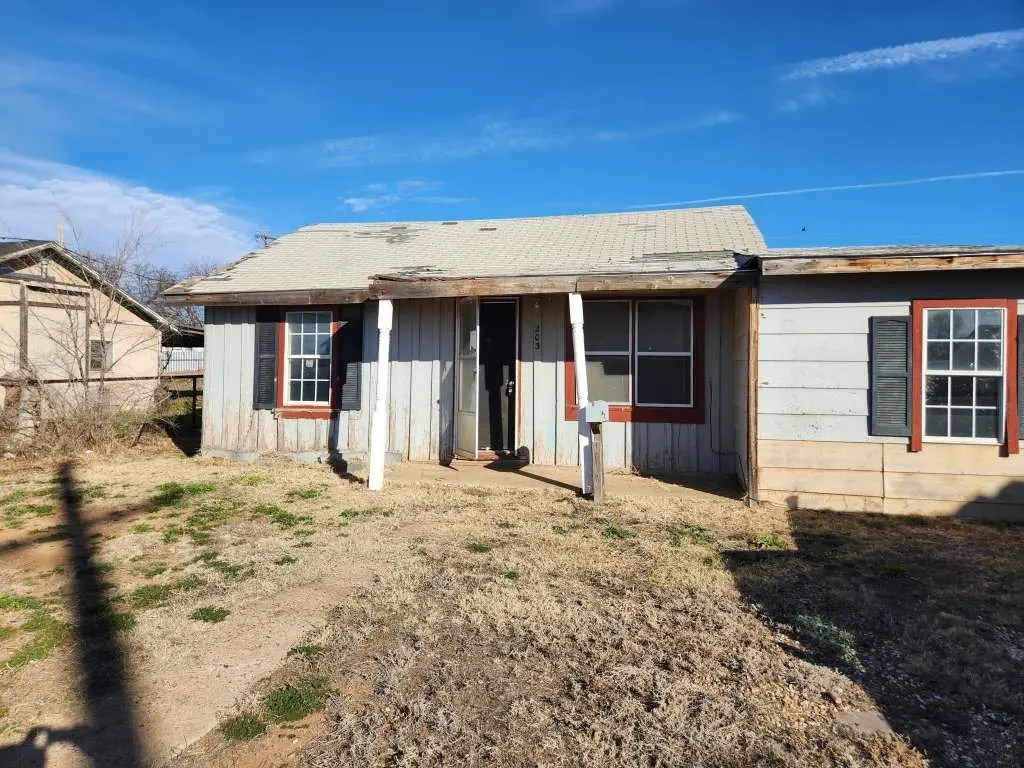
203 Pecan St · Levelland, TX
Flood risk 1/10 · Minimal
- FEMA flood zone
- X
- Chance of flooding over 30 yrs
- 0.0%
- Est. flood insurance / yr
- $507 – $1,088
Fire risk 3/10 · Minor
- Est. fire insurance / yr
- $1,222 – $2,270
Heat risk 5/10 · Moderate
- Hot days now (above 99°F)
- 7 days/yr
- Hot days in 30 yrs
- 21 days/yr
Wind risk 2/10 · Minimal
- Chance of severe wind over 30 yrs
- —
Air-quality risk 1/10 · Minimal
- Unhealthy air days now
- 0 days/yr
- Unhealthy air days in 30 yrs
- 0 days/yr
Risk factors via First Street. Map © Google.
Why this score? — see what drove the B- grade
The composite is a weighted blend of 9 inputs, each scored 0–100. Each bar is that input's sub-score; the figure is the points it added to the 100-point composite (weight × sub-score).
- Cash flow +30.0/30.0
- DSCR +10.0/10.0
- 1% rule +9.3/10.0
- ARV discount +7.5/15.0
- Livability +3.6/5.0
- Schools +2.8/10.0
- Rent growth +2.5/5.0
- Condition / age +2.5/5.0
- Appreciation +0.0/10.0
$58,409
🖨 Deal sheet 📄 Offer letter ✓ Due diligence
Listing remarks MLS
FIXER UPPER! Welcome to this renovation-ready fixer-upper home located in Levelland, TX. With a one-story layout, three bedrooms, one bathroom, and approximately 954 square feet of living space, this property offers a great opportunity for customization. The combination of vinyl, laminate, and carpeted flooring adds character and versatility to the interior. The family room is spacious and bright, thanks to large windows that fill the space with natural light. In the kitchen, you'll find a designated area with dark wooden cabinets and laminate countertops, providing both style and functionality. This location gives you easy access to Hwy. 114 and 385. This home is being sold AS IS but will have a NEW ROOF. This property has a lot of potential. WE MAKE IT EASY TO OWN. This is a great opportunity! Don't wait, call us today to get more information on the owner's easy terms and smooth process that may be able to put the deed in your name and make this your dream home.
Key facts
- Large windows
- Dark wooden cabinets
- One story layout
Tags
Neighborhood map
What this means for you Summary
Snapshot
- This is a 3-bed/1.0-bath single-family listed at $58k.
Deal economics
- At list price, monthly cash flow is $294 ($4k/yr) — positive.
- The deal already cash-flows at list — no discount required.
- Meets the 1% rule at list price ($836 rent vs $58k).
- Recommended offer: $51k (12.0% below list) — sets the bar for market timing.
Location & tenants
- Location reads 72/100 on livability (#274 in TX) — a middle-class / working-renter tenant base. Strengths: cost of living A+, housing A+, health & safety A+; Watch: schools F, commute F, employment F.
- Levelland ISD (town): math 33% / reading 32% proficiency, ranked #566 of 826 in TX (top 68%) — families likely to look elsewhere, expect single-tenant / working-renter base with shorter leases; 64% free/reduced lunch — lower-income household profile, screen leases tightly.
- Market conditions: 120 active listings in the ZIP; 7 comparable units currently listed for rent nearby; rentals leasing fast (median 14d on market — plan ~1-2 weeks tenant-placement turnaround); 7 units permitted in Hockley County in 2024 (0 in 5+ unit buildings).
Forward outlook
- Local home prices are declining (-3.0%/yr); year-one equity from $404 of loan paydown is wiped out by about $2k of value loss. Plan a longer hold.
- Hockley County population projected at +21% by 2050 — long-run rental-demand tailwind backs the buy-and-hold thesis.
- At projected returns (-3.0% appreciation + 3.0% rent growth), your $16k cash investment doubles in ~6 years — after that, you're playing with house money.
Negotiation context
- It's been on market 304 days — a 12% lower offer ($51k) is reasonable based on typical stale-listing flexibility.
Risks & watch-outs
- Watch-outs: built in 1955 — expect roof / HVAC / electrical / plumbing capex.
- Climate carrying-cost: extreme-heat days projected 7→21/yr by 2055 (HVAC capex compounding) — expect insurance premiums to compound above CPI over the hold.
Questions for the listing agent
- It's been on market 304 days. Have you received any prior offers? Is the seller open to a 12% concession, seller financing, or rate buy-down credit?
- Built in 1955 — when were the roof, HVAC, electrical panel, plumbing, and water heater last replaced?
- Why hasn't it sold? Are there any deal-killer items the seller is aware of (foundation, flood, title, zoning, code violations)?
- Is there a deadline driving the sale (1031 exchange, divorce, estate, relocation)? That informs how much negotiation room exists.
- Schools are F-rated, which usually means shorter tenancies and higher turnover. Who's the typical renter profile here, and what's been the actual vacancy rate?
- What's the average days-on-market for RENTAL listings here right now (not sales)? A rising rental-DOM trend means longer vacancies and softer asking-rent achievability than the comps imply.
- What's the recent tenant-quality profile in this submarket — average credit score on applications, eviction rate, late-payment / NSF rate, and stable-employment percentage? A property-management company in the area should have these aggregated.
- How much new for-sale + rental construction is in the pipeline within 1–3 miles? Heavy new supply typically softens prices + rents 12–24 months out; constrained supply supports both.
Investment metrics
- 1% rule
- 1.43% ✓
- Cap rate
- 12.34%
- Cash-on-cash
- 21.60%
- DSCR
- 1.96
- GRM
- 5.8
CMA / ARV
No comps found within radius.
Projected returns pro-forma
-3.0% appreciation · 3.0% rent growth · sell at horizon
- IRR
- 14.2%
- Equity multiple
- 1.57×
- Total profit
- $9,272
- Equity at exit
- $8,709
- IRR
- 22.9%
- Equity multiple
- 2.97×
- Total profit
- $32,172
- Equity at exit
- $5,050
Cash invested: $16,355 (down + closing). Projections, not guarantees.
Landlord ↔ Tenant lean methodology
- Overall (STATE)
- 87 Strongly Landlord-Friendly
- State Texas
- 87 Strongly Landlord-Friendly · R+5
- County
- — inherits STATE
- City
- — inherits STATE
ZIP-level market 79336
- Active inventory
- 120
- Price-to-rent
- 5.8×
Monthly cashflow live
- Estimated rent
- $836 high interval (Pro) →
- Mortgage (P&I)
- −$306
- Tax from tax record
- −$36 /mo · $428/yr
- Insurance
- −$24
- HOA
- −$0
- Vacancy / Maint / Mgmt
- −$176
- Net cashflow
- $294
Break-even live
UW: 25.0% down · 7.5% · 30yr · 1.5% tax · 5.0% vac · 8.0% maint · 8.0% mgmt
Financing live
Cash to close
- Down payment
- $14,602
- Closing costs
- $1,752
- Reserves months
- —
- Total cash needed
- —
Loan-product check · same deal, 3 products live
Conventional
25% down · 7.5% · 30yr
- Down + closing
- —
- Monthly P&I
- —
- Monthly cashflow
- —
- DSCR
- —
- Eligible?
- —
Personal DTI + credit; lowest rate.
DSCR
20% down · 8.5% · 30yr
- Down + closing
- —
- Monthly P&I
- —
- Monthly cashflow
- —
- DSCR
- —
- Eligible?
- —
No personal income docs; deal must DSCR.
Hard money
10% down · 12.0% · 12mo
- Down + closing
- —
- Monthly P&I
- —
- Monthly cashflow
- —
- DSCR
- —
- Eligible?
- —
Short-term bridge; refi at stabilization.
Rent comps 7 comps
| Address | Beds | Baths | Sqft | Rent | $/sqft | DOM | Units | Dist |
|---|---|---|---|---|---|---|---|---|
| 226 Cherry St Unit 43 Levelland, TX | 2.0 | 1.0 | 800 | $650 | $0.81 | 13d | 1 | 0.19mi |
| 226 Cherry St Levelland, TX | 2.0 | 1.0 | 575 | $650 | $1.13 | 13d | 6 | 0.20mi |
| 132 Railroad Ave Levelland, TX | 3.0 | 2.0 | 1040 | $1,150 | $1.11 | 43d | 1 | 0.23mi |
| 400 N Cedar Ave Levelland, TX | 1.0–3.0 | 1.0–1.5 | 857 | $950 | $1.11 | 13d | 4 | 0.47mi |
| 226 Hickory St Unit B Levelland, TX | 2.0 | 1.0 | 1000 | $945 | $0.94 | 13d | 1 | 0.50mi |
| 710 9th St Levelland, TX | 2.0 | 1.0 | 1005 | $695 | $0.69 | 21d | 1 | 0.77mi |
| 1819 Avenue I Pl Unit 5 Levelland, TX | 2.0 | 1.0 | 800 | $650 | $0.81 | 21d | 1 | 1.47mi |
Listing history 15 events
-
2026-06-18days on market $58,409 Active 304 DOM
-
2026-06-17days on market $58,409 Active 303 DOM
-
2026-06-16days on market $58,409 Active 302 DOM
-
2026-06-15days on market $58,409 Active 301 DOM
-
2026-06-13days on market $58,409 Active 299 DOM
-
2026-06-12days on market $58,409 Active 298 DOM
-
2026-06-10days on market $58,409 Active 295 DOM
-
2026-06-08days on market $58,409 Active 294 DOM
-
2026-06-08days on market $58,409 Active 293 DOM
-
2026-06-07days on market $58,409 Active 292 DOM
-
2026-06-03days on market $58,409 Active 289 DOM
-
2026-06-02days on market $58,409 Active 288 DOM
-
2026-06-01days on market $58,409 Active 287 DOM
-
2026-05-31days on market $58,409 Active 286 DOM
-
2025-08-18$58,409 Active 979-char remark
Show marketing remark (979 chars)
FIXER UPPER! Welcome to this renovation-ready fixer-upper home located in Levelland, TX. With a one-story layout, three bedrooms, one bathroom, and approximately 954 square feet of living space, this property offers a great opportunity for customization. The combination of vinyl, laminate, and carpeted flooring adds character and versatility to the interior. The family room is spacious and bright, thanks to large windows that fill the space with natural light. In the kitchen, you'll find a designated area with dark wooden cabinets and laminate countertops, providing both style and functionality. This location gives you easy access to Hwy. 114 and 385. This home is being sold AS IS but will have a NEW ROOF. This property has a lot of potential. WE MAKE IT EASY TO OWN. This is a great opportunity! Don't wait, call us today to get more information on the owner's easy terms and smooth process that may be able to put the deed in your name and make this your dream home.
ⓘ Source: listings_history table (triggers on properties + properties_extension) + one-shot
backfill from property_details.listing_events for pre-trigger history.
Tax reassessment forecast TX · Resets to sale price
- Current annual tax
- $428 · $36/mo
- Projected year-2 tax
- $1,069 · $89/mo
- Expected delta
- +$640/yr (+$53/mo · 149.5%)
ⓘ Screening estimate from a state-policy table — verify with the county assessor before closing.
Climate risk First Street
- Flood 1/10 Low FEMA zone X · 0% chance over 30 yrs
- Wildfire 3/10 Moderate
- Heat 5/10 Major 7 d/yr ≥99°F today · 21 d/yr by 30 yrs out
- Wind 2/10 Low
- Air quality 1/10 Low 0 unhealthy d/yr today · 0 by 30 yrs out
Nearby sold comps map
Loading sold comps map…
Walkable amenities ~0.75 mi
Loading nearby amenities…
Taxation est. · year 1
- Rental income
- $10,036
- − Mortgage interest
- −$3,272
- − Property taxes
- −$428
- − Insurance
- −$292
- − Repairs & maintenance
- −$803
- − Management
- −$803
- − Depreciation
- −$1,699
- Taxable income
- $2,739
- Est. tax owed @ 24.0%
- −$657
- After-tax cash flow
- $2,875/yr
For passive investors: Depreciation is non-cash, so a rental often shows a tax loss while cash-flowing — sheltering income. Rental losses are passive: they offset passive income freely, and up to $25,000/yr can offset ordinary (W-2) income if you actively participate and your MAGI is under $100k (phasing out to $0 by $150k); unused losses carry forward. On sale, claimed depreciation is recaptured at up to 25%, and gains may owe capital-gains tax (a 1031 exchange can defer both). Figures are a year-1 estimate at your 24.0% rate — not tax advice; consult a CPA.
Schools (NCES district)
- District
- Levelland ISD
- NCES district ID
- 4827240
- Math proficiency
- 33% ▼ -9.00%
- Reading proficiency
- 32% ▼ -6.00%
- Median HH income
- $47,924
- Composite
- 28.09/100
- National rank
- #6833
- State rank
- #566 of 826 in TX
Livability — Levelland
- Score
- 72/100
- State rank
- #274
- US rank
- #6392
Category grades
Schools grade is shown separately in the Schools card above.
Census & demographics
- Census place
- Levelland, TX
- Population (ZIP)
- 15,265
Population outlook (Hockley County) Hauer SSP2
- Today (2025)
- 25,295 people
- By 2030
- 26,230 · +3.7%
- By 2040
- 28,268 · +11.8%
- By 2050
- 30,536 · +20.7%
- By 2075
- 36,867 · +45.7%
- By 2100
- 40,662 · +60.8%
Race, ethnicity, and origin ACS 2023
- Neighborhood character
- Majority Hispanic (53%)
- Race & ethnicity
- Hispanic / Latino 53% White 42% Two or more races 24% Black 3%
- Hispanic origin (detail)
- Mexican 48%
- Common ancestry
- Slovak 1% Lithuanian 1% Italian 1%
- Foreign-born
- 9% · Canada
- Languages at home
- 72% English-only · Spanish 27%
Political lean MEDSL · Hockley
- 2024 margin
- Solid R (+66.3) · D 16.6% · R 82.8%
- 2008→2024 swing
- -14.0pp toward R · 2008: -52.3pp · 2024: -66.3pp
- All cycles
- 2024: R+66.3 2020: R+62.4 2016: R+62.3 2012: R+57.0 2008: R+52.3
Not yet ingested
- Civics
- —
Market trends
- HPI YoY
- ▼ -169.34%
- Current HPI
- 154.0713
- Rent YoY
- —
- Metro
- —
- State GDP YoY
- ▲ 3.95%
- F500 in state
- 110
Industry mix (Fortune 500 HQ in TX)
| Industry | F500 HQs | Revenue |
|---|---|---|
| Energy | 16 | $1,198B |
|
||
| Technology | 5 | $198B |
|
||
| Engineering / Construction | 4 | $72B |
|
||
| Energy Services | 3 | $60B |
|
||
| Utilities | 3 | $41B |
|
||
| Healthcare | 2 | $330B |
|
||
Price history
1 event — show timeline
- 2025-08-18 Listed $58,409 HARMLS
Property tax history
+4.1%/yrLatest (2025): $428 · +22.9% YoY. Source: county tax records.
Cash-flow waterfall
monthlySold comps — $/sqft
last 12 mo · ≤1 miLoading sold comps…