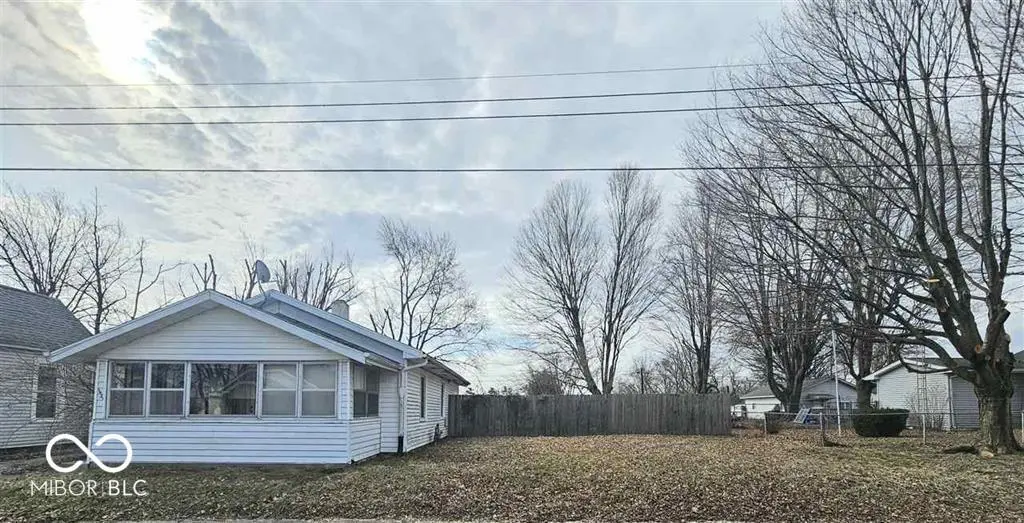
1621 R Ave · New Castle, IN
Flood risk 3/10 · Minor
- FEMA flood zone
- X (unshaded)
- Chance of flooding over 30 yrs
- 0.2%
- Est. flood insurance / yr
- $473 – $860
Fire risk 1/10 · Minimal
- Est. fire insurance / yr
- $717 – $1,331
Heat risk 3/10 · Minor
- Hot days now (above 99°F)
- 7 days/yr
- Hot days in 30 yrs
- 18 days/yr
Wind risk 2/10 · Minimal
- Chance of severe wind over 30 yrs
- 1.0%
Air-quality risk 2/10 · Minimal
- Unhealthy air days now
- 1 days/yr
- Unhealthy air days in 30 yrs
- 2 days/yr
Risk factors via First Street. Map © Google.
Why this score? — see what drove the B- grade
The composite is a weighted blend of 9 inputs, each scored 0–100. Each bar is that input's sub-score; the figure is the points it added to the 100-point composite (weight × sub-score).
- Cash flow +25.5/30.0
- ARV discount +15.0/15.0
- DSCR +8.4/10.0
- 1% rule +6.9/10.0
- Livability +3.8/5.0
- Rent growth +3.6/5.0
- Schools +2.7/10.0
- Condition / age +2.5/5.0
- Appreciation +0.0/10.0
$64,999
🖨 Deal sheet 📄 Offer letter ✓ Due diligence
Listing remarks MLS
Opportunity knocks with this property at 1621 R Avenue in New Castle! Sold * * as-is * * , this home offers a fantastic chance for investors or buyers ready to bring their vision to life. With some care and creativity, this property could be transformed into a cozy residence or a valuable addition to any investment portfolio. The standout feature of this home is the oversized yard, offering a wonderful space for outdoor living, gardening, or just relaxing in the fresh air. The possibilities are endless for those who value room to stretch out and customize their surroundings. If you’re looking for a project with great promise, 1621 R Avenue is the perfect canvas. Don’t miss the chance to explore all this home has to offer and turn it into something truly special. Call Brian Ingle at 765-960-0533.
Key facts
- Oversized yard
- 9,845 sq ft lot
- Built 1945
Tags
Property features AI
Exterior
- Parking: Detached parking (no garage spaces listed)
- Utilities: Public water; Municipal sewer connection; Trash/solid waste service available
- Home design: Single-family residence; One-story
- Construction: Vinyl siding; Block foundation
- Exterior features: Lot under 1/4 acre (approximately 0.23 acre)
Interior
- Kitchen: Kitchen on the main level
- Bedrooms: Two bedrooms (both on the main level)
- Bathrooms: One full bathroom (on the main level)
- Heating & cooling: Forced air heating; No central cooling
- Interior features: Basement present; No built-in appliances listed
- Laundry & utility: No specific laundry appliances listed
Neighborhood map
What this means for you Summary
Snapshot
- This is a 1-bed/1.0-bath single-family listed at $65k.
Deal economics
- At list price, monthly cash flow is $151 ($2k/yr) — positive.
- The deal already cash-flows at list — no discount required.
- Meets the 1% rule at list price ($773 rent vs $65k).
- Recommended offer: $63k (3.0% below list) — sets the bar for market timing.
- Cap rate 9.1% vs local median 4.8% in New Castle — top-decile yield for the area; either an underpriced asset or a hidden risk that comps aren't pricing in. Stress-test before assuming the spread holds.
Location & tenants
- Location reads 75/100 on livability (#64 in IN, #4,219 nationally) — a middle-class / working-renter tenant base. Strengths: crime A+, cost of living A+, housing A+; Watch: schools D+, amenities F, commute F.
- New Castle Community School Corporation (town): math 30% / reading 35% proficiency, ranked #229 of 301 in IN (top 76%) — families likely to look elsewhere, expect single-tenant / working-renter base with shorter leases.
- Market conditions: Rents rising fast (+4.6%/yr); 214 active listings in the ZIP; 4 comparable units currently listed for rent nearby; rentals at typical pace (median 15d on market — plan ~3-4 weeks tenant-placement turnaround); 47 units permitted in Henry County in 2024 (0 in 5+ unit buildings).
- This rent is only 15% of the median local income ($60k/yr) — well below the 30% rent-burden line; pricing power to push rent on renewal without tenant pushback.
Forward outlook
- Local home prices are declining (-3.0%/yr); year-one equity from $449 of loan paydown is wiped out by about $2k of value loss. Plan a longer hold.
- Henry County population projected at -12% by 2050 — secular population decline; favor cash flow + early exit over multi-decade hold.
- At projected returns (-3.0% appreciation + 4.6% rent growth), your $18k cash investment doubles in ~9 years — after that, you're playing with house money.
Negotiation context
- It's been on market 39 days — a 3% lower offer ($63k) is reasonable based on typical stale-listing flexibility.
- 7 sale attempts since 12y ago with the ask held roughly flat each time — persistent listings suggest the price (not the market) is what's stuck; bring a comps-based counter.
- Current owner paid $10k; list at $65k implies a 557% gain — meaningful room to come down on a strong offer.
Risks & watch-outs
- Watch-outs: built in 1945 — expect roof / HVAC / electrical / plumbing capex.
Questions for the listing agent
- It's been on market 39 days. Have you received any prior offers? Is the seller open to a 3% concession, seller financing, or rate buy-down credit?
- Built in 1945 — when were the roof, HVAC, electrical panel, plumbing, and water heater last replaced?
- Is there a deadline driving the sale (1031 exchange, divorce, estate, relocation)? That informs how much negotiation room exists.
- Schools are D-rated, which usually means shorter tenancies and higher turnover. Who's the typical renter profile here, and what's been the actual vacancy rate?
- What's the average days-on-market for RENTAL listings here right now (not sales)? A rising rental-DOM trend means longer vacancies and softer asking-rent achievability than the comps imply.
- What's the recent tenant-quality profile in this submarket — average credit score on applications, eviction rate, late-payment / NSF rate, and stable-employment percentage? A property-management company in the area should have these aggregated.
- How much new for-sale + rental construction is in the pipeline within 1–3 miles? Heavy new supply typically softens prices + rents 12–24 months out; constrained supply supports both.
Investment metrics
- 1% rule
- 1.19% ✓
- Cap rate
- 9.08%
- Cash-on-cash
- 9.94%
- DSCR
- 1.44
- GRM
- 7.0
CMA / ARV
- ARV (median comp)
- $116,115
- List price
- $64,999
- Delta
- -44.02%
- Verdict
- UNDERPRICED
- Comps
- 20 within 1.0 mi
Show comp detail 12 sales within ~0.75 mi
| Address | Dist | Beds/Ba | Sqft | Sold | Price | $/sf | Match |
|---|---|---|---|---|---|---|---|
| 2605 Sunnyside Ave | 0.30mi | 2/1.0 (+1) | 720 (-6%) | 2mo | $90,000 | $125 | 69 |
| 3000 S 12th St | 0.52mi | 2/1.0 (+1) | 768 (-0%) | 14mo | $143,000 | $186 | 59 |
| 1103 I Ave | 0.68mi | 2/1.0 (+1) | 768 (-0%) | 6mo | $90,000 | $117 | 58 |
| 1516 S 20th St | 0.65mi | 2/1.0 (+1) | 756 (-2%) | 7mo | $106,000 | $140 | 56 |
| 1918 Roosevelt Ave | 0.37mi | 2/1.0 (+1) | 704 (-9%) | 10mo | $36,000 | $51 | 55 |
| 2720 E Fairoaks Dr | 0.68mi | 2/1.0 (+1) | 788 (+2%) | 7mo | $137,500 | $174 | 54 |
| 2125 Fairmont Ave | 0.40mi | 2/1.0 (+1) | 837 (+9%) | 18mo | $74,662 | $89 | 47 |
| 1625 Irvin St | 0.67mi | 2/1.0 (+1) | 726 (-6%) | 9mo | $115,000 | $158 | 47 |
| 3010 S 23rd St | 0.54mi | 2/1.0 (+1) | 720 (-6%) | 17mo | $94,000 | $131 | 45 |
| 2105 P Ave | 0.37mi | 2/1.0 (+1) | 864 (+12%) | 17mo | $130,000 | $150 | 43 |
| 1612 Irvin St | 0.67mi | 2/1.0 (+1) | 672 (-13%) | 2mo | $82,000 | $122 | 40 |
| 1418 S 20th St | 0.71mi | 2/1.0 (+1) | 825 (+7%) | 13mo | $85,400 | $104 | 39 |
Match score weights: distance 35% · size 25% · config 20% · recency 20%. Top-matched comps best support the ARV.
Projected returns pro-forma
-3.0% appreciation · 4.59% rent growth · sell at horizon
- IRR
- 0.5%
- Equity multiple
- 1.02×
- Total profit
- $341
- Equity at exit
- $9,692
- IRR
- 11.7%
- Equity multiple
- 1.99×
- Total profit
- $18,053
- Equity at exit
- $5,620
Cash invested: $18,200 (down + closing). Projections, not guarantees.
Landlord ↔ Tenant lean methodology
- Overall (STATE)
- 90 Strongly Landlord-Friendly
- State Indiana
- 90 Strongly Landlord-Friendly · R+11
- County
- — inherits STATE
- City
- — inherits STATE
ZIP-level market 47362
- Home prices YoY
- -16.0%
- Rents YoY
- 4.6%
- Active inventory
- 214
- Price-to-rent
- 7.0×
Monthly cashflow live
- Estimated rent
- $773 medium interval (Pro) →
- Mortgage (P&I)
- −$341
- Tax from tax record
- −$92 /mo · $1,100/yr
- Insurance
- −$27
- HOA
- −$0
- Vacancy / Maint / Mgmt
- −$162
- Net cashflow
- $151
Break-even live
UW: 25.0% down · 7.5% · 30yr · 1.5% tax · 5.0% vac · 8.0% maint · 8.0% mgmt
Financing live
Cash to close
- Down payment
- $16,250
- Closing costs
- $1,950
- Reserves months
- —
- Total cash needed
- —
Loan-product check · same deal, 3 products live
Conventional
25% down · 7.5% · 30yr
- Down + closing
- —
- Monthly P&I
- —
- Monthly cashflow
- —
- DSCR
- —
- Eligible?
- —
Personal DTI + credit; lowest rate.
DSCR
20% down · 8.5% · 30yr
- Down + closing
- —
- Monthly P&I
- —
- Monthly cashflow
- —
- DSCR
- —
- Eligible?
- —
No personal income docs; deal must DSCR.
Hard money
10% down · 12.0% · 12mo
- Down + closing
- —
- Monthly P&I
- —
- Monthly cashflow
- —
- DSCR
- —
- Eligible?
- —
Short-term bridge; refi at stabilization.
Rent comps 4 comps
| Address | Beds | Baths | Sqft | Rent | $/sqft | DOM | Units | Dist |
|---|---|---|---|---|---|---|---|---|
| 1216 S 19th St New Castle, IN | 2.0 | 1.0 | 824 | $1,000 | $1.21 | 23d | 1 | 0.78mi |
| 940 S 15th St New Castle, IN | 1.0–2.0 | 1.0–1.5 | 816 | $695 | $0.85 | 1d | 2 | 0.92mi |
| 701 S 14th St Unit 4A New Castle, IN | 1.0 | 1.0 | 600 | $615 | $1.02 | 12d | 1 | 1.13mi |
| 417 S 12th St Unit D New Castle, IN | 1.0 | 1.0 | 525 | $685 | $1.30 | 14d | 1 | 1.39mi |
Listing history 28 events
-
2026-06-19days on market $64,999 Active 39 DOM
-
2026-06-18days on market $64,999 Active 38 DOM
-
2026-06-17days on market $64,999 Active 37 DOM
-
2026-06-16days on market $64,999 Active 36 DOM
-
2026-06-15days on market $64,999 Active 35 DOM
-
2026-06-14days on market $64,999 Active 33 DOM
-
2026-06-12days on market $64,999 Active 32 DOM
-
2026-06-09days on market $64,999 Active 29 DOM
-
2026-06-08days on market $64,999 Active 28 DOM
-
2026-06-07days on market $64,999 Active 27 DOM
-
2026-06-05days on market $64,999 Active 24 DOM
-
2026-06-03days on market $64,999 Active 23 DOM
-
2026-06-02days on market $64,999 Active 22 DOM
-
2026-06-01days on market $64,999 Active 21 DOM
-
2026-05-31days on market $64,999 Active 20 DOM
-
2026-05-30days on market $64,999 Active 19 DOM
-
2026-05-11$64,999 Active 751-char remark
-
2026-04-29$64,999 Active 849-char remark
Show marketing remark (821 chars)
Opportunity knocks with this property at 1621 R Avenue in New Castle! Sold * * as-is * * , this home offers a fantastic chance for investors or buyers ready to bring their vision to life. With some care and creativity, this property could be transformed into a cozy residence or a valuable addition to any investment portfolio. The standout feature of this home is the oversized yard, offering a wonderful space for outdoor living, gardening, or just relaxing in the fresh air. The possibilities are endless for those who value room to stretch out and customize their surroundings. If you’re looking for a project with great promise, 1621 R Avenue is the perfect canvas. Don’t miss the chance to explore all this home has to offer and turn it into something truly special. Call Brian Ingle at 765-960-0533.
-
2025-11-18price $64,999
-
2015-04-30soldstatus $9,900
-
2015-04-30soldstatus $9,900
-
2015-04-30soldstatus $9,900
-
2015-03-16$9,900
-
2015-03-16$9,900
-
2015-03-16$9,900
-
2014-09-30historical
-
2014-04-01$24,900
-
2014-04-01$24,900
ⓘ Source: listings_history table (triggers on properties + properties_extension) + one-shot
backfill from property_details.listing_events for pre-trigger history.
Tax reassessment forecast IN · Partial reset (capped growth)
- Current annual tax
- $1,100 · $92/mo
- Projected year-2 tax
- $1,100 · $92/mo
- Expected delta
- $0/yr ($0/mo · 0.0%)
ⓘ Screening estimate from a state-policy table — verify with the county assessor before closing.
Climate risk First Street
- Flood 3/10 Moderate FEMA zone X (unshaded) · 20% chance over 30 yrs
- Wildfire 1/10 Low
- Heat 3/10 Moderate 7 d/yr ≥99°F today · 18 d/yr by 30 yrs out
- Wind 2/10 Low 100% chance of damaging wind over 30 yrs
- Air quality 2/10 Low 1 unhealthy d/yr today · 2 by 30 yrs out
Nearby sold comps map
Loading sold comps map…
Walkable amenities ~0.75 mi
Loading nearby amenities…
Taxation est. · year 1
- Rental income
- $9,271
- − Mortgage interest
- −$3,641
- − Property taxes
- −$1,100
- − Insurance
- −$325
- − Repairs & maintenance
- −$742
- − Management
- −$742
- − Depreciation
- −$1,891
- Taxable income
- $831
- Est. tax owed @ 24.0%
- −$199
- After-tax cash flow
- $1,609/yr
For passive investors: Depreciation is non-cash, so a rental often shows a tax loss while cash-flowing — sheltering income. Rental losses are passive: they offset passive income freely, and up to $25,000/yr can offset ordinary (W-2) income if you actively participate and your MAGI is under $100k (phasing out to $0 by $150k); unused losses carry forward. On sale, claimed depreciation is recaptured at up to 25%, and gains may owe capital-gains tax (a 1031 exchange can defer both). Figures are a year-1 estimate at your 24.0% rate — not tax advice; consult a CPA.
Schools (NCES district)
- District
- New Castle Community School Corporation
- NCES district ID
- 1807440
- Math proficiency
- 30% ▼ -13.00%
- Reading proficiency
- 35% ▼ -9.00%
- Median HH income
- $36,717
- Composite
- 26.99/100
- National rank
- #7067
- State rank
- #229 of 301 in IN
Livability — New Castle
- Score
- 75/100
- State rank
- #64
- US rank
- #4219
Category grades
Schools grade is shown separately in the Schools card above.
Census & demographics
- Census place
- New Castle, IN
- County
- Henry County · 29,337 people
- City population
- 29,337
- Metro
- New Castle, IN
- Population (ZIP)
- 29,337
- Household income
- $60,258
- Rent vs Own
- Severe rent burden
- 545.0
Population outlook (Henry County) Hauer SSP2
- Today (2025)
- 48,028 people
- By 2030
- 47,125 · -1.9%
- By 2040
- 44,820 · -6.7%
- By 2050
- 42,207 · -12.1%
- By 2075
- 35,814 · -25.4%
- By 2100
- 26,779 · -44.2%
Race, ethnicity, and origin ACS 2023
- Neighborhood character
- Predominantly White (90%)
- Race & ethnicity
- White 90% Two or more races 3% Black 3% Hispanic / Latino 3%
- Common ancestry
- Italian 2% Slovak 1% Lithuanian 1%
- Foreign-born
- 2% · Canada
- Languages at home
- 97% English-only · Spanish 2%
Political lean MEDSL · Henry
- 2024 margin
- Solid R (+47.7) · D 25.3% · R 73.0% · Other 1.7%
- 2008→2024 swing
- -43.8pp toward R · 2008: -3.9pp · 2024: -47.7pp
- All cycles
- 2024: R+47.7 2020: R+45.2 2016: R+43.7 2012: R+17.0 2008: R+3.9
Not yet ingested
- Civics
- —
Market trends
- HPI YoY
- ▼ -43.70%
- Current HPI
- 228.8885
- Rent YoY
- ▲ 4.59%
- Metro
- New Castle, IN
- State GDP YoY
- ▲ 2.90%
- F500 in state
- 18
Industry mix (Fortune 500 HQ in IN)
| Industry | F500 HQs | Revenue |
|---|---|---|
| Industrial Machinery | 2 | $37B |
|
||
| Healthcare | 1 | $177B |
|
||
| Pharmaceuticals | 1 | $45B |
|
||
| Metals / Steel | 1 | $18B |
|
||
| Agriculture | 1 | $17B |
|
||
| Packaging | 1 | $12B |
|
||
Price history
+161.0% since first listed12 events — show timeline
- 2026-05-11 Listed $64,999 MIBOR as Distributed by MLS Grid
- 2026-04-29 Listed $64,999 RRELMS
- 2025-11-18 Price Changed $64,999 RRELMS
- 2015-04-30 Sold (MLS) $9,900 RRELMS
- 2015-04-30 Sold (MLS) $9,900 MIBOR as Distributed by MLS Grid
- 2015-04-30 Sold (MLS) $9,900 IRMLS
- 2015-03-16 Listed $9,900 RRELMS
- 2015-03-16 Listed $9,900 MIBOR as Distributed by MLS Grid
- 2015-03-16 Listed $9,900 IRMLS
- 2014-09-30 Listing Removed — MIBOR as Distributed by MLS Grid
- 2014-04-01 Listed $24,900 MIBOR as Distributed by MLS Grid
- 2014-04-01 Listed $24,900 IRMLS
Property tax history
+16.0%/yrLatest (2024): $1,100 · +29.4% YoY. Source: county tax records.
Cash-flow waterfall
monthlySold comps — $/sqft
last 12 mo · ≤1 miLoading sold comps…