100 SE 6th Ave #304 · Pompano Beach, FL
Flood risk 3/10 · Minor
- FEMA flood zone
- AH
- Chance of flooding over 30 yrs
- 0.12%
- Est. flood insurance / yr
- $1,142 – $2,507
Fire risk 1/10 · Minimal
- Est. fire insurance / yr
- $947 – $1,759
Heat risk 10/10 · Severe
- Hot days now (above 106°F)
- 7 days/yr
- Hot days in 30 yrs
- 27 days/yr
Wind risk 10/10 · Severe
- Chance of severe wind over 30 yrs
- 99.0%
Air-quality risk 2/10 · Minimal
- Unhealthy air days now
- 1 days/yr
- Unhealthy air days in 30 yrs
- 2 days/yr
Risk factors via First Street. Map © Google.
Why this score? — see what drove the C+ grade
The composite is a weighted blend of 9 inputs, each scored 0–100. Each bar is that input's sub-score; the figure is the points it added to the 100-point composite (weight × sub-score).
- Cash flow +25.3/30.0
- 1% rule +10.0/10.0
- DSCR +8.3/10.0
- ARV discount +7.5/15.0
- Schools +4.1/10.0
- Livability +3.7/5.0
- Rent growth +3.0/5.0
- Condition / age +2.5/5.0
- Appreciation +0.0/10.0
$125,000
🖨 Deal sheet 📄 Offer letter ✓ Due diligence
Listing remarks
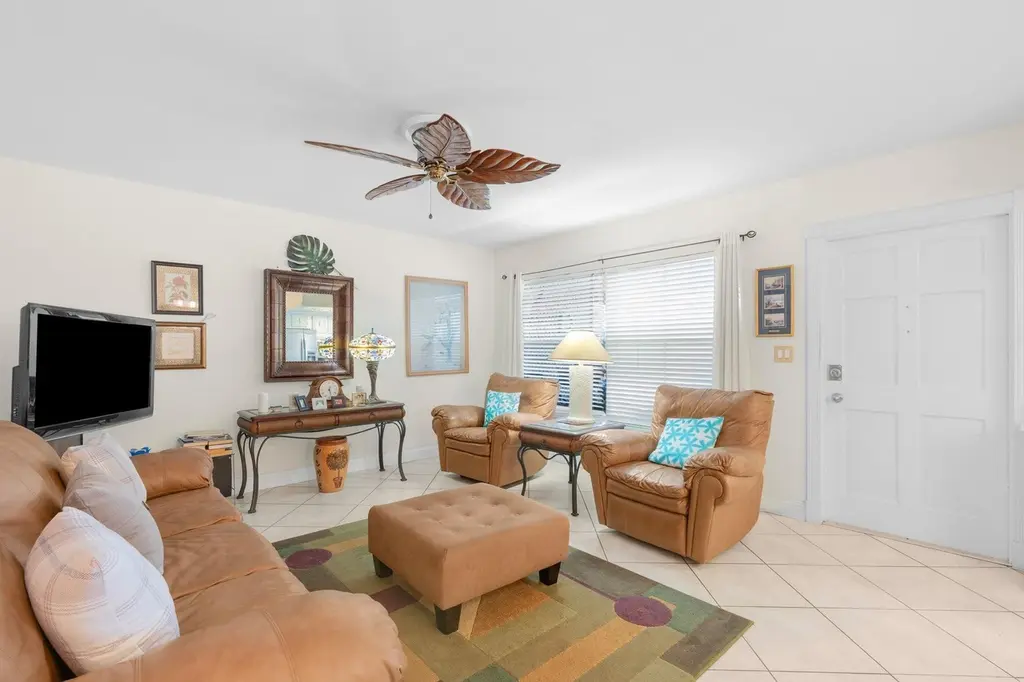
The BEST DEAL you will find in Garden Isles! This co-op is for all ages, fully furnished, 2 bed, 2 bath unit in an incredible location! Located right off of Atlantic Blvd, you are just minutes away from dining, shopping, parks, golf and less than 2 miles to the beach! Enjoy morning coffee overlooking the community heated pool from your screened-in balcony. Both bathrooms have been recently updated as well as a 1 year old water heater. Fully furnished, turnkey, and ready for you to make this your slice of Florida paradise! Plenty of storage inside as well as storage unit down the hall by the washer/dryer. Laundry on each floor, building roof and elevator are newer. 1 assigned parking spot, c
Key facts
- Plenty of storage
- Storage unit
- Screened-in balcony
Tags
Property features AI
Finance
- Other: Pets allowed (cats OK; number limits and possible restrictions)
- Financial info: Land lease in place (yes) through 2070, monthly amount recorded as 0.0
- HOA & community: Association: Garden Isles #4; Monthly association fee of $510; Association includes maintenance of structure, pest control, sewer, trash, water, common areas, elevator, roof repairs, and pool service; Community amenities: elevator(s), laundry, picnic area, parking, pool (heated), storage
Exterior
- Parking: Assigned parking; Guest parking; Open parking (1 space)
- Utilities: Public water; Public sewer; Cable available; Electricity available; Water available; Sewer available
- Home design: Stock cooperative; Resale condition; 3-story building; Faces south; Building name: Garden Isles Apt 4
- Construction: Stucco and CBS construction; Flat roof; Approximately built area 1,000 (public records)
- Exterior features: Screened porch; Porch; Not waterfront
Interior
- Kitchen: Electric range; Microwave; Refrigerator; Electric water heater
- Bedrooms: 2 bedrooms on the main level
- Flooring: Carpet; Tile
- Bathrooms: 2 full bathrooms on the main level
- Heating & cooling: Central electric heating; Central air conditioning; Ceiling fans
- Interior features: Walk-in closets; Closet cabinetry; Furnished
- Laundry & utility: Common area laundry; Hallway laundry; Multiple laundry locations
Neighborhood map
What this means for you Summary
Snapshot
- This is a 2-bed/1.0-bath condo listed at $125k.
Deal economics
- At list price, monthly cash flow is $132 ($2k/yr) — positive.
- The deal already cash-flows at list — no discount required.
- Meets the 1% rule at list price ($2k rent vs $125k).
- Recommended offer: $121k (3.0% below list) — sets the bar for market timing.
- Cap rate 9.0% vs local median 3.1% in Pompano Beach — top-decile yield for the area; either an underpriced asset or a hidden risk that comps aren't pricing in. Stress-test before assuming the spread holds.
Location & tenants
- Location reads 74/100 on livability (#284 in FL, #4,541 nationally) — a middle-class / working-renter tenant base. Strengths: commute A+, housing A+, cost of living B+; Watch: employment D+, amenities F.
- Broward (suburban): math 42% / reading 53% proficiency, ranked #46 of 73 in FL (top 63%) — families likely to look elsewhere, expect single-tenant / working-renter base with shorter leases.
- Zoned schools: Mcnab Elementary School (math 51% / reading 63%, grade C+, #781 of 2,144 statewide, top 38%, 614 students, 56% FRL); Pompano Beach Middle School (math 29% / reading 40%, grade F, #421 of 571 statewide, top 74%, 1,040 students, 73% FRL); Blanche Ely High School (math 7% / reading 29%, grade F, #570 of 667 statewide, top 86%, 1,906 students, 75% FRL) — zoned schools average 68% FRL vs 51% district-wide (17 pts higher); higher-poverty schools than district average — tighter screening recommended.
- Market conditions: Rents rising (+2.1%/yr); 338 active listings in the ZIP; 40 comparable units currently listed for rent nearby; rentals at typical pace (median 24d on market — plan ~3-4 weeks tenant-placement turnaround); 2,111 units permitted in Broward County in 2024 (1,265 in 5+ unit buildings).
- This rent runs 42% of the median local income ($65k/yr) — at the standard rent-burdened threshold; future hikes will face affordability resistance.
Forward outlook
- Local home prices are declining (-3.0%/yr); year-one equity from $864 of loan paydown is wiped out by about $4k of value loss. Plan a longer hold.
- Broward County population projected at +34% by 2050 — long-run rental-demand tailwind backs the buy-and-hold thesis.
Negotiation context
- It's been on market 38 days — a 3% lower offer ($121k) is reasonable based on typical stale-listing flexibility.
- 2 sale attempts; this cycle's ask has dropped $10k (7%) from the opening price — seller is motivated, your offer sets the floor, not the list.
Risks & watch-outs
- Watch-outs: property tax is 2.6% of price; flood insurance adds $152/mo; HOA is 23% of rent.
- Climate carrying-cost: in FEMA flood zone AH (mandatory federal flood insurance); severe wind risk, 99% chance of damaging wind over 30y; extreme-heat days projected 7→27/yr by 2055 (HVAC capex compounding) — expect insurance premiums to compound above CPI over the hold.
Questions for the listing agent
- It's been on market 38 days. Have you received any prior offers? Is the seller open to a 3% concession, seller financing, or rate buy-down credit?
- Built in 1971 — when were the roof, HVAC, electrical panel, plumbing, and water heater last replaced?
- Property tax is high relative to price — has the assessment been appealed recently, and will the sale trigger a re-assessment?
- What's the actual annual flood-insurance premium (NFIP or private), and is the property in a SFHA with mandatory coverage?
- What does the HOA fee cover, when was the last increase, and are there any pending special assessments or reserve-fund shortfalls?
- Any open or pending special assessments — roof, HVAC, plumbing, elevator, façade? What's the per-unit balance and payoff schedule, and is the seller paying it off at close or rolling it to the buyer?
- Is there a deadline driving the sale (1031 exchange, divorce, estate, relocation)? That informs how much negotiation room exists.
- Schools are D-rated, which usually means shorter tenancies and higher turnover. Who's the typical renter profile here, and what's been the actual vacancy rate?
- What's the average days-on-market for RENTAL listings here right now (not sales)? A rising rental-DOM trend means longer vacancies and softer asking-rent achievability than the comps imply.
- What's the recent tenant-quality profile in this submarket — average credit score on applications, eviction rate, late-payment / NSF rate, and stable-employment percentage? A property-management company in the area should have these aggregated.
- How much new apartment / multifamily construction is in the pipeline within 1–3 miles? Heavy new supply (>2% of stock underway) typically softens rents 12–24 months out; light construction supports rent growth.
Investment metrics
- 1% rule
- 1.79% ✓
- Cap rate
- 9.02%
- Cash-on-cash
- 9.73%
- DSCR
- 1.43
- GRM
- 4.6
CMA / ARV
No comps found within radius.
Projected returns pro-forma
-3.0% appreciation · 2.12% rent growth · sell at horizon
- IRR
- -10.6%
- Equity multiple
- 0.62×
- Total profit
- $-13,328
- Equity at exit
- $18,638
- IRR
- -3.0%
- Equity multiple
- 0.81×
- Total profit
- $-6,670
- Equity at exit
- $10,808
Cash invested: $35,000 (down + closing). Projections, not guarantees.
Landlord ↔ Tenant lean methodology
- Overall (STATE)
- 87 Strongly Landlord-Friendly
- State Florida
- 87 Strongly Landlord-Friendly · R+3
- County
- — inherits STATE
- City
- — inherits STATE
ZIP-level market 33060
- Home prices YoY
- -23.6%
- Rents YoY
- 2.1%
- Active inventory
- 338
- Price-to-rent
- 4.6×
Monthly cashflow live
- Estimated rent
- $2,243 high interval (Pro) →
- Mortgage (P&I)
- −$656
- Tax from tax record
- −$270 /mo · $3,246/yr
- Insurance
- −$52
- Flood insurance flood zone
- −$152 /mo · $1,824/yr
- HOA
- −$510
- Vacancy / Maint / Mgmt
- −$471
- Net cashflow
- $132
Break-even live
UW: 25.0% down · 7.5% · 30yr · 1.5% tax · 5.0% vac · 8.0% maint · 8.0% mgmt
Financing live
Cash to close
- Down payment
- $31,250
- Closing costs
- $3,750
- Reserves months
- —
- Total cash needed
- —
Loan-product check · same deal, 3 products live
Conventional
25% down · 7.5% · 30yr
- Down + closing
- —
- Monthly P&I
- —
- Monthly cashflow
- —
- DSCR
- —
- Eligible?
- —
Personal DTI + credit; lowest rate.
DSCR
20% down · 8.5% · 30yr
- Down + closing
- —
- Monthly P&I
- —
- Monthly cashflow
- —
- DSCR
- —
- Eligible?
- —
No personal income docs; deal must DSCR.
Hard money
10% down · 12.0% · 12mo
- Down + closing
- —
- Monthly P&I
- —
- Monthly cashflow
- —
- DSCR
- —
- Eligible?
- —
Short-term bridge; refi at stabilization.
Rent comps 40 comps
| Address | Beds | Baths | Sqft | Rent | $/sqft | DOM | Units | Dist |
|---|---|---|---|---|---|---|---|---|
| 101 SE 6th Ave Pompano Beach, FL | 1.0–2.0 | 1.5–2.0 | 939 | $2,099 | $2.24 | 24d | 3 | 0.06mi |
| 651 Pine Dr Pompano Beach, FL | 2.0 | 2.0 | 1000 | $2,000 | $2.00 | 24d | 1 | 0.06mi |
| 151 SE 6th Ave Pompano Beach, FL | 1.0 | 1.5 | 700 | $1,525 | $2.18 | 24d | 2 | 0.08mi |
| 201 SE 6th Ave #7 Pompano Beach, FL | 2.0 | 2.0 | 939 | $1,900 | $2.02 | 24d | 1 | 0.09mi |
| 475 SE 1st St Pompano Beach, FL | 3.0 | 1.0–2.0 | 1017 | $3,711 | $3.65 | 1d | 19 | 0.13mi |
| 241 SE 9th Ave Pompano Beach, FL | 2.0 | 2.0 | 725 | $1,800 | $2.48 | 11d | 2 | 0.18mi |
| 840 Pine Dr #103 Pompano Beach, FL | 2.0 | 2.0 | 904 | $2,800 | $3.10 | 24d | 1 | 0.26mi |
| 305 SE 11th Ave Unit D Pompano Beach, FL | 3.0 | 2.0 | 1000 | $2,400 | $2.40 | 16d | 1 | 0.30mi |
| 320 SE 10th Ave Unit D Pompano Beach, FL | 2.0 | 2.0 | 1000 | $2,300 | $2.30 | 24d | 1 | 0.30mi |
| 912 Pine Dr #211 Pompano Beach, FL | 2.0 | 2.0 | 949 | $1,900 | $2.00 | 24d | 1 | 0.31mi |
| 132 S Cypress Rd #523 Pompano Beach, FL | 2.0 | 2.0 | 936 | $2,000 | $2.14 | 24d | 1 | 0.32mi |
| 138 S Cypress Rd #224 Pompano Beach, FL | 2.0 | 2.0 | 936 | $2,600 | $2.78 | 14d | 1 | 0.36mi |
| 344 SE 11th Ave #8 Pompano Beach, FL | 1.0 | 1.0 | 600 | $1,500 | $2.50 | 24d | 1 | 0.39mi |
| 260 S Cypress Rd #108 Pompano Beach, FL | 2.0 | 2.0 | 850 | $1,900 | $2.24 | 15d | 1 | 0.41mi |
| 270 S Cypress Rd #204 Pompano Beach, FL | 1.0 | 1.5 | 650 | $1,600 | $2.46 | 11d | 1 | 0.41mi |
| 270 S Cypress Rd #204 Pompano Beach, FL | 1.0 | 1.5 | 650 | $1,650 | $2.54 | 11d | 1 | 0.41mi |
| 1261 NE 2nd St Pompano Beach, FL | 2.0 | 1.0 | 1010 | $2,650 | $2.62 | 22d | 1 | 0.41mi |
| 280 S Cypress Rd #310 Pompano Beach, FL | 1.0 | 1.0 | 650 | $1,700 | $2.62 | 24d | 1 | 0.43mi |
| 1100 Pine Dr #102 Pompano Beach, FL | 2.0 | 2.0 | 950 | $2,100 | $2.21 | 24d | 1 | 0.43mi |
| 13 SW 3rd St #13 Pompano Beach, FL | 2.0 | 1.5 | 1040 | $2,400 | $2.31 | 24d | 1 | 0.44mi |
| 200 NE 1st Ave Pompano Beach, FL | 2.0 | 1.0–2.5 | 1149 | $3,600 | $3.13 | 2d | 47 | 0.47mi |
| 81 SW 3rd St Unit 81 Pompano Beach, FL | 2.0 | 1.5 | 1040 | $2,100 | $2.02 | 24d | 1 | 0.48mi |
| 253 S Cypress Rd #214 Pompano Beach, FL | 1.0 | 1.0 | 678 | $1,450 | $2.14 | 24d | 1 | 0.52mi |
| 508 NE 12th Ave Pompano Beach, FL | 2.0 | 1.0 | 1038 | $2,500 | $2.41 | 5d | 1 | 0.52mi |
| 29 NE 15th Ave Pompano Beach, FL | 2.0 | 1.0 | 900 | $1,450 | $1.61 | 15d | 1 | 0.53mi |
| 55 SW 3rd St Pompano Beach, FL | 2.0 | 1.0 | 1040 | $2,500 | $2.40 | 24d | 1 | 0.55mi |
| 812 NE 4th Ave Pompano Beach, FL | 2.0 | 2.0 | 1056 | $3,000 | $2.84 | 15d | 1 | 0.59mi |
| 308 NE 8th Ct Pompano Beach, FL | 3.0 | 1.0 | 576 | $2,700 | $4.69 | 24d | 1 | 0.60mi |
| 810 NE 3rd Ave Pompano Beach, FL | 2.0 | 1.0 | 650 | $2,900 | $4.46 | 1d | 1 | 0.61mi |
| 810 NE 3rd Ave Pompano Beach, FL | 2.0 | 1.0 | 650 | $3,000 | $4.62 | 10d | 1 | 0.61mi |
| 721 NE 12th Ave Unit 1-2 Pompano Beach, FL | 2.0 | 1.0 | 700 | $2,550 | $3.64 | 24d | 1 | 0.62mi |
| 147 SW 3rd St Pompano Beach, FL | 2.0 | 1.5 | 1040 | $2,500 | $2.40 | 7d | 1 | 0.62mi |
| 100 NW 8th St Pompano Beach, FL | 2.0 | 2.0 | 1024 | $2,175 | $2.12 | 24d | 1 | 0.67mi |
| 909 NE 10th Ave Unit 2 Pompano Beach, FL | 2.0 | 2.0 | 592 | $1,950 | $3.29 | 24d | 1 | 0.69mi |
| 832 NE 12th Ave Unit 1 Pompano Beach, FL | 2.0 | 2.0 | 1000 | $2,499 | $2.50 | 24d | 1 | 0.71mi |
| 23 NE 19th Ave Pompano Beach, FL | 1.0 | 1.0 | 900 | $2,500 | $2.78 | 7d | 1 | 0.75mi |
| 313 SW 1st Ct Unit L4 Pompano Beach, FL | 2.0 | 2.0 | 855 | $2,300 | $2.69 | 3d | 1 | 0.75mi |
| 313 SW 1st Ct Unit L4 Pompano Beach, FL | 2.0 | 2.0 | 855 | $2,500 | $2.92 | 4d | 1 | 0.75mi |
| 320 SW 1st St Pompano Beach, FL | 2.0 | 2.0 | 870 | $1,850 | $2.13 | 24d | 1 | 0.76mi |
| 8 SE 19th Ave #11 Pompano Beach, FL | 2.0 | 1.0 | 842 | $1,795 | $2.13 | 24d | 1 | 0.76mi |
HOA detail condo
- Monthly dues
- $510 · $6,120/yr
- Likely covers
- waterpoolparking
- Assessments
- None detected in remarks — confirm with the listing agent.
Listing history 14 events
-
2026-06-13statusdays on market $125,000 Pending 38 DOM
-
2026-06-09days on market $125,000 Active 36 DOM
-
2026-06-08days on market $125,000 Active 35 DOM
-
2026-06-07days on market $125,000 Active 34 DOM
-
2026-06-04days on market $125,000 Active 31 DOM
-
2026-06-03days on market $125,000 Active 30 DOM
-
2026-06-02days on market $125,000 Active 29 DOM
-
2026-06-01days on market $125,000 Active 28 DOM
-
2026-05-31days on market $125,000 Active 27 DOM
-
2026-05-20price $125,000
-
2026-05-04$135,000 Active
-
2026-04-03price $132,500
-
2025-12-20historical
-
2025-10-15$135,000 Active
ⓘ Source: listings_history table (triggers on properties + properties_extension) + one-shot
backfill from property_details.listing_events for pre-trigger history.
Tax reassessment forecast FL · Resets to sale price
- Current annual tax
- $3,246 · $270/mo
- Projected year-2 tax
- $3,246 · $270/mo
- Expected delta
- $0/yr ($0/mo · 0.0%)
ⓘ Screening estimate from a state-policy table — verify with the county assessor before closing.
Climate risk First Street
- Flood 3/10 Moderate FEMA zone AH · 12% chance over 30 yrs
- Wildfire 1/10 Low
- Heat 10/10 Extreme 7 d/yr ≥106°F today · 27 d/yr by 30 yrs out
- Wind 10/10 Extreme 99% chance of damaging wind over 30 yrs
- Air quality 2/10 Low 1 unhealthy d/yr today · 2 by 30 yrs out
Nearby sold comps map
Loading sold comps map…
Walkable amenities ~0.75 mi
Loading nearby amenities…
Taxation est. · year 1
- Rental income
- $26,913
- − Mortgage interest
- −$7,002
- − Property taxes
- −$3,246
- − Insurance
- −$2,450
- − Repairs & maintenance
- −$2,153
- − Management
- −$2,153
- − HOA
- −$6,120
- − Depreciation
- −$3,636
- Taxable income
- $153
- Est. tax owed @ 24.0%
- −$37
- After-tax cash flow
- $1,543/yr
For passive investors: Depreciation is non-cash, so a rental often shows a tax loss while cash-flowing — sheltering income. Rental losses are passive: they offset passive income freely, and up to $25,000/yr can offset ordinary (W-2) income if you actively participate and your MAGI is under $100k (phasing out to $0 by $150k); unused losses carry forward. On sale, claimed depreciation is recaptured at up to 25%, and gains may owe capital-gains tax (a 1031 exchange can defer both). Figures are a year-1 estimate at your 24.0% rate — not tax advice; consult a CPA.
Schools (NCES district)
- District
- Broward
- NCES district ID
- 1200180
- Math proficiency
- 42% ▼ -18.00%
- Reading proficiency
- 53% ▼ -5.00%
- Median HH income
- $52,139
- Composite
- 40.88/100
- National rank
- #3621
- State rank
- #46 of 73 in FL
Livability — Pompano Beach
- Score
- 74/100
- State rank
- #284
- US rank
- #4541
Category grades
Schools grade is shown separately in the Schools card above.
Census & demographics
- Census place
- Pompano Beach, FL
- County
- Broward County · 1,963,430 people
- City population
- 155,861
- Metro
- Miami-Fort Lauderdale-Pompano Beach, FL
- Population (ZIP)
- 37,233
- Household income
- $64,819
- Rent vs Own
- Severe rent burden
- 2870.0
Population outlook (Broward County) Hauer SSP2
- Today (2025)
- 2,207,033 people
- By 2030
- 2,360,704 · +7.0%
- By 2040
- 2,661,208 · +20.6%
- By 2050
- 2,946,698 · +33.5%
- By 2075
- 3,602,273 · +63.2%
- By 2100
- 3,970,984 · +79.9%
Race, ethnicity, and origin ACS 2023
- Neighborhood character
- Diverse neighborhood (Simpson 0.69)
- Race & ethnicity
- Black 38% White 33% Hispanic / Latino 26% Two or more races 14%
- Hispanic origin (detail)
- Mexican 9% Puerto Rican 2% Cuban 3% Dominican 1%
- Common ancestry
- Hispanic 13% Romanian 2% Slovak 1%
- Foreign-born
- 31% · Canada, Jamaica
- Languages at home
- 60% English-only · Spanish 23% French/Haitian/Cajun 13% Other Indo-European 2%
Political lean MEDSL · Broward
- 2024 margin
- D (+17.0) · D 58.0% · R 41.0%
- 2008→2024 swing
- -17.8pp toward R · 2008: 34.7pp · 2024: 17.0pp
- All cycles
- 2024: D+17.0 2020: D+29.8 2016: D+35.0 2012: D+34.9 2008: D+34.7
Not yet ingested
- Civics
- —
Market trends
- HPI YoY
- ▼ -131.09%
- Current HPI
- 425.3083
- Rent YoY
- ▲ 2.12%
- Metro
- Miami-Fort Lauderdale-Pompano Beach, FL
- State GDP YoY
- ▲ 3.28%
- F500 in state
- 36
Industry mix (Fortune 500 HQ in FL)
| Industry | F500 HQs | Revenue |
|---|---|---|
| Industrial Technology | 2 | $29B |
|
||
| Insurance | 2 | $17B |
|
||
| Retail | 1 | $60B |
|
||
| Technology Distribution | 1 | $58B |
|
||
| Homebuilding | 1 | $35B |
|
||
| Technology Manufacturing | 1 | $35B |
|
||
Price history
-7.4% since first listed5 events — show timeline
- 2026-05-20 Price Changed $125,000 Beaches MLS
- 2026-05-04 Listed $135,000 Beaches MLS
- 2026-04-03 Price Changed $132,500 Beaches MLS
- 2025-12-20 Listing Removed — Beaches MLS
- 2025-10-15 Listed $135,000 Beaches MLS
Property tax history
+13.1%/yrLatest (2025): $3,246 · +7.7% YoY. Source: county tax records.
Cash-flow waterfall
monthlySold comps — $/sqft
last 12 mo · ≤1 miLoading sold comps…