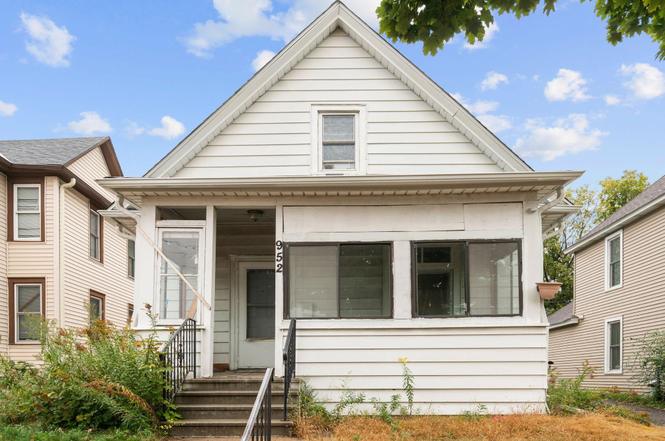
952 Western Ave N · St. Paul, MN
Flood risk 1/10 · Minimal
- FEMA flood zone
- X (unshaded)
- Chance of flooding over 30 yrs
- 0.0%
- Est. flood insurance / yr
- $473 – $860
Fire risk 1/10 · Minimal
- Est. fire insurance / yr
- $888 – $1,650
Heat risk 2/10 · Minimal
- Hot days now (above 99°F)
- 7 days/yr
- Hot days in 30 yrs
- 14 days/yr
Wind risk 2/10 · Minimal
- Chance of severe wind over 30 yrs
- —
Air-quality risk 2/10 · Minimal
- Unhealthy air days now
- 1 days/yr
- Unhealthy air days in 30 yrs
- 1 days/yr
Risk factors via First Street. Map © Google.
Why this score? — see what drove the B- grade
The composite is a weighted blend of 9 inputs, each scored 0–100. Each bar is that input's sub-score; the figure is the points it added to the 100-point composite (weight × sub-score).
- Cash flow +29.8/30.0
- DSCR +10.0/10.0
- 1% rule +9.0/10.0
- ARV discount +7.5/15.0
- Rent growth +3.4/5.0
- Livability +2.5/5.0
- Condition / age +2.5/5.0
- Schools +2.4/10.0
- Appreciation +0.0/10.0
$179,900
🖨 Deal sheet (PDF) 📄 Offer letter ✓ Due diligence
Listing remarks MLS
2 bed, 1 bath. Front and back porches. Off street parking. Affordable living!
Key facts
- Updated kitchen
- Ample cabinet space
- 4,356 sq ft lot
Tags
Property features AI
Exterior
- Parking: Asphalt parking
- Utilities: City water connected; City sewer connected; Natural gas
- Home design: Residential property; One and one-half stories; Block foundation
- Construction: Block foundation
- Exterior features: Vinyl exterior; Front porch; Rear porch; Storage shed; Light tree coverage; Located within 6 blocks of public transit; City street with curbs, paved streets and sidewalks
Interior
- Kitchen: Dishwasher; Range; Microwave; Refrigerator; Kitchen window
- Bedrooms: 2 bedrooms (one on upper level); Loft on upper level
- Flooring: Hardwood floors; Tile floors
- Bathrooms: 1 full bathroom (upper level); 1 three-quarter bathroom (basement)
- Heating & cooling: Forced air heating; Window cooling units
- Interior features: Ceiling fan(s); Hardwood floors; Kitchen window; Local area network; Porches (front and rear); Tile floors; Separate/formal dining room; Full basement
- Laundry & utility: Washer; Dryer located in basement
Neighborhood map
What this means for you Summary
Snapshot
- This is a 3-bed/1.5-bath single-family listed at $180k.
Deal economics
- At list price, monthly cash flow is $658 ($8k/yr) — positive.
- The deal already cash-flows at list — no discount required.
- Meets the 1% rule at list price ($3k rent vs $180k).
- Recommended offer: $164k (9.0% below list) — sets the bar for market timing.
Location & tenants
- Location reads: area grade B — affects rentability + tenant quality, not the cash-flow math above.
- St. Paul Public School District (urban): math 21% / reading 33% proficiency, ranked #270 of 301 in MN (top 90%) — low school quality limits family demand, transient renter base, plan for 1-2y turnover; 64% free/reduced lunch — lower-income household profile, screen leases tightly.
- Zoned schools: Paul & Sheila Wellstone Elementary (math 8% / reading 17%, grade F, #800 of 857 statewide, top 95%, 507 students, 85% FRL); Murray Middle School (math 19% / reading 40%, grade F, #204 of 258 statewide, top 80%, 538 students, 64% FRL); Como Park Senior High (math 8% / reading 42%, grade F, #375 of 471 statewide, top 81%, 1,078 students, 75% FRL).
- Market conditions: Rents rising (+3.6%/yr); 175 active listings in the ZIP; 2 comparable units currently listed for rent nearby; 1,202 units permitted in Ramsey County in 2024 (880 in 5+ unit buildings).
- This rent runs 43% of the median local income ($71k/yr) — at the standard rent-burdened threshold; future hikes will face affordability resistance.
Forward outlook
- Local home prices are declining (-3.0%/yr); year-one equity from $1k of loan paydown is wiped out by about $5k of value loss. Plan a longer hold.
- Ramsey County population projected at +27% by 2050 — long-run rental-demand tailwind backs the buy-and-hold thesis.
- At projected returns (-3.0% appreciation + 3.6% rent growth), your $50k cash investment doubles in ~8 years — after that, you're playing with house money.
Negotiation context
- It's been on market 99 days — a 9% lower offer ($164k) is reasonable based on typical stale-listing flexibility.
- 10 sale attempts since 32y ago; this cycle's ask has dropped $15k (8%) from the opening price — seller is motivated, your offer sets the floor, not the list.
- Current owner paid $42k; list at $180k implies a 328% gain — meaningful room to come down on a strong offer.
Risks & watch-outs
- Watch-outs: built in 1902 — expect roof / HVAC / electrical / plumbing capex.
Questions for the listing agent
- It's been on market 99 days. Have you received any prior offers? Is the seller open to a 9% concession, seller financing, or rate buy-down credit?
- Built in 1902 — when were the roof, HVAC, electrical panel, plumbing, and water heater last replaced?
- Why hasn't it sold? Are there any deal-killer items the seller is aware of (foundation, flood, title, zoning, code violations)?
- Is there a deadline driving the sale (1031 exchange, divorce, estate, relocation)? That informs how much negotiation room exists.
- What's the average days-on-market for RENTAL listings here right now (not sales)? A rising rental-DOM trend means longer vacancies and softer asking-rent achievability than the comps imply.
- What's the recent tenant-quality profile in this submarket — average credit score on applications, eviction rate, late-payment / NSF rate, and stable-employment percentage? A property-management company in the area should have these aggregated.
- How much new for-sale + rental construction is in the pipeline within 1–3 miles? Heavy new supply typically softens prices + rents 12–24 months out; constrained supply supports both.
Investment metrics
- 1% rule
- 1.40% ✓
- Cap rate
- 10.68%
- Cash-on-cash
- 15.67%
- DSCR
- 1.70
- GRM
- 6.0
CMA / ARV
No comps found within radius.
Projected returns pro-forma
-3.0% appreciation · 3.6% rent growth · sell at horizon
- IRR
- 7.2%
- Equity multiple
- 1.28×
- Total profit
- $14,351
- Equity at exit
- $26,824
- IRR
- 17.1%
- Equity multiple
- 2.45×
- Total profit
- $73,133
- Equity at exit
- $15,554
Cash invested: $50,372 (down + closing). Projections, not guarantees.
Landlord ↔ Tenant lean methodology
- Overall (STATE)
- 46 Balanced
- State Minnesota
- 46 Balanced · D+2
- County
- — inherits STATE
- City
- — inherits STATE
ZIP-level market 55117
- Rents YoY
- 3.6%
- Active inventory
- 175
- Price-to-rent
- 6.0×
Monthly cashflow live
- Estimated rent
- $2,512 medium interval (Pro) →
- Mortgage (P&I)
- −$943
- Tax from tax record
- −$308 /mo · $3,702/yr
- Insurance
- −$75
- HOA
- −$0
- Vacancy / Maint / Mgmt
- −$528
- Net cashflow
- $658
Break-even live
Sensitivity live
| Price | -10% $760 | -5% $709 | +0% $658 | +5% $607 | +10% $556 |
|---|---|---|---|---|---|
| Rent | -10% $459 | -5% $558 | +0% $658 | +5% $757 | +10% $856 |
| Rate | -1.0pp $748 | -0.5pp $703 | base $658 | +0.5pp $611 | +1.0pp $564 |
UW: 25.0% down · 7.5% · 30yr · 1.5% tax · 5.0% vac · 8.0% maint · 8.0% mgmt
Financing live
Cash to close
- Down payment
- $44,975
- Closing costs
- $5,397
- Reserves months
- —
- Total cash needed
- —
Loan-product check · same deal, 3 products live
Conventional
25% down · 7.5% · 30yr
- Down + closing
- —
- Monthly P&I
- —
- Monthly cashflow
- —
- DSCR
- —
- Eligible?
- —
Personal DTI + credit; lowest rate.
DSCR
20% down · 8.5% · 30yr
- Down + closing
- —
- Monthly P&I
- —
- Monthly cashflow
- —
- DSCR
- —
- Eligible?
- —
No personal income docs; deal must DSCR.
Hard money
10% down · 12.0% · 12mo
- Down + closing
- —
- Monthly P&I
- —
- Monthly cashflow
- —
- DSCR
- —
- Eligible?
- —
Short-term bridge; refi at stabilization.
Rent comps 2 comps
| Address | Beds | Baths | Sqft | Rent | $/sqft | DOM | Units | Dist |
|---|---|---|---|---|---|---|---|---|
| 1443 Saint Albans St N Saint Paul, MN | 4.0 | 2.0 | 1500 | $2,700 | $1.80 | 19d | 1 | 1.20mi |
| 255 Western Ave N Saint Paul, MN | 3.0 | 1.0–2.0 | 1049 | $3,700 | $3.53 | 3d | 23 | 1.45mi |
Listing history 30 events
-
2026-05-06status Pending
-
2026-04-21historical Contingent - Inspection
-
2026-03-17price $179,900
-
2026-02-10price $189,900
-
2026-01-27$194,900 Active
-
2026-01-26historical
-
2025-12-11price $199,000
-
2025-11-13price $207,000
-
2025-10-23$215,000 Active
-
2014-10-10soldstatus $42,000 Sold 77-char remark
Show marketing remark (77 chars)
2 bed, 1 bath. Front and back porches. Off street parking. Affordable living!
-
2014-10-10soldstatus $42,000
Show marketing remark (77 chars)
2 bed, 1 bath. Front and back porches. Off street parking. Affordable living!
-
2014-10-10soldstatus $42,000
Show marketing remark (77 chars)
2 bed, 1 bath. Front and back porches. Off street parking. Affordable living!
-
2014-09-24status Pending 77-char remark
Show marketing remark (77 chars)
2 bed, 1 bath. Front and back porches. Off street parking. Affordable living!
-
2014-09-16historical Contingent - Inspection 77-char remark
Show marketing remark (77 chars)
2 bed, 1 bath. Front and back porches. Off street parking. Affordable living!
-
2014-09-09status Active 77-char remark
Show marketing remark (77 chars)
2 bed, 1 bath. Front and back porches. Off street parking. Affordable living!
-
2014-09-09price $49,300 77-char remark
Show marketing remark (77 chars)
2 bed, 1 bath. Front and back porches. Off street parking. Affordable living!
-
2014-09-04historical Contingent - Inspection 77-char remark
Show marketing remark (77 chars)
2 bed, 1 bath. Front and back porches. Off street parking. Affordable living!
-
2014-08-14status Active 77-char remark
Show marketing remark (77 chars)
2 bed, 1 bath. Front and back porches. Off street parking. Affordable living!
-
2014-08-13historical Contingent - Inspection 77-char remark
Show marketing remark (77 chars)
2 bed, 1 bath. Front and back porches. Off street parking. Affordable living!
-
2014-07-15$56,000 Active 77-char remark
Show marketing remark (77 chars)
2 bed, 1 bath. Front and back porches. Off street parking. Affordable living!
-
2014-07-15$49,300
Show marketing remark (77 chars)
2 bed, 1 bath. Front and back porches. Off street parking. Affordable living!
-
2014-07-15$49,300
Show marketing remark (77 chars)
2 bed, 1 bath. Front and back porches. Off street parking. Affordable living!
-
2010-06-22soldstatus $64,000
-
2010-06-16soldstatus $64,000
-
2010-05-04historical
-
2010-04-19$69,900
-
2009-10-31historical
-
2008-08-21$69,900
-
1994-12-17historical
-
1994-11-19$53,900
ⓘ Source: listings_history table (triggers on properties + properties_extension) + one-shot
backfill from property_details.listing_events for pre-trigger history.
Tax reassessment forecast MN · Partial reset (capped growth)
- Current annual tax
- $3,702 · $308/mo
- Projected year-2 tax
- $3,702 · $308/mo
- Expected delta
- $0/yr ($0/mo · 0.0%)
ⓘ Screening estimate from a state-policy table — verify with the county assessor before closing.
Climate risk First Street
- Flood 1/10 Low FEMA zone X (unshaded) · 0% chance over 30 yrs
- Wildfire 1/10 Low
- Heat 2/10 Low 7 d/yr ≥99°F today · 14 d/yr by 30 yrs out
- Wind 2/10 Low
- Air quality 2/10 Low 1 unhealthy d/yr today · 1 by 30 yrs out
Nearby sold comps map
Loading sold comps map…
Walkable amenities ~0.75 mi
Loading nearby amenities…
Taxation est. · year 1
- Rental income
- $30,145
- − Mortgage interest
- −$10,077
- − Property taxes
- −$3,702
- − Insurance
- −$900
- − Repairs & maintenance
- −$2,412
- − Management
- −$2,412
- − Depreciation
- −$5,233
- Taxable income
- $5,410
- Est. tax owed @ 24.0%
- −$1,298
- After-tax cash flow
- $6,594/yr
For passive investors: Depreciation is non-cash, so a rental often shows a tax loss while cash-flowing — sheltering income. Rental losses are passive: they offset passive income freely, and up to $25,000/yr can offset ordinary (W-2) income if you actively participate and your MAGI is under $100k (phasing out to $0 by $150k); unused losses carry forward. On sale, claimed depreciation is recaptured at up to 25%, and gains may owe capital-gains tax (a 1031 exchange can defer both). Figures are a year-1 estimate at your 24.0% rate — not tax advice; consult a CPA.
Schools (NCES district)
- District
- St. Paul Public School District
- NCES district ID
- 2733840
- Math proficiency
- 21% ▼ -11.00%
- Reading proficiency
- 33% ▼ -7.00%
- Median HH income
- $48,316
- Composite
- 23.51/100
- National rank
- #7868
- State rank
- #270 of 301 in MN
Livability — St. Paul
No livability data for this city. (Only ~50 U.S. cities are tracked.)
Census & demographics
- Census place
- St. Paul, MN
- County
- Ramsey County · 542,837 people
- City population
- 280,599
- Metro
- Minneapolis-St. Paul-Bloomington, MN-WI
- Population (ZIP)
- 44,697
- Household income
- $70,771
- Rent vs Own
- Severe rent burden
- 1588.0
Population outlook (Ramsey County) Hauer SSP2
- Today (2025)
- 603,431 people
- By 2030
- 636,459 · +5.5%
- By 2040
- 700,596 · +16.1%
- By 2050
- 765,819 · +26.9%
- By 2075
- 929,297 · +54.0%
- By 2100
- 1,053,924 · +74.7%
Race, ethnicity, and origin ACS 2023
- Neighborhood character
- Highly diverse neighborhood (Simpson 0.72)
- Race & ethnicity
- White 44% Asian 24% Black 15% Hispanic / Latino 10% Two or more races 10%
- Hispanic origin (detail)
- Mexican 7%
- Common ancestry
- Portuguese 6% Romanian 3% Lithuanian 2%
- Foreign-born
- 21% · Canada, Philippines, India
- Languages at home
- 68% English-only · Other Asian/Pacific 15% Spanish 8% Other Indo-European 2%
Political lean MEDSL · Ramsey
- 2024 margin
- Solid D (+43.3) · D 70.5% · R 27.2% · Other 2.3%
- 2008→2024 swing
- +9.4pp toward D · 2008: 33.9pp · 2024: 43.3pp
- All cycles
- 2024: D+43.3 2020: D+45.4 2016: D+39.4 2012: D+35.3 2008: D+33.9
Not yet ingested
- Civics
- —
Market trends
- HPI YoY
- ▼ -308.56%
- Current HPI
- 267.4216
- Rent YoY
- ▲ 3.60%
- Metro
- Minneapolis-St. Paul-Bloomington, MN-WI
- State GDP YoY
- ▲ 2.41%
- F500 in state
- 34
Industry mix (Fortune 500 HQ in MN)
| Industry | F500 HQs | Revenue |
|---|---|---|
| Healthcare | 2 | $407B |
|
||
| Retail | 2 | $150B |
|
||
| Consumer Goods | 2 | $32B |
|
||
| Industrial Machinery | 2 | $6B |
|
||
| Agriculture | 1 | $40B |
|
||
| Healthcare / Medical Devices | 1 | $32B |
|
||
Price history
+233.8% since first listed30 events — show timeline
- 2026-05-06 Pending — NORTHSTARMLS as Distributed by MLS Grid
- 2026-04-21 Contingent — NORTHSTARMLS as Distributed by MLS Grid
- 2026-03-17 Price Changed $179,900 NORTHSTARMLS as Distributed by MLS Grid
- 2026-02-10 Price Changed $189,900 NORTHSTARMLS as Distributed by MLS Grid
- 2026-01-27 Listed $194,900 NORTHSTARMLS as Distributed by MLS Grid
- 2026-01-26 Listing Removed — NORTHSTARMLS as Distributed by MLS Grid
- 2025-12-11 Price Changed $199,000 NORTHSTARMLS as Distributed by MLS Grid
- 2025-11-13 Price Changed $207,000 NORTHSTARMLS as Distributed by MLS Grid
- 2025-10-23 Listed $215,000 NORTHSTARMLS as Distributed by MLS Grid
- 2014-10-10 Sold (MLS) $42,000 RASM
- 2014-10-10 Sold (MLS) $42,000 LSAR
- 2014-10-10 Sold (MLS) $42,000 NORTHSTARMLS as Distributed by MLS Grid
- 2014-09-24 Pending — NORTHSTARMLS as Distributed by MLS Grid
- 2014-09-16 Contingent — NORTHSTARMLS as Distributed by MLS Grid
- 2014-09-09 Relisted — NORTHSTARMLS as Distributed by MLS Grid
- 2014-09-09 Price Changed $49,300 NORTHSTARMLS as Distributed by MLS Grid
- 2014-09-04 Contingent — NORTHSTARMLS as Distributed by MLS Grid
- 2014-08-14 Relisted — NORTHSTARMLS as Distributed by MLS Grid
- 2014-08-13 Contingent — NORTHSTARMLS as Distributed by MLS Grid
- 2014-07-15 Listed $56,000 NORTHSTARMLS as Distributed by MLS Grid
- 2014-07-15 Listed $49,300 RASM
- 2014-07-15 Listed $49,300 LSAR
- 2010-06-22 Sold (Public Records) $64,000 Public Records
- 2010-06-16 Sold (MLS) $64,000 NORTHSTARMLS as Distributed by MLS Grid
- 2010-05-04 Listing Removed — NORTHSTARMLS as Distributed by MLS Grid
- 2010-04-19 Listed $69,900 NORTHSTARMLS as Distributed by MLS Grid
- 2009-10-31 Listing Removed — NORTHSTARMLS as Distributed by MLS Grid
- 2008-08-21 Listed $69,900 NORTHSTARMLS as Distributed by MLS Grid
- 1994-12-17 Listing Removed — NORTHSTARMLS as Distributed by MLS Grid
- 1994-11-19 Listed $53,900 NORTHSTARMLS as Distributed by MLS Grid
Property tax history
+11.6%/yrLatest (2025): $3,702 · +14.4% YoY. Source: county tax records.
Cash-flow waterfall
monthlySold comps — $/sqft
last 12 mo · ≤1 miLoading sold comps…