 🏗️ New Construction
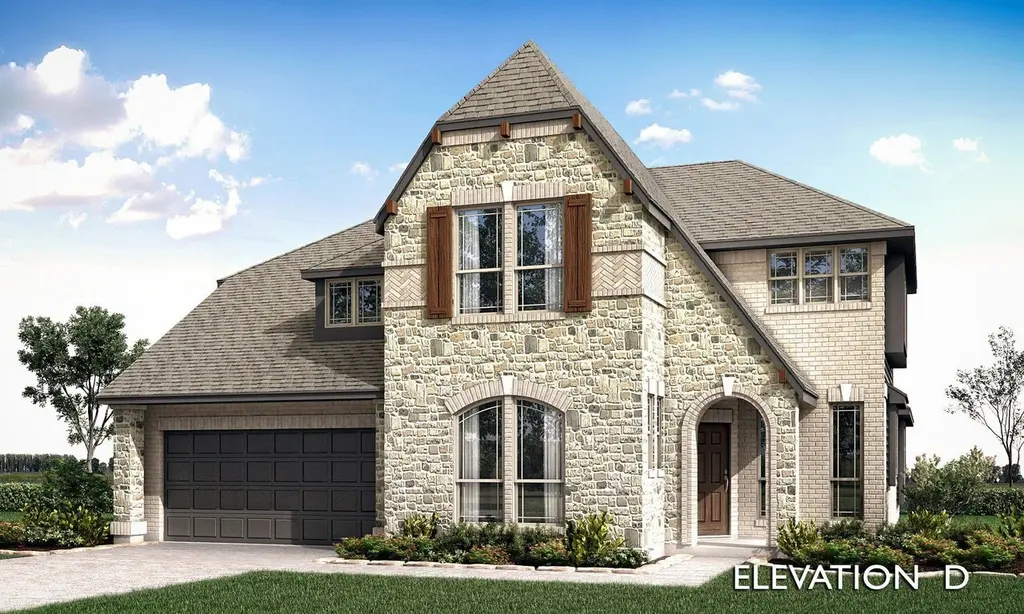
Magnolia Plan · DeSoto, TX
Flood risk 1/10 · Minimal
- FEMA flood zone
- X (unshaded)
- Chance of flooding over 30 yrs
- 0.0%
- Est. flood insurance / yr
- $507 – $1,088
Fire risk 1/10 · Minimal
- Est. fire insurance / yr
- $1,222 – $2,270
Heat risk 7/10 · Major
- Hot days now (above 110°F)
- 7 days/yr
- Hot days in 30 yrs
- 25 days/yr
Wind risk 6/10 · Moderate
- Chance of severe wind over 30 yrs
- 27.0%
Air-quality risk 3/10 · Minor
- Unhealthy air days now
- 2 days/yr
- Unhealthy air days in 30 yrs
- 3 days/yr
Risk factors via First Street. Map © Google.
Why this score? — see what drove the F grade
The composite is a weighted blend of 9 inputs, each scored 0–100. Each bar is that input's sub-score; the figure is the points it added to the 100-point composite (weight × sub-score).
- Cash flow +7.5/30.0
- ARV discount +7.5/15.0
- Condition / age +4.0/5.0
- Livability +3.3/5.0
- 1% rule +2.2/10.0
- Schools +2.2/10.0
- Rent growth +1.9/5.0
- DSCR +1.7/10.0
- Appreciation +0.0/10.0
$508,990
🖨 Deal sheet (PDF) 📄 Offer letter ✓ Due diligence
Listing remarks MLS
The Classic Series Magnolia floor plan is a two-story home with five bedrooms and two and a half bathrooms. Features of this plan include a covered porch, formal dining, a large family room, an optional study, an open kitchen with custom cabinets and an island, a primary suite with a walk-in closet and garden tub, and an upstairs game room. Contact us or visit our model home for more information about building this plan.
Key facts
- Covered porch
- Walk-in closet
- Upstairs game room
Tags
Neighborhood map
What this means for you Summary
Snapshot
- This is a 4-bed/2.5-bath single-family listed at $509k. Condition is rated good.
Deal economics
- At list price, monthly cash flow is $-723 ($-9k/yr) — negative.
- To cash-flow at today's rent, offer at most $486k (4.4% below list).
- To meet the 1% rule (rent ≥ 1% of price), the offer needs to be $425k (16.4% below list).
- Recommended offer: $425k (16.4% below list) — sets the bar for 1% rule.
- Cap rate 4.8% vs local median 3.4% in DeSoto — top-decile yield for the area; either an underpriced asset or a hidden risk that comps aren't pricing in. Stress-test before assuming the spread holds.
Location & tenants
- Location reads 66/100 on livability (#589 in TX) — a middle-class / working-renter tenant base. Strengths: cost of living A+, housing A+; Watch: schools D+, amenities F, commute F.
- Duncanville ISD (suburban): math 20% / reading 29% proficiency, ranked #711 of 826 in TX (top 86%) — low school quality limits family demand, transient renter base, plan for 1-2y turnover; 68% free/reduced lunch — lower-income household profile, screen leases tightly.
- Market conditions: Rents soft (-2.6%/yr); 475 active listings in the ZIP; 2 comparable units currently listed for rent nearby; solid renter incomes; 12,577 units permitted in Dallas County in 2024 (6,829 in 5+ unit buildings).
- At $4,255/mo this rent would consume 62% of the median local household income ($83k/yr) (locally 1867% of renters already pay >50% of income on rent) — very limited rent-growth headroom before tenants either downsize or default.
Forward outlook
- Local home prices are declining (-3.0%/yr); year-one equity from $4k of loan paydown is wiped out by about $18k of value loss. Plan a longer hold.
- Dallas County population projected at +35% by 2050 — long-run rental-demand tailwind backs the buy-and-hold thesis.
Negotiation context
- It's been on market 773 days — a 12% lower offer ($448k) is reasonable based on typical stale-listing flexibility.
- 3 sale attempts since 2y ago with the ask held roughly flat each time — persistent listings suggest the price (not the market) is what's stuck; bring a comps-based counter.
Risks & watch-outs
- Climate carrying-cost: major wind risk, 27% chance of damaging wind over 30y; extreme-heat days projected 7→25/yr by 2055 (HVAC capex compounding) — expect insurance premiums to compound above CPI over the hold.
Questions for the listing agent
- What do current leases actually rent for vs. the listed asking? Can we see a recent rent roll and the last 12 months of T-12 income?
- It's been on market 773 days. Have you received any prior offers? Is the seller open to a 16% concession, seller financing, or rate buy-down credit?
- Why hasn't it sold? Are there any deal-killer items the seller is aware of (foundation, flood, title, zoning, code violations)?
- Is there a deadline driving the sale (1031 exchange, divorce, estate, relocation)? That informs how much negotiation room exists.
- Schools are D-rated, which usually means shorter tenancies and higher turnover. Who's the typical renter profile here, and what's been the actual vacancy rate?
- The area grade is low — what's the realistic commute time and amenity access for the typical tenant pool here? Any planned neighborhood developments (good or bad) we should know about?
- What's the average days-on-market for RENTAL listings here right now (not sales)? A rising rental-DOM trend means longer vacancies and softer asking-rent achievability than the comps imply.
- What's the recent tenant-quality profile in this submarket — average credit score on applications, eviction rate, late-payment / NSF rate, and stable-employment percentage? A property-management company in the area should have these aggregated.
- How much new for-sale + rental construction is in the pipeline within 1–3 miles? Heavy new supply typically softens prices + rents 12–24 months out; constrained supply supports both.
Investment metrics
- 1% rule
- 0.72% ✗
- Cap rate
- 4.83%
- Cash-on-cash
- -5.24%
- DSCR
- 0.77
- GRM
- 11.6
CMA / ARV
- ARV (median comp)
- $590,955
- List price
- $508,990
- Delta
- -13.87%
- Verdict
- UNDERPRICED
- Comps
- 20 within 1.0 mi
Show comp detail 12 sales within ~0.75 mi
| Address | Dist | Beds/Ba | Sqft | Sold | Price | $/sf | Match |
|---|---|---|---|---|---|---|---|
| 938 Vista Ln | 0.10mi | 4/2.5 | 2,783 (-13%) | 4mo | $475,000 | $171 | 70 |
| 2100 Homestead Dr | 0.12mi | 4/2.5 | 2,799 (-12%) | 4mo | $499,000 | $178 | 70 |
| 936 Homestead Dr | 0.22mi | 4/2.5 | 2,828 (-11%) | 2mo | $478,000 | $169 | 69 |
| 2036 Flora Ln | 0.23mi | 5/3.5 (+1) | 3,261 (+2%) | 11mo | $549,000 | $168 | 68 |
| 933 Homestead Dr | 0.18mi | 4/2.5 | 2,773 (-13%) | 5mo | $510,000 | $184 | 66 |
| 2037 Picnic Crk | 0.18mi | 4/4.0 | 3,479 (+9%) | 8mo | $598,900 | $172 | 63 |
| 816 Yosemite Dr | 0.57mi | 5/3.5 (+1) | 3,261 (+2%) | 1mo | $499,000 | $153 | 59 |
| 2032 Picnic Crk | 0.21mi | 5/4.0 (+1) | 3,558 (+12%) | 3mo | $565,367 | $159 | 57 |
| 1860 Masters Dr | 0.67mi | 4/3.5 | 3,196 (+0%) | 10mo | $589,999 | $185 | 56 |
| 2034 Cascades Ct | 0.46mi | 4/3.5 | 3,527 (+11%) | 5mo | $528,000 | $150 | 53 |
| 2009 Holland Dr | 0.28mi | 5/4.0 (+1) | 3,558 (+12%) | 8mo | $573,000 | $161 | 50 |
| 833 Yosemite Dr | 0.53mi | 5/4.0 (+1) | 3,557 (+12%) | 5mo | $549,173 | $154 | 40 |
Match score weights: distance 35% · size 25% · config 20% · recency 20%. Top-matched comps best support the ARV.
Projected returns pro-forma
-3.0% appreciation · 0.0% rent growth · sell at horizon
- IRR
- -28.6%
- Equity multiple
- 0.07×
- Total profit
- $-154,196
- Equity at exit
- $88,113
- IRR
- -45.5%
- Equity multiple
- -0.46×
- Total profit
- $-241,470
- Equity at exit
- $51,095
Cash invested: $165,467 (down + closing). Projections, not guarantees.
Landlord ↔ Tenant lean methodology
- Overall (STATE)
- 87 Strongly Landlord-Friendly
- State Texas
- 87 Strongly Landlord-Friendly · R+5
- County
- — inherits STATE
- City
- — inherits STATE
ZIP-level market 75115
- Rents YoY
- -2.6%
- Active inventory
- 475
- Price-to-rent
- 10.0×
Monthly cashflow live
- Estimated rent
- $4,255 medium interval (Pro) →
- Mortgage (P&I)
- −$3,099
- Tax est. 1.5%
- −$739 /mo · $8,864/yr
- Insurance
- −$246
- HOA
- −$0
- Vacancy / Maint / Mgmt
- −$893
- Net cashflow
- $-723
Break-even live
Sensitivity live
| Price | -10% $-314 | -5% $-519 | +0% $-723 | +5% $-927 | +10% $-1,131 |
|---|---|---|---|---|---|
| Rent | -10% $-1,059 | -5% $-891 | +0% $-723 | +5% $-555 | +10% $-387 |
| Rate | -1.0pp $-425 | -0.5pp $-572 | base $-723 | +0.5pp $-876 | +1.0pp $-1,032 |
UW: 25.0% down · 7.5% · 30yr · 1.5% tax · 5.0% vac · 8.0% maint · 8.0% mgmt
Financing live
Cash to close
- Down payment
- $147,739
- Closing costs
- $17,729
- Reserves months
- —
- Total cash needed
- —
Loan-product check · same deal, 3 products live
Conventional
25% down · 7.5% · 30yr
- Down + closing
- —
- Monthly P&I
- —
- Monthly cashflow
- —
- DSCR
- —
- Eligible?
- —
Personal DTI + credit; lowest rate.
DSCR
20% down · 8.5% · 30yr
- Down + closing
- —
- Monthly P&I
- —
- Monthly cashflow
- —
- DSCR
- —
- Eligible?
- —
No personal income docs; deal must DSCR.
Hard money
10% down · 12.0% · 12mo
- Down + closing
- —
- Monthly P&I
- —
- Monthly cashflow
- —
- DSCR
- —
- Eligible?
- —
Short-term bridge; refi at stabilization.
Rent comps 2 comps
| Address | Beds | Baths | Sqft | Rent | $/sqft | DOM | Units | Dist |
|---|---|---|---|---|---|---|---|---|
| 907 Saint George Pl Desoto, TX | 4.0 | 2.5 | 2600 | $3,500 | $1.35 | 0d | 1 | 1.02mi |
| 1424 Cobblestone Dr Desoto, TX | 5.0 | 3.0 | 2667 | $8,950 | $3.36 | 24d | 1 | 1.39mi |
Listing history 18 events
-
2026-06-21days on market $508,990 Active 773 DOM
-
2026-06-18days on market $508,990 Active 770 DOM
-
2026-06-17days on market $508,990 Active 769 DOM
-
2026-06-16days on market $508,990 Active 768 DOM
-
2026-06-15days on market $508,990 Active 767 DOM
-
2026-06-13days on market $508,990 Active 765 DOM
-
2026-06-13days on market $508,990 Active 764 DOM
-
2026-06-09days on market $508,990 Active 761 DOM
-
2026-06-08days on market $508,990 Active 760 DOM
-
2026-06-07days on market $508,990 Active 759 DOM
-
2026-06-04days on market $508,990 Active 756 DOM
-
2026-06-03days on market $508,990 Active 755 DOM
-
2026-06-02days on market $508,990 Active 754 DOM
-
2026-06-01days on market $508,990 Active 753 DOM
-
2026-05-31days on market $508,990 Active 752 DOM
-
2024-05-10$508,990 Active 424-char remark
Show marketing remark (424 chars)
The Classic Series Magnolia floor plan is a two-story home with five bedrooms and two and a half bathrooms. Features of this plan include a covered porch, formal dining, a large family room, an optional study, an open kitchen with custom cabinets and an island, a primary suite with a walk-in closet and garden tub, and an upstairs game room. Contact us or visit our model home for more information about building this plan.
-
2024-05-09$488,990 Active 424-char remark
Show marketing remark (424 chars)
The Classic Series Magnolia floor plan is a two-story home with five bedrooms and two and a half bathrooms. Features of this plan include a covered porch, formal dining, a large family room, an optional study, an open kitchen with custom cabinets and an island, a primary suite with a walk-in closet and garden tub, and an upstairs game room. Contact us or visit our model home for more information about building this plan.
-
2024-04-11$508,990 Active
ⓘ Source: listings_history table (triggers on properties + properties_extension) + one-shot
backfill from property_details.listing_events for pre-trigger history.
Climate risk First Street
- Flood 1/10 Low FEMA zone X (unshaded) · 0% chance over 30 yrs
- Wildfire 1/10 Low
- Heat 7/10 Severe 7 d/yr ≥110°F today · 25 d/yr by 30 yrs out
- Wind 6/10 Major 27% chance of damaging wind over 30 yrs
- Air quality 3/10 Moderate 2 unhealthy d/yr today · 3 by 30 yrs out
Nearby sold comps map
Loading sold comps map…
Walkable amenities ~0.75 mi
Loading nearby amenities…
Taxation est. · year 1
- Rental income
- $51,057
- − Mortgage interest
- −$33,103
- − Property taxes
- −$8,864
- − Insurance
- −$2,955
- − Repairs & maintenance
- −$4,085
- − Management
- −$4,085
- − Depreciation
- −$17,191
- Taxable loss
- −$19,226
- Est. tax savings @ 24.0%
- +$4,614
- After-tax cash flow
- $-4,059/yr
For passive investors: Depreciation is non-cash, so a rental often shows a tax loss while cash-flowing — sheltering income. Rental losses are passive: they offset passive income freely, and up to $25,000/yr can offset ordinary (W-2) income if you actively participate and your MAGI is under $100k (phasing out to $0 by $150k); unused losses carry forward. On sale, claimed depreciation is recaptured at up to 25%, and gains may owe capital-gains tax (a 1031 exchange can defer both). Figures are a year-1 estimate at your 24.0% rate — not tax advice; consult a CPA.
Condition & rehab AI · 12 photos
This two-story Magnolia plan is in good condition with modern finishes and a well-maintained exterior. Minor updates to paint and landscaping would significantly enhance its curb appeal and value.
Value-add opportunities
- Both Painting exterior and interior walls — Fresh paint enhances curb appeal and interior aesthetics
- Both Landscaping improvements — Enhances curb appeal and adds value
- Both Replace window treatments — Modernize and improve energy efficiency
Renovation cost estimate screening
Value-add ROI direction
- Both Painting exterior and interior walls — Fresh paint enhances curb appeal and interior aesthetics ↑
- Both Landscaping improvements — Enhances curb appeal and adds value ↑
- Both Replace window treatments — Modernize and improve energy efficiency ↑
ⓘ Cost ranges are severity-bucket heuristics (US national rule-of-thumb). Get contractor quotes + a written scope before underwriting a rehab budget.
Schools (NCES district)
- District
- Duncanville ISD
- NCES district ID
- 4817640
- Math proficiency
- 20% ▼ -19.00%
- Reading proficiency
- 29% ▼ -7.00%
- Median HH income
- $50,979
- Composite
- 21.71/100
- National rank
- #8270
- State rank
- #711 of 826 in TX
Livability — DeSoto
- Score
- 66/100
- State rank
- #589
- US rank
- #11236
Category grades
Schools grade is shown separately in the Schools card above.
Census & demographics
- Census place
- DeSoto, TX
- County
- Dallas County · 2,612,404 people
- City population
- 56,211
- Metro
- Dallas-Fort Worth-Arlington, TX
- Population (ZIP)
- 56,211
- Household income
- $82,782
- Rent vs Own
- Severe rent burden
- 1867.0
Population outlook (Dallas County) Hauer SSP2
- Today (2025)
- 2,979,839 people
- By 2030
- 3,191,823 · +7.1%
- By 2040
- 3,619,611 · +21.5%
- By 2050
- 4,026,915 · +35.1%
- By 2075
- 4,957,073 · +66.4%
- By 2100
- 5,508,725 · +84.9%
Race, ethnicity, and origin ACS 2023
- Neighborhood character
- Predominantly Black (68%)
- Race & ethnicity
- Black 68% Hispanic / Latino 19% Two or more races 11% White 8%
- Hispanic origin (detail)
- Mexican 17%
- Common ancestry
- Swedish 1%
- Foreign-born
- 9% · Canada, Dominican Republic
- Languages at home
- 83% English-only · Spanish 15% French/Haitian/Cajun 1%
Political lean MEDSL · Dallas
- 2024 margin
- Strong D (+22.2) · D 60.2% · R 38.0% · Other 1.8%
- 2008→2024 swing
- +6.9pp toward D · 2008: 15.3pp · 2024: 22.2pp
- All cycles
- 2024: D+22.2 2020: D+31.6 2016: D+26.2 2012: D+15.4 2008: D+15.3
Not yet ingested
- Civics
- —
Market trends
- HPI YoY
- ▼ -170.49%
- Current HPI
- 272.1565
- Rent YoY
- ▼ -2.60%
- Metro
- Dallas-Fort Worth-Arlington, TX
- State GDP YoY
- ▲ 3.95%
- F500 in state
- 110
Industry mix (Fortune 500 HQ in TX)
| Industry | F500 HQs | Revenue |
|---|---|---|
| Energy | 16 | $1,198B |
|
||
| Technology | 5 | $198B |
|
||
| Engineering / Construction | 4 | $72B |
|
||
| Energy Services | 3 | $60B |
|
||
| Utilities | 3 | $41B |
|
||
| Healthcare | 2 | $330B |
|
||
Price history
+0.0% since first listed3 events — show timeline
- 2024-05-10 Listed $508,990 Zillow
- 2024-05-09 Listed $488,990 Zillow
- 2024-04-11 Listed $508,990 Zillow
Cash-flow waterfall
monthlySold comps — $/sqft
last 12 mo · ≤1 miLoading sold comps…