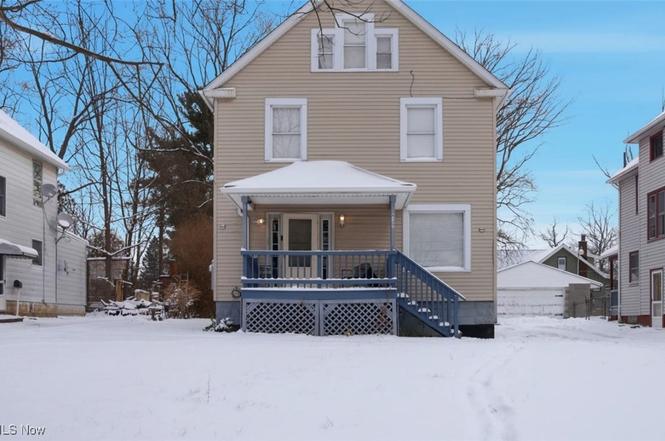
4127 Southern Blvd · Youngstown, OH
Flood risk 1/10 · Minimal
- FEMA flood zone
- X (unshaded)
- Chance of flooding over 30 yrs
- 0.0%
- Est. flood insurance / yr
- $473 – $860
Fire risk 1/10 · Minimal
- Est. fire insurance / yr
- $713 – $1,323
Heat risk 3/10 · Minor
- Hot days now (above 97°F)
- 7 days/yr
- Hot days in 30 yrs
- 17 days/yr
Wind risk 1/10 · Minimal
- Chance of severe wind over 30 yrs
- —
Air-quality risk 2/10 · Minimal
- Unhealthy air days now
- 1 days/yr
- Unhealthy air days in 30 yrs
- 2 days/yr
Risk factors via First Street. Map © Google.
Why this score? — see what drove the D+ grade
The composite is a weighted blend of 9 inputs, each scored 0–100. Each bar is that input's sub-score; the figure is the points it added to the 100-point composite (weight × sub-score).
- Cash flow +17.0/30.0
- ARV discount +11.9/15.0
- DSCR +5.3/10.0
- Rent growth +4.1/5.0
- Livability +4.0/5.0
- 1% rule +3.6/10.0
- Condition / age +2.5/5.0
- Schools +0.9/10.0
- Appreciation +0.0/10.0
$145,000
🖨 Deal sheet (PDF) 📄 Offer letter ✓ Due diligence
Listing remarks
This home offers the perfect blend of convenience and functionality. Upon arriving through the covered front porch, you are immediately welcomed by a stunning staircase in the entryway, complimented by the warm Luxury Vinyl Plank flooring and abundant natural light. The spacious well appointed kitchen is ideal for everyday living and entertaining offering plenty of room to prepare your favorite culinary creations and hosting guests. Just off the kitchen the formal dining room features large windows that flood the space with sunlight, creating the perfect setting for gatherings. A convenient first floor full bathroom completes the main level. The second floor offers three generously sized be
Key facts
- Covered front porch
- Large windows
- Formal dining room
Tags
Property features AI
Finance
- Other: Below-grade finished area approximately 727 (source: assessor); Above-grade finished area approximately 1,673 (source: assessor); Lot about 0.201 acres (assessor)
Exterior
- Parking: Shared driveway
- Utilities: Public water; Public sewer
- Home design: Vinyl-sided exterior
- Construction: Asphalt and fiberglass roof; Built (year from public records)
- Exterior features: Front porch; Rear porch
Interior
- Bedrooms: 7 total rooms (bedroom count not specified)
- Bathrooms: 2 full bathrooms; 1 main-level bathroom
- Heating & cooling: Forced air heating; Ceiling fans for cooling
- Interior features: Full basement
- Laundry & utility: Laundry located in the basement
Neighborhood map
What this means for you Summary
Snapshot
- This is a 4-bed/2.0-bath single-family listed at $145k.
Deal economics
- At list price, monthly cash flow is $99 ($1k/yr) — positive.
- The deal already cash-flows at list — no discount required.
- To meet the 1% rule (rent ≥ 1% of price), the offer needs to be $124k (14.4% below list).
- Recommended offer: $124k (14.4% below list) — sets the bar for 1% rule.
Location & tenants
- Location reads 81/100 on livability (#99 in OH, #1,506 nationally) — a professional / high-income tenant draw. Strengths: amenities A+, commute A+, cost of living A+; Watch: crime F, employment F.
- Youngstown City (urban): math 8% / reading 17% proficiency, ranked #649 of 656 in OH (top 99%) — low school quality limits family demand, transient renter base, plan for 1-2y turnover; 88% free/reduced lunch — lower-income household profile, screen leases tightly.
- Market conditions: Rents rising fast (+6.6%/yr); 138 active listings in the ZIP; 3 comparable units currently listed for rent nearby; rentals at typical pace (median 23d on market — plan ~3-4 weeks tenant-placement turnaround); 147 units permitted in Mahoning County in 2024 (0 in 5+ unit buildings).
Forward outlook
- Local home prices are declining (-3.0%/yr); year-one equity from $1k of loan paydown is wiped out by about $4k of value loss. Plan a longer hold.
- Mahoning County population projected at -14% by 2050 — secular population decline; favor cash flow + early exit over multi-decade hold.
Negotiation context
- It's been on market 184 days — a 12% lower offer ($128k) is reasonable based on typical stale-listing flexibility.
- 5 sale attempts since 24y ago with the ask held roughly flat each time — persistent listings suggest the price (not the market) is what's stuck; bring a comps-based counter.
- Current owner paid $67k; list at $145k implies a 116% gain — meaningful room to come down on a strong offer.
Risks & watch-outs
- Watch-outs: built in 1907 — expect roof / HVAC / electrical / plumbing capex.
Questions for the listing agent
- It's been on market 184 days. Have you received any prior offers? Is the seller open to a 14% concession, seller financing, or rate buy-down credit?
- Built in 1907 — when were the roof, HVAC, electrical panel, plumbing, and water heater last replaced?
- Why hasn't it sold? Are there any deal-killer items the seller is aware of (foundation, flood, title, zoning, code violations)?
- Is there a deadline driving the sale (1031 exchange, divorce, estate, relocation)? That informs how much negotiation room exists.
- Crime grade is F in this area — have there been break-ins, vandalism, or insurance claims at this property in the last 3 years? What carrier currently insures it and at what premium?
- The area grade is low — what's the realistic commute time and amenity access for the typical tenant pool here? Any planned neighborhood developments (good or bad) we should know about?
- What's the average days-on-market for RENTAL listings here right now (not sales)? A rising rental-DOM trend means longer vacancies and softer asking-rent achievability than the comps imply.
- What's the recent tenant-quality profile in this submarket — average credit score on applications, eviction rate, late-payment / NSF rate, and stable-employment percentage? A property-management company in the area should have these aggregated.
- How much new for-sale + rental construction is in the pipeline within 1–3 miles? Heavy new supply typically softens prices + rents 12–24 months out; constrained supply supports both.
Investment metrics
- 1% rule
- 0.86% ✗
- Cap rate
- 7.11%
- Cash-on-cash
- 2.93%
- DSCR
- 1.13
- GRM
- 9.7
CMA / ARV
- ARV (on-the-fly)
- $160,608
- Comps found
- 12
Show comp detail 12 sales within ~0.75 mi
| Address | Dist | Beds/Ba | Sqft | Sold | Price | $/sf | Match |
|---|---|---|---|---|---|---|---|
| 15 Vermont Ave | 0.26mi | 4/2.0 | 1,674 (+0%) | 5mo | $143,500 | $86 | 84 |
| 72 Labelle Ave | 0.31mi | 4/1.5 | 1,716 (+3%) | 1mo | $40,100 | $23 | 79 |
| 3919 Rush Blvd | 0.45mi | 4/2.0 | 1,510 (-10%) | 3mo | $154,000 | $102 | 60 |
| 123 Prestwick Dr | 0.56mi | 3/1.5 (-1) | 1,671 (-0%) | 8mo | $194,500 | $116 | 60 |
| 4019 Euclid Blvd | 0.50mi | 4/2.0 | 1,776 (+6%) | 10mo | $169,950 | $96 | 58 |
| 4312 Helena Ave | 0.17mi | 3/1.0 (-1) | 1,454 (-13%) | 4mo | $135,000 | $93 | 58 |
| 3412 Hudson Ave | 0.72mi | 3/1.5 (-1) | 1,716 (+3%) | 2mo | $60,250 | $35 | 53 |
| 86 Terrace Dr | 0.54mi | 4/2.0 | 1,472 (-12%) | 2mo | $89,986 | $61 | 53 |
| 175 Homestead Dr | 0.66mi | 3/1.5 (-1) | 1,500 (-10%) | 6mo | $175,000 | $117 | 40 |
| 82 Terrace Dr | 0.53mi | 3/1.5 (-1) | 1,440 (-14%) | 8mo | $162,500 | $113 | 38 |
| 3946 Sunset Dr | 0.55mi | 3/1.0 (-1) | 1,452 (-13%) | 8mo | $130,000 | $90 | 36 |
| 4018 Windsor Rd | 0.66mi | 3/2.5 (-1) | 1,910 (+14%) | 4mo | $265,000 | $139 | 35 |
Match score weights: distance 35% · size 25% · config 20% · recency 20%. Top-matched comps best support the ARV.
Projected returns pro-forma
-3.0% appreciation · 6.56% rent growth · sell at horizon
- IRR
- -8.2%
- Equity multiple
- 0.69×
- Total profit
- $-12,631
- Equity at exit
- $21,620
- IRR
- 5.0%
- Equity multiple
- 1.42×
- Total profit
- $17,245
- Equity at exit
- $12,537
Cash invested: $40,600 (down + closing). Projections, not guarantees.
Landlord ↔ Tenant lean methodology
- Overall (STATE)
- 73 Landlord-Friendly
- State Ohio
- 73 Landlord-Friendly · R+6
- County
- — inherits STATE
- City
- — inherits STATE
ZIP-level market 44512
- Home prices YoY
- -21.0%
- Rents YoY
- 6.6%
- Active inventory
- 138
- Price-to-rent
- 9.7×
Monthly cashflow live
- Estimated rent
- $1,241 medium interval (Pro) →
- Mortgage (P&I)
- −$760
- Tax from tax record
- −$61 /mo · $730/yr
- Insurance
- −$60
- HOA
- −$0
- Vacancy / Maint / Mgmt
- −$261
- Net cashflow
- $99
Break-even live
Sensitivity live
| Price | -10% $181 | -5% $140 | +0% $99 | +5% $58 | +10% $17 |
|---|---|---|---|---|---|
| Rent | -10% $1 | -5% $50 | +0% $99 | +5% $148 | +10% $197 |
| Rate | -1.0pp $172 | -0.5pp $136 | base $99 | +0.5pp $62 | +1.0pp $23 |
UW: 25.0% down · 7.5% · 30yr · 1.5% tax · 5.0% vac · 8.0% maint · 8.0% mgmt
Financing live
Cash to close
- Down payment
- $36,250
- Closing costs
- $4,350
- Reserves months
- —
- Total cash needed
- —
Loan-product check · same deal, 3 products live
Conventional
25% down · 7.5% · 30yr
- Down + closing
- —
- Monthly P&I
- —
- Monthly cashflow
- —
- DSCR
- —
- Eligible?
- —
Personal DTI + credit; lowest rate.
DSCR
20% down · 8.5% · 30yr
- Down + closing
- —
- Monthly P&I
- —
- Monthly cashflow
- —
- DSCR
- —
- Eligible?
- —
No personal income docs; deal must DSCR.
Hard money
10% down · 12.0% · 12mo
- Down + closing
- —
- Monthly P&I
- —
- Monthly cashflow
- —
- DSCR
- —
- Eligible?
- —
Short-term bridge; refi at stabilization.
Rent comps 3 comps
| Address | Beds | Baths | Sqft | Rent | $/sqft | DOM | Units | Dist |
|---|---|---|---|---|---|---|---|---|
| 158 Beechwood Dr Youngstown, OH | 3.0 | 1.5 | 1438 | $1,100 | $0.76 | 15d | 1 | 0.45mi |
| 236 Hilton Ave Youngstown, OH | 4.0 | 1.5 | 1488 | $1,195 | $0.80 | 23d | 1 | 0.50mi |
| 457 Mathews Rd Boardman, OH | 3.0 | 1.0 | 1200 | $1,300 | $1.08 | 45d | 1 | 1.49mi |
Listing history 30 events
-
2026-06-21days on market $145,000 Active 184 DOM
-
2026-06-19days on market $145,000 Active 182 DOM
-
2026-06-18days on market $145,000 Active 181 DOM
-
2026-06-17days on market $145,000 Active 180 DOM
-
2026-06-16days on market $145,000 Active 179 DOM
-
2026-06-13days on market $145,000 Active 178 DOM
-
2026-06-10days on market $145,000 Active 176 DOM
-
2026-06-09days on market $145,000 Active 175 DOM
-
2026-06-08days on market $145,000 Active 174 DOM
-
2026-06-07days on market $145,000 Active 173 DOM
-
2026-06-03days on market $145,000 Active 169 DOM
-
2026-06-02days on market $145,000 Active 168 DOM
-
2026-06-01days on market $145,000 Active 167 DOM
-
2026-05-31days on market $145,000 Active 166 DOM
-
2026-05-30days on market $145,000 Active 165 DOM
-
2026-03-16price $145,000
-
2026-01-24price $145,900
-
2025-12-17$149,900 Active
-
2024-04-02soldstatus $67,000
-
2011-01-15historical
-
2010-09-15$18,200
-
2010-08-31historical
-
2010-04-21$18,200
-
2004-07-01soldstatus $64,000
-
2003-02-26soldstatus $6,000
-
2002-10-16$12,500
-
2002-10-03historical
-
2002-05-06$20,000
-
1997-07-21soldstatus $25,900
-
1984-11-01soldstatus $27,500
ⓘ Source: listings_history table (triggers on properties + properties_extension) + one-shot
backfill from property_details.listing_events for pre-trigger history.
Tax reassessment forecast OH · Partial reset (capped growth)
- Current annual tax
- $730 · $61/mo
- Projected year-2 tax
- $1,496 · $125/mo
- Expected delta
- +$766/yr (+$64/mo · 105.0%)
ⓘ Screening estimate from a state-policy table — verify with the county assessor before closing.
Climate risk First Street
- Flood 1/10 Low FEMA zone X (unshaded) · 0% chance over 30 yrs
- Wildfire 1/10 Low
- Heat 3/10 Moderate 7 d/yr ≥97°F today · 17 d/yr by 30 yrs out
- Wind 1/10 Low
- Air quality 2/10 Low 1 unhealthy d/yr today · 2 by 30 yrs out
Nearby sold comps map
Loading sold comps map…
Walkable amenities ~0.75 mi
Loading nearby amenities…
Taxation est. · year 1
- Rental income
- $14,898
- − Mortgage interest
- −$8,122
- − Property taxes
- −$730
- − Insurance
- −$725
- − Repairs & maintenance
- −$1,192
- − Management
- −$1,192
- − Depreciation
- −$4,218
- Taxable loss
- −$1,281
- Est. tax savings @ 24.0%
- +$307
- After-tax cash flow
- $1,497/yr
For passive investors: Depreciation is non-cash, so a rental often shows a tax loss while cash-flowing — sheltering income. Rental losses are passive: they offset passive income freely, and up to $25,000/yr can offset ordinary (W-2) income if you actively participate and your MAGI is under $100k (phasing out to $0 by $150k); unused losses carry forward. On sale, claimed depreciation is recaptured at up to 25%, and gains may owe capital-gains tax (a 1031 exchange can defer both). Figures are a year-1 estimate at your 24.0% rate — not tax advice; consult a CPA.
Schools (NCES district)
- District
- Youngstown City
- NCES district ID
- 3904516
- Math proficiency
- 8% ▼ -15.00%
- Reading proficiency
- 17% ▼ -10.00%
- Median HH income
- $25,257
- Composite
- 9.29/100
- National rank
- #9858
- State rank
- #649 of 656 in OH
Livability — Youngstown
- Score
- 81/100
- State rank
- #99
- US rank
- #1506
Category grades
Schools grade is shown separately in the Schools card above.
Census & demographics
- Census place
- Youngstown, OH
- County
- Mahoning County · 84,956 people
- City population
- 28,503
- Metro
- Youngstown-Warren-Boardman, OH-PA
- Population (ZIP)
- 32,536
- Household income
- $63,317
- Rent vs Own
- Severe rent burden
- 910.0
Population outlook (Mahoning County) Hauer SSP2
- Today (2025)
- 223,932 people
- By 2030
- 218,387 · -2.5%
- By 2040
- 205,367 · -8.3%
- By 2050
- 193,606 · -13.5%
- By 2075
- 173,694 · -22.4%
- By 2100
- 151,147 · -32.5%
Race, ethnicity, and origin ACS 2023
- Neighborhood character
- Predominantly White (81%)
- Race & ethnicity
- White 81% Black 9% Two or more races 6% Hispanic / Latino 5%
- Hispanic origin (detail)
- Mexican 1% Puerto Rican 2%
- Common ancestry
- Romanian 6% Lithuanian 1% Slovak 1%
- Foreign-born
- 4% · Canada
- Languages at home
- 94% English-only · Spanish 2% Arabic 2% Other Indo-European 1%
Political lean MEDSL · Mahoning
- 2024 margin
- Lean R (+9.4) · D 44.9% · R 54.4%
- 2008→2024 swing
- -36.1pp toward R · 2008: 26.6pp · 2024: -9.4pp
- All cycles
- 2024: R+9.4 2020: R+1.9 2016: D+3.0 2012: D+27.7 2008: D+26.6
Not yet ingested
- Civics
- —
Market trends
- HPI YoY
- ▼ -56.75%
- Current HPI
- 213.1446
- Rent YoY
- ▲ 6.56%
- Metro
- Youngstown-Warren-Boardman, OH-PA
- State GDP YoY
- ▲ 1.98%
- F500 in state
- 48
Industry mix (Fortune 500 HQ in OH)
| Industry | F500 HQs | Revenue |
|---|---|---|
| Insurance | 3 | $145B |
|
||
| Industrial Machinery | 3 | $49B |
|
||
| Financial Services | 3 | $24B |
|
||
| Consumer Goods | 2 | $93B |
|
||
| Aerospace / Defense | 2 | $47B |
|
||
| Utilities | 2 | $33B |
|
||
Price history
+427.3% since first listed15 events — show timeline
- 2026-03-16 Price Changed $145,000 MLSNOW
- 2026-01-24 Price Changed $145,900 MLSNOW
- 2025-12-17 Listed $149,900 MLSNOW
- 2024-04-02 Sold (Public Records) $67,000 Public Records
- 2011-01-15 Listing Removed — MLSNOW
- 2010-09-15 Listed $18,200 MLSNOW
- 2010-08-31 Listing Removed — MLSNOW
- 2010-04-21 Listed $18,200 MLSNOW
- 2004-07-01 Sold (Public Records) $64,000 Public Records
- 2003-02-26 Sold (MLS) $6,000 MLSNOW
- 2002-10-16 Listed $12,500 MLSNOW
- 2002-10-03 Listing Removed — MLSNOW
- 2002-05-06 Listed $20,000 MLSNOW
- 1997-07-21 Sold (Public Records) $25,900 Public Records
- 1984-11-01 Sold (Public Records) $27,500 Public Records
Property tax history
+1.5%/yrLatest (2025): $730 · -14.1% YoY. Source: county tax records.
Cash-flow waterfall
monthlySold comps — $/sqft
last 12 mo · ≤1 miLoading sold comps…