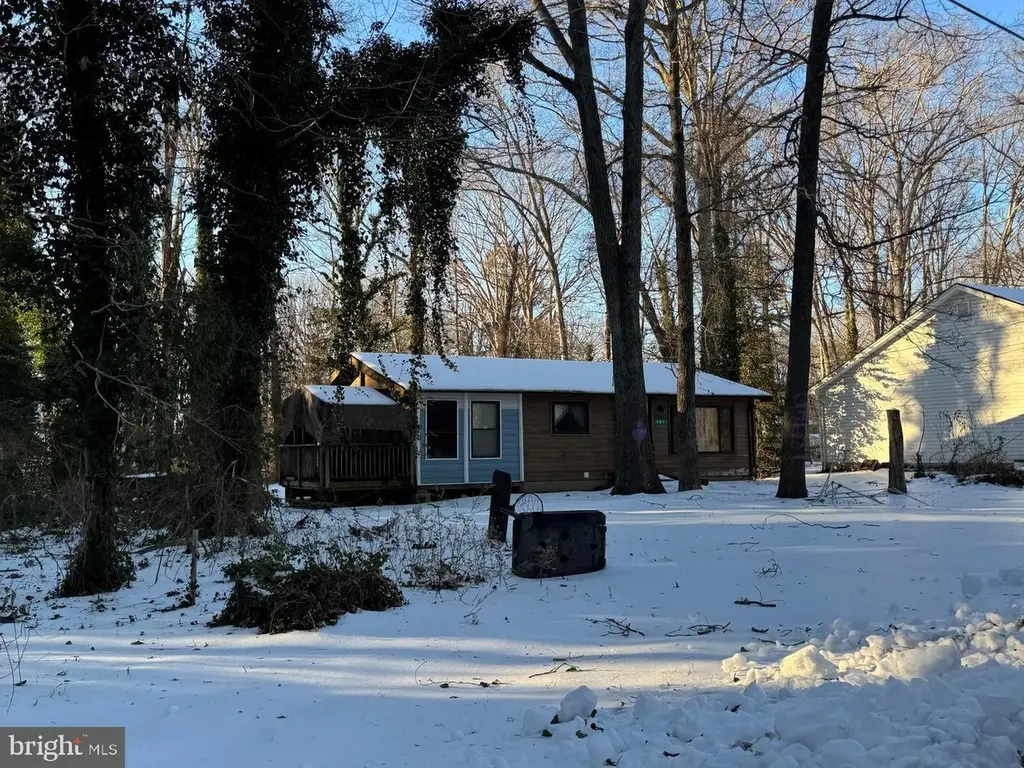
357 Cayuse Cir · Chesapeake Ranch Estates, MD
Flood risk 1/10 · Minimal
- FEMA flood zone
- X (unshaded)
- Chance of flooding over 30 yrs
- 0.0%
- Est. flood insurance / yr
- $507 – $1,088
Fire risk 3/10 · Minor
- Est. fire insurance / yr
- $755 – $1,403
Heat risk 9/10 · Severe
- Hot days now (above 101°F)
- 7 days/yr
- Hot days in 30 yrs
- 17 days/yr
Wind risk 7/10 · Major
- Chance of severe wind over 30 yrs
- 77.0%
Air-quality risk 2/10 · Minimal
- Unhealthy air days now
- 1 days/yr
- Unhealthy air days in 30 yrs
- 1 days/yr
Risk factors via First Street. Map © Google.
Why this score? — see what drove the B+ grade
The composite is a weighted blend of 9 inputs, each scored 0–100. Each bar is that input's sub-score; the figure is the points it added to the 100-point composite (weight × sub-score).
- Cash flow +30.0/30.0
- ARV discount +15.0/15.0
- 1% rule +10.0/10.0
- DSCR +10.0/10.0
- Schools +3.3/10.0
- Livability +3.3/5.0
- Rent growth +2.5/5.0
- Condition / age +2.5/5.0
- Appreciation +0.0/10.0
$154,900
🖨 Deal sheet 📄 Offer letter ✓ Due diligence
Listing remarks MLS
Great opportunity for an investor or handy home owner to buy below market value. House needs work, but opportunities are endless. Seller has never occupied the property, accuracy in this listing is not guaranteed. Sold strictly AS IS. Buyer and buyer agent must do their own due diligence before submitting an offer. Cash or hard money only. Buyer pays all transfer and record. Seller strongly prefers New World Title.
Key facts
- Built 1971
- Listed 71 days
Neighborhood map
What this means for you Summary
Snapshot
- This is a 3-bed/1.0-bath single-family listed at $155k.
Deal economics
- At list price, monthly cash flow is $753 ($9k/yr) — positive.
- The deal already cash-flows at list — no discount required.
- Meets the 1% rule at list price ($2k rent vs $155k).
- Recommended offer: $146k (6.0% below list) — sets the bar for market timing.
- Cap rate 12.1% vs local median 4.7% in Chesapeake Ranch Estates — top-decile yield for the area; either an underpriced asset or a hidden risk that comps aren't pricing in. Stress-test before assuming the spread holds.
Location & tenants
- Location reads 66/100 on livability (#240 in MD) — a middle-class / working-renter tenant base. Strengths: employment A+, housing A+; Watch: cost of living C-, crime D+, schools D-.
- Calvert County Public Schools (rural): math 23% / reading 44% proficiency, ranked #5 of 24 in MD (top 21%) — families likely to look elsewhere, expect single-tenant / working-renter base with shorter leases; only 19% free/reduced lunch — higher-income household profile.
- Market conditions: 174 active listings in the ZIP; 2 comparable units currently listed for rent nearby; high-income renter base; 101 units permitted in Calvert County in 2024 (0 in 5+ unit buildings).
Forward outlook
- Local home prices are declining (-3.0%/yr); year-one equity from $1k of loan paydown is wiped out by about $5k of value loss. Plan a longer hold.
- At projected returns (-3.0% appreciation + 3.0% rent growth), your $43k cash investment doubles in ~6 years — after that, you're playing with house money.
Negotiation context
- It's been on market 71 days — a 6% lower offer ($146k) is reasonable based on typical stale-listing flexibility.
- 4 sale attempts since 23y ago; this cycle's ask has dropped $15k (9%) from the opening price — seller is motivated, your offer sets the floor, not the list.
Risks & watch-outs
- Climate carrying-cost: major wind risk, 77% chance of damaging wind over 30y; extreme-heat days projected 7→17/yr by 2055 (HVAC capex compounding) — expect insurance premiums to compound above CPI over the hold.
Questions for the listing agent
- It's been on market 71 days. Have you received any prior offers? Is the seller open to a 6% concession, seller financing, or rate buy-down credit?
- Built in 1971 — when were the roof, HVAC, electrical panel, plumbing, and water heater last replaced?
- What does the HOA fee cover, when was the last increase, and are there any pending special assessments or reserve-fund shortfalls?
- Why hasn't it sold? Are there any deal-killer items the seller is aware of (foundation, flood, title, zoning, code violations)?
- Is there a deadline driving the sale (1031 exchange, divorce, estate, relocation)? That informs how much negotiation room exists.
- Schools are D-rated, which usually means shorter tenancies and higher turnover. Who's the typical renter profile here, and what's been the actual vacancy rate?
- Crime grade is D in this area — have there been break-ins, vandalism, or insurance claims at this property in the last 3 years? What carrier currently insures it and at what premium?
- What's the average days-on-market for RENTAL listings here right now (not sales)? A rising rental-DOM trend means longer vacancies and softer asking-rent achievability than the comps imply.
- What's the recent tenant-quality profile in this submarket — average credit score on applications, eviction rate, late-payment / NSF rate, and stable-employment percentage? A property-management company in the area should have these aggregated.
- How much new for-sale + rental construction is in the pipeline within 1–3 miles? Heavy new supply typically softens prices + rents 12–24 months out; constrained supply supports both.
Investment metrics
- 1% rule
- 1.52% ✓
- Cap rate
- 12.13%
- Cash-on-cash
- 20.83%
- DSCR
- 1.93
- GRM
- 5.5
CMA / ARV
- ARV (median comp)
- $304,734
- List price
- $154,900
- Delta
- -49.17%
- Verdict
- UNDERPRICED
- Comps
- 20 within 1.0 mi
Show comp detail 12 sales within ~0.75 mi
| Address | Dist | Beds/Ba | Sqft | Sold | Price | $/sf | Match |
|---|---|---|---|---|---|---|---|
| 12646 High Sierra Rd | 0.35mi | 2/1.0 (-1) | 864 (-3%) | 1mo | $279,000 | $323 | 73 |
| 12924 Rousby Hall Rd | 0.35mi | 3/1.0 | 960 (+8%) | 4mo | $260,000 | $271 | 67 |
| 309 Cayuse Cir | 0.12mi | 3/2.0 | 960 (+8%) | 12mo | $330,000 | $344 | 67 |
| 12990 Barreda Blvd | 0.60mi | 3/1.0 | 864 (-3%) | 2mo | $275,000 | $318 | 66 |
| 425 Rodeo Rd | 0.28mi | 3/2.0 | 960 (+8%) | 5mo | $313,000 | $326 | 65 |
| 12788 Rio Grande Trl | 0.27mi | 3/2.0 | 960 (+8%) | 9mo | $317,500 | $331 | 63 |
| 344 Oak Dr | 0.33mi | 2/1.0 (-1) | 836 (-6%) | 11mo | $241,500 | $289 | 61 |
| 12995 Rousby Hall Rd | 0.59mi | 3/1.0 | 960 (+8%) | 1mo | $304,000 | $317 | 58 |
| 419 Dogwood Dr | 0.30mi | 3/2.0 | 1,008 (+14%) | 15mo | $295,000 | $293 | 47 |
| 338 Lessin Dr | 0.46mi | 3/2.0 | 960 (+8%) | 18mo | $279,000 | $291 | 46 |
| 213 Leason Cove Dr | 0.61mi | 3/1.0 | 1,000 (+13%) | 15mo | $540,000 | $540 | 38 |
| 13495 Joy Rd | 0.71mi | 3/1.0 | 1,008 (+14%) | 9mo | $250,000 | $248 | 37 |
Match score weights: distance 35% · size 25% · config 20% · recency 20%. Top-matched comps best support the ARV.
Projected returns pro-forma
-3.0% appreciation · 3.0% rent growth · sell at horizon
- IRR
- 13.2%
- Equity multiple
- 1.53×
- Total profit
- $22,918
- Equity at exit
- $23,096
- IRR
- 22.1%
- Equity multiple
- 2.89×
- Total profit
- $81,956
- Equity at exit
- $13,393
Cash invested: $43,372 (down + closing). Projections, not guarantees.
Landlord ↔ Tenant lean methodology
- Overall (STATE)
- 27 Tenant-Leaning
- State Maryland
- 27 Tenant-Leaning · D+14
- County
- — inherits STATE
- City
- — inherits STATE
ZIP-level market 20657
- Home prices YoY
- -7.1%
- Active inventory
- 174
- Price-to-rent
- 5.5×
Monthly cashflow live
- Estimated rent
- $2,360 medium interval (Pro) →
- Mortgage (P&I)
- −$812
- Tax from tax record
- −$185 /mo · $2,225/yr
- Insurance
- −$65
- HOA
- −$49
- Vacancy / Maint / Mgmt
- −$496
- Net cashflow
- $753
Break-even live
UW: 25.0% down · 7.5% · 30yr · 1.5% tax · 5.0% vac · 8.0% maint · 8.0% mgmt
Financing live
Cash to close
- Down payment
- $38,725
- Closing costs
- $4,647
- Reserves months
- —
- Total cash needed
- —
Loan-product check · same deal, 3 products live
Conventional
25% down · 7.5% · 30yr
- Down + closing
- —
- Monthly P&I
- —
- Monthly cashflow
- —
- DSCR
- —
- Eligible?
- —
Personal DTI + credit; lowest rate.
DSCR
20% down · 8.5% · 30yr
- Down + closing
- —
- Monthly P&I
- —
- Monthly cashflow
- —
- DSCR
- —
- Eligible?
- —
No personal income docs; deal must DSCR.
Hard money
10% down · 12.0% · 12mo
- Down + closing
- —
- Monthly P&I
- —
- Monthly cashflow
- —
- DSCR
- —
- Eligible?
- —
Short-term bridge; refi at stabilization.
Rent comps 2 comps
| Address | Beds | Baths | Sqft | Rent | $/sqft | DOM | Units | Dist |
|---|---|---|---|---|---|---|---|---|
| 12904 Huron Dr Lusby, MD | 3.0 | 2.0 | 1030 | $1,950 | $1.89 | 1d | 1 | 0.40mi |
| 12627 Hilltop Rd Lusby, MD | 3.0 | 2.0 | 1108 | $2,400 | $2.17 | 16d | 1 | 0.91mi |
HOA detail
- Monthly dues
- $49 · $588/yr
Listing history 29 events
-
2026-06-18days on market $154,900 Active 71 DOM
-
2026-06-17days on market $154,900 Active 70 DOM
-
2026-06-16days on market $154,900 Active 69 DOM
-
2026-06-15days on market $154,900 Active 68 DOM
-
2026-06-13days on market $154,900 Active 66 DOM
-
2026-06-09days on market $154,900 Active 62 DOM
-
2026-06-08days on market $154,900 Active 61 DOM
-
2026-06-07days on market $154,900 Active 60 DOM
-
2026-06-04pricedays on market $154,900 Active 57 DOM
-
2026-06-03days on market $159,900 Active 56 DOM
-
2026-06-02days on market $159,900 Active 55 DOM
-
2026-06-01days on market $159,900 Active 54 DOM
-
2026-05-31days on market $159,900 Active 53 DOM
-
2026-04-08$169,900 Active 418-char remark
Show marketing remark (418 chars)
Great opportunity for an investor or handy home owner to buy below market value. House needs work, but opportunities are endless. Seller has never occupied the property, accuracy in this listing is not guaranteed. Sold strictly AS IS. Buyer and buyer agent must do their own due diligence before submitting an offer. Cash or hard money only. Buyer pays all transfer and record. Seller strongly prefers New World Title.
-
2025-02-19status Pending
-
2025-02-11historical
-
2025-02-11historical
-
2025-02-06$129,900 Active
-
2006-11-27soldstatus $195,000
-
2006-11-27soldstatus $195,000
-
2006-11-17soldstatus $195,000
-
2006-10-20historical
-
2006-09-19$199,900
-
2003-09-18soldstatus $139,000
-
2003-08-22soldstatus $139,000
-
2003-07-14historical
-
2003-07-11$138,900
-
1995-08-29soldstatus $67,000
-
1994-03-25soldstatus $53,950
ⓘ Source: listings_history table (triggers on properties + properties_extension) + one-shot
backfill from property_details.listing_events for pre-trigger history.
Tax reassessment forecast MD · Partial reset (capped growth)
- Current annual tax
- $2,225 · $185/mo
- Projected year-2 tax
- $2,225 · $185/mo
- Expected delta
- $0/yr ($0/mo · 0.0%)
ⓘ Screening estimate from a state-policy table — verify with the county assessor before closing.
Climate risk First Street
- Flood 1/10 Low FEMA zone X (unshaded) · 0% chance over 30 yrs
- Wildfire 3/10 Moderate
- Heat 9/10 Extreme 7 d/yr ≥101°F today · 17 d/yr by 30 yrs out
- Wind 7/10 Severe 77% chance of damaging wind over 30 yrs
- Air quality 2/10 Low 1 unhealthy d/yr today · 1 by 30 yrs out
Nearby sold comps map
Loading sold comps map…
Walkable amenities ~0.75 mi
Loading nearby amenities…
Taxation est. · year 1
- Rental income
- $28,318
- − Mortgage interest
- −$8,677
- − Property taxes
- −$2,225
- − Insurance
- −$774
- − Repairs & maintenance
- −$2,265
- − Management
- −$2,265
- − HOA
- −$588
- − Depreciation
- −$4,506
- Taxable income
- $7,016
- Est. tax owed @ 24.0%
- −$1,684
- After-tax cash flow
- $7,352/yr
For passive investors: Depreciation is non-cash, so a rental often shows a tax loss while cash-flowing — sheltering income. Rental losses are passive: they offset passive income freely, and up to $25,000/yr can offset ordinary (W-2) income if you actively participate and your MAGI is under $100k (phasing out to $0 by $150k); unused losses carry forward. On sale, claimed depreciation is recaptured at up to 25%, and gains may owe capital-gains tax (a 1031 exchange can defer both). Figures are a year-1 estimate at your 24.0% rate — not tax advice; consult a CPA.
Schools (NCES district)
- District
- Calvert County Public Schools
- NCES district ID
- 2400150
- Math proficiency
- 23% ▼ -29.00%
- Reading proficiency
- 44% ▼ -15.00%
- Median HH income
- $94,392
- Composite
- 33.27/100
- National rank
- #5511
- State rank
- #5 of 24 in MD
Livability — Chesapeake Ranch Estates
- Score
- 66/100
- State rank
- #240
- US rank
- #11959
Category grades
Schools grade is shown separately in the Schools card above.
Census & demographics
- Census place
- Chesapeake Ranch Estates, MD
- County
- Calvert County · 33,451 people
- Metro
- Washington-Arlington-Alexandria, DC-VA-MD-WV
- Population (ZIP)
- 20,699
- Household income
- $115,748
- Rent vs Own
- Severe rent burden
- 136.0
Population outlook (Calvert County) Hauer SSP2
- Today (2025)
- 94,825 people
- By 2030
- 96,197 · +1.4%
- By 2040
- 96,954 · +2.2%
- By 2050
- 94,628 · -0.2%
- By 2075
- 91,576 · -3.4%
- By 2100
- 83,431 · -12.0%
Race, ethnicity, and origin ACS 2023
- Neighborhood character
- Predominantly White (71%)
- Race & ethnicity
- White 71% Black 15% Two or more races 7% Hispanic / Latino 6% Asian 2%
- Hispanic origin (detail)
- Mexican 1% Puerto Rican 3%
- Common ancestry
- Lithuanian 3% Slovak 3% Romanian 1%
- Foreign-born
- 4% · Canada
- Languages at home
- 93% English-only · Spanish 3% Other Indo-European 1% Tagalog/Filipino 1%
Political lean MEDSL · Calvert
- 2024 margin
- R (+11.0) · D 43.5% · R 54.5% · Other 2.0%
- 2008→2024 swing
- -4.6pp toward R · 2008: -6.3pp · 2024: -11.0pp
- All cycles
- 2024: R+11.0 2020: R+5.6 2016: R+18.4 2012: R+8.2 2008: R+6.3
Not yet ingested
- Civics
- —
Market trends
- HPI YoY
- ▼ -20.88%
- Current HPI
- 274.4909
- Rent YoY
- —
- Metro
- Washington-Arlington-Alexandria, DC-VA-MD-WV
- State GDP YoY
- ▲ 2.97%
- F500 in state
- 12
Industry mix (Fortune 500 HQ in MD)
| Industry | F500 HQs | Revenue |
|---|---|---|
| Aerospace / Defense | 1 | $71B |
|
||
| Utilities | 1 | $25B |
|
||
| Hotels | 1 | $24B |
|
||
| Consumer Goods | 1 | $7B |
|
||
| Real Estate | 1 | $6B |
|
||
| Chemicals | 1 | $2B |
|
||
Price history
+214.9% since first listed16 events — show timeline
- 2026-04-08 Listed $169,900 BRIGHT MLS
- 2025-02-19 Pending — BRIGHT MLS
- 2025-02-11 Listing Removed — BRIGHT MLS
- 2025-02-11 Listing Removed — BRIGHT MLS
- 2025-02-06 Listed $129,900 BRIGHT MLS
- 2006-11-27 Sold (Public Records) $195,000 Public Records
- 2006-11-27 Sold (Public Records) $195,000 Public Records
- 2006-11-17 Sold (MLS) $195,000 MRIS
- 2006-10-20 Delisted — MRIS
- 2006-09-19 Listed $199,900 MRIS
- 2003-09-18 Sold (Public Records) $139,000 Public Records
- 2003-08-22 Sold (MLS) $139,000 MRIS
- 2003-07-14 Delisted — MRIS
- 2003-07-11 Listed $138,900 MRIS
- 1995-08-29 Sold (Public Records) $67,000 Public Records
- 1994-03-25 Sold (Public Records) $53,950 Public Records
Property tax history
+2.6%/yrLatest (2025): $2,225 · +7.5% YoY. Source: county tax records.
Cash-flow waterfall
monthlySold comps — $/sqft
last 12 mo · ≤1 miLoading sold comps…