 Multi-family
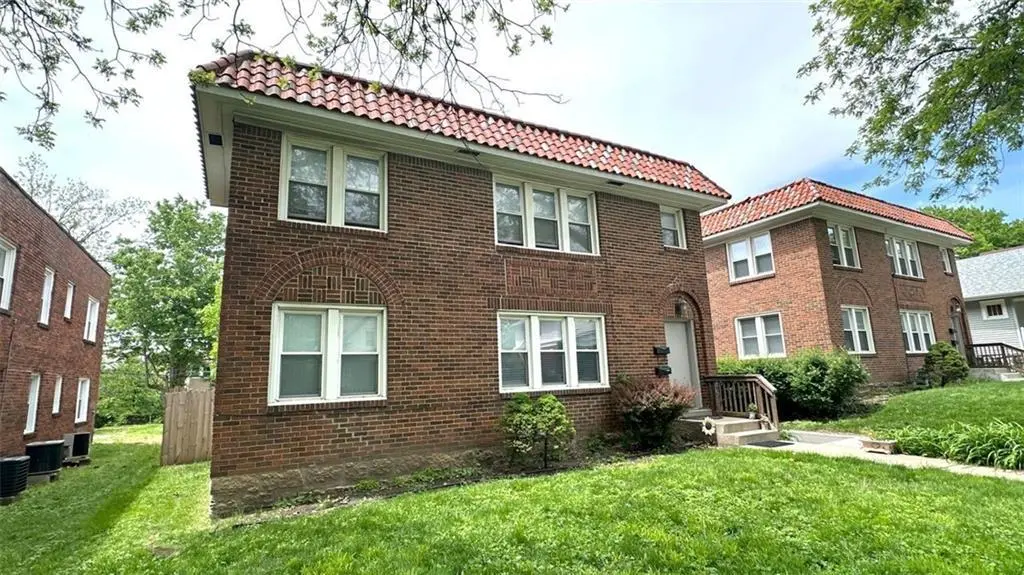
4236 Holly St · Kansas City, MO
Flood risk 1/10 · Minimal
- FEMA flood zone
- X (unshaded)
- Chance of flooding over 30 yrs
- 0.0%
- Est. flood insurance / yr
- $473 – $860
Fire risk 1/10 · Minimal
- Est. fire insurance / yr
- $1,054 – $1,958
Heat risk 4/10 · Minor
- Hot days now (above 106°F)
- 7 days/yr
- Hot days in 30 yrs
- 17 days/yr
Wind risk 2/10 · Minimal
- Chance of severe wind over 30 yrs
- —
Air-quality risk 3/10 · Minor
- Unhealthy air days now
- 2 days/yr
- Unhealthy air days in 30 yrs
- 3 days/yr
Risk factors via First Street. Map © Google.
Why this score? — see what drove the D grade
The composite is a weighted blend of 9 inputs, each scored 0–100. Each bar is that input's sub-score; the figure is the points it added to the 100-point composite (weight × sub-score).
- ARV discount +14.4/15.0
- Cash flow +12.1/30.0
- Livability +3.9/5.0
- DSCR +3.6/10.0
- Rent growth +3.4/5.0
- 1% rule +2.7/10.0
- Condition / age +2.5/5.0
- Schools +1.5/10.0
- Appreciation +0.0/10.0
$399,900
🖨 Deal sheet (PDF) 📄 Offer letter ✓ Due diligence
Multi-family units
County records classify this as Multi-Family (2-4 Unit). Listing-text estimate: 1 unit. estimate disagrees with records
Listing remarks MLS
To be sold with 4232 Holly (next door). Large units with sunroom and lots of light. Newer dual-pane windows. Some carpets and hardwoods, 1 carport per unit, central driveway. All units have 2 bedrooms, 1 bath and a sunroom. New water heaters for both units. Call listing agent for additional information 816-210-7730
Key facts
- 6,478 sq ft lot
- Built 1930
- Listed 52 days
Property features AI
Finance
- Financial info: Gross income reported as $31,200; Operating expenses include maintenance, insurance, real estate tax, and water/sewer
- HOA & community: Maintenance responsibilities include building exterior, HVAC, lawn, roof repair/replacement, and snow removal
Exterior
- Parking: Carport; Paved parking
- Utilities: Public water; Public sewer; Cable available; Fiber available; High-speed internet available; Metro Free telecom
- Home design: Duplex residential income property; Two stories
- Construction: Brick construction; Other-type roof
- Exterior features: Public road maintenance; Inside city limits; Building exterior maintenance included in responsibilities
Interior
- Kitchen: Range/oven; Refrigerator; Dishwasher (in some units)
- Bedrooms: Two-bedroom units
- Bathrooms: One bathroom per unit
- Heating & cooling: Forced air heating; Electric cooling
- Interior features: Individual storage available; Applies to all units
- Laundry & utility: Laundry in basement; Individual water heaters; Separate meters
Neighborhood map
What this means for you Summary
Snapshot
- This is a 6-bed/2.0-bath multifamily listed at $400k.
Deal economics
- At list price, monthly cash flow is $-85 ($-1k/yr) — negative.
- To cash-flow at today's rent, offer at most $385k (3.8% below list).
- To meet the 1% rule (rent ≥ 1% of price), the offer needs to be $309k (22.8% below list).
- Recommended offer: $309k (22.8% below list) — sets the bar for 1% rule.
- Cap rate 6.0% vs local median 3.9% in Kansas City — top-decile yield for the area; either an underpriced asset or a hidden risk that comps aren't pricing in. Stress-test before assuming the spread holds.
Location & tenants
- Location reads 78/100 on livability (#28 in MO, #2,671 nationally) — a middle-class / working-renter tenant base. Strengths: amenities A+, commute A+, cost of living A+; Watch: crime F.
- Kansas City 33 (urban): math 12% / reading 24% proficiency, ranked #308 of 324 in MO (top 95%) — low school quality limits family demand, transient renter base, plan for 1-2y turnover; 75% free/reduced lunch — lower-income household profile, screen leases tightly.
- Zoned schools: Ac Prep Elementary (math 12% / reading 27%, grade F, #941 of 1,115 statewide, top 86%, 341 students, 99% FRL); Central Middle School (math 0% / reading 9%, grade F, #388 of 391 statewide, top 99%, 428 students, 99% FRL); Southeast High School (math 2% / reading 12%, grade F, #512 of 521 statewide, top 99%, 487 students, 99% FRL) — zoned schools average 99% FRL vs 75% district-wide (24 pts higher); higher-poverty schools than district average — tighter screening recommended.
- Market conditions: Rents rising (+3.4%/yr); 168 active listings in the ZIP; 2 comparable units currently listed for rent nearby; 4,002 units permitted in Jackson County in 2024 (2,271 in 5+ unit buildings).
- At $3,088/mo this rent would consume 60% of the median local household income ($62k/yr) (locally 1606% of renters already pay >50% of income on rent) — very limited rent-growth headroom before tenants either downsize or default.
Forward outlook
- Local home prices are declining (-3.0%/yr); year-one equity from $3k of loan paydown is wiped out by about $12k of value loss. Plan a longer hold.
- Jackson County population projected at +4% by 2050 — modest demand growth; plan on rents tracking national, not racing it.
Negotiation context
- It's been on market 53 days — a 3% lower offer ($388k) is reasonable based on typical stale-listing flexibility.
- 4 sale attempts since 24y ago; this cycle's ask has dropped $50k (11%) from the opening price — seller is motivated, your offer sets the floor, not the list.
Risks & watch-outs
- Watch-outs: built in 1930 — expect roof / HVAC / electrical / plumbing capex.
Questions for the listing agent
- What do current leases actually rent for vs. the listed asking? Can we see a recent rent roll and the last 12 months of T-12 income?
- It's been on market 53 days. Have you received any prior offers? Is the seller open to a 23% concession, seller financing, or rate buy-down credit?
- Built in 1930 — when were the roof, HVAC, electrical panel, plumbing, and water heater last replaced?
- Is there a deadline driving the sale (1031 exchange, divorce, estate, relocation)? That informs how much negotiation room exists.
- Crime grade is F in this area — have there been break-ins, vandalism, or insurance claims at this property in the last 3 years? What carrier currently insures it and at what premium?
- The area grade is low — what's the realistic commute time and amenity access for the typical tenant pool here? Any planned neighborhood developments (good or bad) we should know about?
- What's the average days-on-market for RENTAL listings here right now (not sales)? A rising rental-DOM trend means longer vacancies and softer asking-rent achievability than the comps imply.
- What's the recent tenant-quality profile in this submarket — average credit score on applications, eviction rate, late-payment / NSF rate, and stable-employment percentage? A property-management company in the area should have these aggregated.
- How much new apartment / multifamily construction is in the pipeline within 1–3 miles? Heavy new supply (>2% of stock underway) typically softens rents 12–24 months out; light construction supports rent growth.
Investment metrics
- 1% rule
- 0.77% ✗
- Cap rate
- 6.04%
- Cash-on-cash
- -0.91%
- DSCR
- 0.96
- GRM
- 10.8
CMA / ARV
- ARV (median comp)
- $472,837
- List price
- $399,900
- Delta
- -15.43%
- Verdict
- UNDERPRICED
- Comps
- 20 within 1.0 mi
Show comp detail 1 sale within ~0.75 mi
| Address | Dist | Beds/Ba | Sqft | Sold | Price | $/sf | Match |
|---|---|---|---|---|---|---|---|
| 4821-23 Jarboe St | 0.75mi | 6/3.5 | 3,190 (+11%) | 20mo | $539,000 | $169 | 23 |
Match score weights: distance 35% · size 25% · config 20% · recency 20%. Top-matched comps best support the ARV.
Projected returns pro-forma
-3.0% appreciation · 3.42% rent growth · sell at horizon
- IRR
- -17.4%
- Equity multiple
- 0.38×
- Total profit
- $-69,014
- Equity at exit
- $59,626
- IRR
- -8.8%
- Equity multiple
- 0.45×
- Total profit
- $-62,062
- Equity at exit
- $34,576
Cash invested: $111,972 (down + closing). Projections, not guarantees.
Landlord ↔ Tenant lean methodology
- Overall (STATE)
- 81 Strongly Landlord-Friendly
- State Missouri
- 81 Strongly Landlord-Friendly · R+10
- County
- — inherits STATE
- City
- — inherits STATE
ZIP-level market 64111
- Rents YoY
- 3.4%
- Active inventory
- 168
- Price-to-rent
- 21.6×
Monthly cashflow live
- Estimated rent
- $3,088 high interval (Pro) →
- Mortgage (P&I)
- −$2,097
- Tax from tax record
- −$261 /mo · $3,131/yr
- Insurance
- −$167
- HOA
- −$0
- Vacancy / Maint / Mgmt
- −$648
- Net cashflow
- $-85
Break-even live
Sensitivity live
| Price | -10% $141 | -5% $28 | +0% $-85 | +5% $-198 | +10% $-312 |
|---|---|---|---|---|---|
| Rent | -10% $-329 | -5% $-207 | +0% $-85 | +5% $37 | +10% $159 |
| Rate | -1.0pp $116 | -0.5pp $17 | base $-85 | +0.5pp $-189 | +1.0pp $-294 |
2-unit breakdown (identical units grouped — click to expand)
| Units | Beds | Baths | Est. rent |
|---|---|---|---|
| 2× units | 2 | 1 | $3,088 |
| #1 | 2 | 1 | $1,544 |
| #2 | 2 | 1 | $1,544 |
| Total (2 units) | $3,088 | ||
UW: 25.0% down · 7.5% · 30yr · 1.5% tax · 5.0% vac · 8.0% maint · 8.0% mgmt
Financing live
Cash to close
- Down payment
- $99,975
- Closing costs
- $11,997
- Reserves months
- —
- Total cash needed
- —
Loan-product check · same deal, 3 products live
Conventional
25% down · 7.5% · 30yr
- Down + closing
- —
- Monthly P&I
- —
- Monthly cashflow
- —
- DSCR
- —
- Eligible?
- —
Personal DTI + credit; lowest rate.
DSCR
20% down · 8.5% · 30yr
- Down + closing
- —
- Monthly P&I
- —
- Monthly cashflow
- —
- DSCR
- —
- Eligible?
- —
No personal income docs; deal must DSCR.
Hard money
10% down · 12.0% · 12mo
- Down + closing
- —
- Monthly P&I
- —
- Monthly cashflow
- —
- DSCR
- —
- Eligible?
- —
Short-term bridge; refi at stabilization.
Rent comps 2 comps
| Address | Beds | Baths | Sqft | Rent | $/sqft | DOM | Units | Dist |
|---|---|---|---|---|---|---|---|---|
| 3517 Jefferson St Kansas City, MO | 5.0 | 3.5 | 3200 | $3,600 | $1.12 | 18d | 1 | 0.99mi |
| 3327 Wyandotte St Kansas City, MO | 5.0 | 2.5 | 2902 | $2,495 | $0.86 | 45d | 1 | 1.31mi |
Listing history 26 events
-
2026-06-21days on market $399,900 Active 53 DOM
-
2026-06-18days on market $399,900 Active 50 DOM
-
2026-06-17days on market $399,900 Active 49 DOM
-
2026-06-16days on market $399,900 Active 48 DOM
-
2026-06-15days on market $399,900 Active 47 DOM
-
2026-06-13days on market $399,900 Active 45 DOM
-
2026-06-09days on market $399,900 Active 41 DOM
-
2026-06-08days on market $399,900 Active 40 DOM
-
2026-06-07days on market $399,900 Active 39 DOM
-
2026-06-05days on market $399,900 Active 36 DOM
-
2026-06-03days on market $399,900 Active 35 DOM
-
2026-06-02days on market $399,900 Active 34 DOM
-
2026-06-02price $399,900 Active 33 DOM
-
2026-06-01days on market $450,000 Active 33 DOM
-
2026-05-31days on market $450,000 Active 32 DOM
-
2026-04-30$450,000 Active 447-char remark
-
2026-04-23historical $450,000 447-char remark
-
2021-07-20historical
-
2021-04-12$500,000 Active
-
2018-05-25soldstatus Sold
Show marketing remark (316 chars)
To be sold with 4232 Holly (next door). Large units with sunroom and lots of light. Newer dual-pane windows. Some carpets and hardwoods, 1 carport per unit, central driveway. All units have 2 bedrooms, 1 bath and a sunroom. New water heaters for both units. Call listing agent for additional information 816-210-7730
-
2018-05-01status Pending
Show marketing remark (316 chars)
To be sold with 4232 Holly (next door). Large units with sunroom and lots of light. Newer dual-pane windows. Some carpets and hardwoods, 1 carport per unit, central driveway. All units have 2 bedrooms, 1 bath and a sunroom. New water heaters for both units. Call listing agent for additional information 816-210-7730
-
2018-04-26$300,000 Active
Show marketing remark (316 chars)
To be sold with 4232 Holly (next door). Large units with sunroom and lots of light. Newer dual-pane windows. Some carpets and hardwoods, 1 carport per unit, central driveway. All units have 2 bedrooms, 1 bath and a sunroom. New water heaters for both units. Call listing agent for additional information 816-210-7730
-
2003-01-09soldstatus
-
2003-01-07soldstatus
-
2002-10-29$185,000
-
1995-07-31soldstatus
ⓘ Source: listings_history table (triggers on properties + properties_extension) + one-shot
backfill from property_details.listing_events for pre-trigger history.
Tax reassessment forecast MO · Resets to sale price
- Current annual tax
- $3,131 · $261/mo
- Projected year-2 tax
- $3,879 · $323/mo
- Expected delta
- +$748/yr (+$62/mo · 23.9%)
ⓘ Screening estimate from a state-policy table — verify with the county assessor before closing.
Climate risk First Street
- Flood 1/10 Low FEMA zone X (unshaded) · 0% chance over 30 yrs
- Wildfire 1/10 Low
- Heat 4/10 Moderate 7 d/yr ≥106°F today · 17 d/yr by 30 yrs out
- Wind 2/10 Low
- Air quality 3/10 Moderate 2 unhealthy d/yr today · 3 by 30 yrs out
Nearby sold comps map
Loading sold comps map…
Walkable amenities ~0.75 mi
Loading nearby amenities…
Taxation est. · year 1
- Rental income
- $37,056
- − Mortgage interest
- −$22,401
- − Property taxes
- −$3,131
- − Insurance
- −$2,000
- − Repairs & maintenance
- −$2,964
- − Management
- −$2,964
- − Depreciation
- −$11,633
- Taxable loss
- −$8,038
- Est. tax savings @ 24.0%
- +$1,929
- After-tax cash flow
- $907/yr
For passive investors: Depreciation is non-cash, so a rental often shows a tax loss while cash-flowing — sheltering income. Rental losses are passive: they offset passive income freely, and up to $25,000/yr can offset ordinary (W-2) income if you actively participate and your MAGI is under $100k (phasing out to $0 by $150k); unused losses carry forward. On sale, claimed depreciation is recaptured at up to 25%, and gains may owe capital-gains tax (a 1031 exchange can defer both). Figures are a year-1 estimate at your 24.0% rate — not tax advice; consult a CPA.
Schools (NCES district)
- District
- Kansas City 33
- NCES district ID
- 2916400
- Math proficiency
- 12% ▼ -8.00%
- Reading proficiency
- 24% ▬ 0.00%
- Median HH income
- $35,227
- Composite
- 14.8/100
- National rank
- #9387
- State rank
- #308 of 324 in MO
Livability — Kansas City
- Score
- 78/100
- State rank
- #28
- US rank
- #2671
Category grades
Schools grade is shown separately in the Schools card above.
Census & demographics
- Census place
- Kansas City, MO
- County
- Jackson County · 687,798 people
- City population
- 439,467
- Metro
- Kansas City, MO-KS
- Population (ZIP)
- 16,887
- Household income
- $61,729
- Rent vs Own
- Severe rent burden
- 1606.0
Population outlook (Jackson County) Hauer SSP2
- Today (2025)
- 719,589 people
- By 2030
- 731,456 · +1.6%
- By 2040
- 746,689 · +3.8%
- By 2050
- 749,289 · +4.1%
- By 2075
- 736,227 · +2.3%
- By 2100
- 668,210 · -7.1%
Race, ethnicity, and origin ACS 2023
- Neighborhood character
- Predominantly White (70%)
- Race & ethnicity
- White 70% Hispanic / Latino 10% Black 10% Two or more races 9% Asian 3%
- Hispanic origin (detail)
- Mexican 8%
- Common ancestry
- Lithuanian 3% Slovak 2% Serbian 2%
- Foreign-born
- 6% · Canada, China
- Languages at home
- 90% English-only · Spanish 5% Other Asian/Pacific 1% Chinese 1%
Political lean MEDSL · Jackson
- 2024 margin
- D (+19.3) · D 58.9% · R 39.5% · Other 1.6%
- 2008→2024 swing
- -6.1pp toward R · 2008: 25.4pp · 2024: 19.3pp
- All cycles
- 2024: D+19.3 2020: D+22.0 2016: D+16.6 2012: D+19.0 2008: D+25.4
Not yet ingested
- Civics
- —
Market trends
- HPI YoY
- ▼ -341.84%
- Current HPI
- 282.068
- Rent YoY
- ▲ 3.42%
- Metro
- Kansas City, MO-KS
- State GDP YoY
- ▲ 1.84%
- F500 in state
- 20
Industry mix (Fortune 500 HQ in MO)
| Industry | F500 HQs | Revenue |
|---|---|---|
| Healthcare | 1 | $163B |
|
||
| Insurance | 1 | $21B |
|
||
| Industrial Technology | 1 | $17B |
|
||
| Retail | 1 | $16B |
|
||
| Industrial Distribution | 1 | $10B |
|
||
| Utilities | 1 | $9B |
|
||
Price history
+116.2% since first listed12 events — show timeline
- 2026-06-01 Price Changed $399,900 Heartland MLS as Distributed by MLS Grid
- 2026-04-30 Listed $450,000 Heartland MLS as Distributed by MLS Grid
- 2026-04-23 Coming Soon $450,000 Heartland MLS as Distributed by MLS Grid
- 2021-07-20 Listing Removed — Heartland MLS as Distributed by MLS Grid
- 2021-04-12 Listed $500,000 Heartland MLS as Distributed by MLS Grid
- 2018-05-25 Sold (MLS) — Heartland MLS as Distributed by MLS Grid
- 2018-05-01 Pending — Heartland MLS as Distributed by MLS Grid
- 2018-04-26 Listed $300,000 Heartland MLS as Distributed by MLS Grid
- 2003-01-09 Sold (MLS) — Heartland MLS as Distributed by MLS Grid
- 2003-01-07 Sold (Public Records) — Public Records
- 2002-10-29 Listed $185,000 Heartland MLS as Distributed by MLS Grid
- 1995-07-31 Sold (Public Records) — Public Records
Property tax history
+3.4%/yrLatest (2025): $3,131 · +22.2% YoY. Source: county tax records.
Cash-flow waterfall
monthlySold comps — $/sqft
last 12 mo · ≤1 miLoading sold comps…