 Multi-family
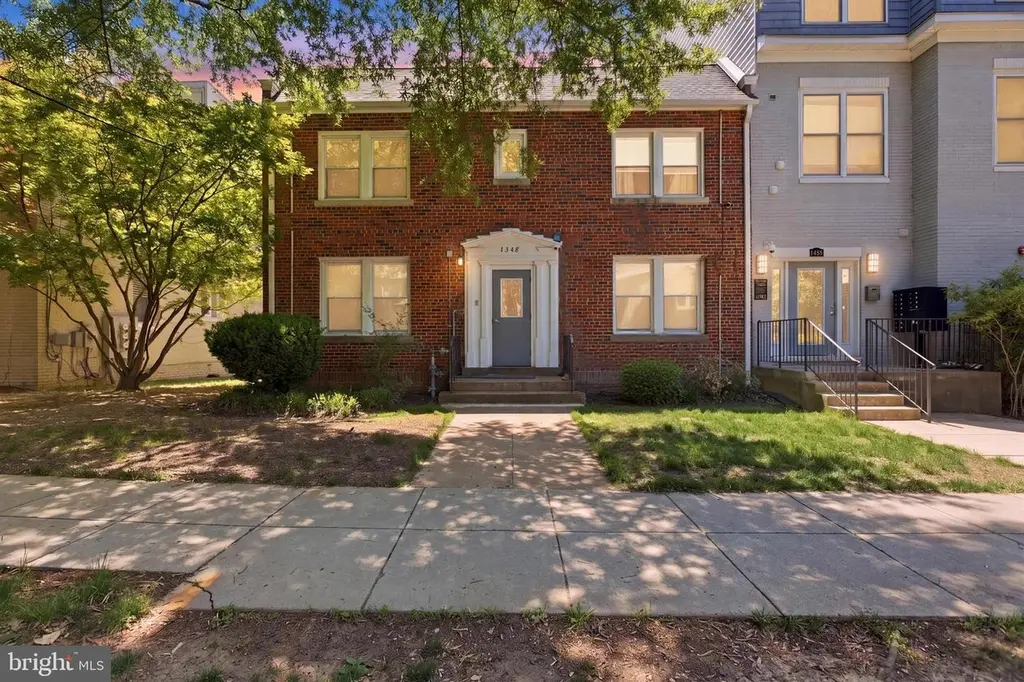
1348 Nicholson St NW · Washington, DC
Flood risk 1/10 · Minimal
- FEMA flood zone
- X (unshaded)
- Chance of flooding over 30 yrs
- 0.0%
- Est. flood insurance / yr
- $507 – $1,088
Fire risk 3/10 · Minor
- Est. fire insurance / yr
- $631 – $1,173
Heat risk 7/10 · Major
- Hot days now (above 104°F)
- 7 days/yr
- Hot days in 30 yrs
- 15 days/yr
Wind risk 4/10 · Minor
- Chance of severe wind over 30 yrs
- 16.0%
Air-quality risk 4/10 · Minor
- Unhealthy air days now
- 5 days/yr
- Unhealthy air days in 30 yrs
- 6 days/yr
Risk factors via First Street. Map © Google.
Why this score? — see what drove the C grade
The composite is a weighted blend of 9 inputs, each scored 0–100. Each bar is that input's sub-score; the figure is the points it added to the 100-point composite (weight × sub-score).
- Cash flow +23.6/30.0
- DSCR +7.6/10.0
- ARV discount +7.5/15.0
- 1% rule +5.6/10.0
- Livability +3.7/5.0
- Schools +3.6/10.0
- Rent growth +2.9/5.0
- Condition / age +2.5/5.0
- Appreciation +0.0/10.0
$830,000
🖨 Deal sheet 📄 Offer letter ✓ Due diligence
Multi-family units
County records classify this as Multi-Family (2-4 Unit). Listing-text estimate: 1 unit. estimate disagrees with records
Listing remarks
Exceptional multifamily opportunity in the highly sought-after 16th Street Heights neighborhood! 1348 Nicholson presents a rare chance to own a well-maintained four-unit building in one of Northwest DC’s most desirable and steadily appreciating communities. Situated on an oversized lot, this property offers significant value-add potential, including the ability to add up to four rear parking spaces—an attractive feature for both tenants and future resale value. The building has been well cared for and provides strong income-producing potential for investors seeking both immediate cash flow and long-term appreciation. Each unit offers functional layouts, and buyers will appreciat
Key facts
- Shopping
- Oversized lot
- Parks
Tags
Property features AI
Finance
- Other: Fee simple ownership; Assessed values and tax details available (assessor-sourced square footage)
- Financial info: Total actual rent reported at $42,000; Three of four units currently leased
Exterior
- Utilities: Public water; Public sewer; Natural gas hot water
- Home design: Brick construction; Crawl space foundation; Above-grade and below-grade structures noted
- Construction: Brick exterior
- Exterior features: Semi-detached property; Tidal water not present
Interior
- Bedrooms: Four 1-bedroom units
- Heating & cooling: Hot water heating; Natural gas heating fuel; Electric cooling fuel
- Interior features: No basement; Month-to-month and long-term existing leases
Neighborhood map
What this means for you Summary
Snapshot
- This is a 4-bed/4.0-bath multifamily listed at $830k.
Deal economics
- At list price, monthly cash flow is $2k ($19k/yr) — positive.
- The deal already cash-flows at list — no discount required.
- Meets the 1% rule at list price ($9k rent vs $830k).
- Recommended offer: $818k (1.5% below list) — sets the bar for market timing.
- Cap rate 8.6% vs local median 2.5% in Washington — top-decile yield for the area; either an underpriced asset or a hidden risk that comps aren't pricing in. Stress-test before assuming the spread holds.
Location & tenants
- Location reads 73/100 on livability (#1 in DC) — a middle-class / working-renter tenant base. Strengths: amenities A+, commute A+, employment A+; Watch: crime F, cost of living F.
- District Of Columbia Public Schools (urban): math 33% / reading 40% proficiency, ranked #8 of 32 in DC (top 25%) — families likely to look elsewhere, expect single-tenant / working-renter base with shorter leases; 65% free/reduced lunch — lower-income household profile, screen leases tightly.
- Zoned schools: Browne Education Campus (438 students, 0% FRL) — zoned schools average 0% FRL vs 65% district-wide (65 pts lower); this property's tenant base skews higher-income than the district average.
- Market conditions: Rents rising (+1.4%/yr); 370 active listings in the ZIP; 31 comparable units currently listed for rent nearby; rentals at typical pace (median 16d on market — plan ~3-4 weeks tenant-placement turnaround); high-income renter base; 1,737 units permitted in District of Columbia in 2024 (1,506 in 5+ unit buildings).
- At $8,783/mo this rent would consume 96% of the median local household income ($110k/yr) (locally 3020% of renters already pay >50% of income on rent) — very limited rent-growth headroom before tenants either downsize or default.
Forward outlook
- Local home prices are declining (-3.0%/yr); year-one equity from $6k of loan paydown is wiped out by about $25k of value loss. Plan a longer hold.
- District of Columbia County population projected at +50% by 2050 — long-run rental-demand tailwind backs the buy-and-hold thesis.
Negotiation context
- It's been on market 20 days — a 2% lower offer ($818k) is reasonable based on typical stale-listing flexibility.
- 2 sale attempts since 31y ago with the ask held roughly flat each time — persistent listings suggest the price (not the market) is what's stuck; bring a comps-based counter.
- Current owner paid $125k; list at $830k implies a 564% gain — meaningful room to come down on a strong offer.
Risks & watch-outs
- Watch-outs: built in 1935 — expect roof / HVAC / electrical / plumbing capex.
- Climate carrying-cost: extreme-heat days projected 7→15/yr by 2055 (HVAC capex compounding) — expect insurance premiums to compound above CPI over the hold.
Questions for the listing agent
- Built in 1935 — when were the roof, HVAC, electrical panel, plumbing, and water heater last replaced?
- Is there a deadline driving the sale (1031 exchange, divorce, estate, relocation)? That informs how much negotiation room exists.
- Crime grade is F in this area — have there been break-ins, vandalism, or insurance claims at this property in the last 3 years? What carrier currently insures it and at what premium?
- What's the average days-on-market for RENTAL listings here right now (not sales)? A rising rental-DOM trend means longer vacancies and softer asking-rent achievability than the comps imply.
- What's the recent tenant-quality profile in this submarket — average credit score on applications, eviction rate, late-payment / NSF rate, and stable-employment percentage? A property-management company in the area should have these aggregated.
- How much new apartment / multifamily construction is in the pipeline within 1–3 miles? Heavy new supply (>2% of stock underway) typically softens rents 12–24 months out; light construction supports rent growth.
Investment metrics
- 1% rule
- 1.06% ✓
- Cap rate
- 8.56%
- Cash-on-cash
- 8.08%
- DSCR
- 1.36
- GRM
- 7.9
CMA / ARV
No comps found within radius.
Projected returns pro-forma
-3.0% appreciation · 1.45% rent growth · sell at horizon
- IRR
- -5.7%
- Equity multiple
- 0.79×
- Total profit
- $-48,371
- Equity at exit
- $123,756
- IRR
- 2.1%
- Equity multiple
- 1.14×
- Total profit
- $32,243
- Equity at exit
- $71,763
Cash invested: $232,400 (down + closing). Projections, not guarantees.
Landlord ↔ Tenant lean methodology
- Overall (CITY)
- 0 Strongly Tenant-Friendly
- State District of Columbia
- 12 Strongly Tenant-Friendly · D+43
- County
- — inherits STATE
- City Washington
- 0 Strongly Tenant-Friendly · D+43
ZIP-level market 20011
- Rents YoY
- 1.4%
- Active inventory
- 370
- Price-to-rent
- 31.5×
Monthly cashflow live
- Estimated rent
- $8,783 high interval (Pro) →
- Mortgage (P&I)
- −$4,353
- Tax from tax record
- −$675 /mo · $8,096/yr
- Insurance
- −$346
- HOA
- −$0
- Vacancy / Maint / Mgmt
- −$1,844
- Net cashflow
- $1,565
Break-even live
4-unit breakdown (identical units grouped — click to expand)
| Units | Beds | Baths | Est. rent |
|---|---|---|---|
| 4× units | 2 | 1 | $8,784 |
| #1 | 2 | 1 | $2,196 |
| #2 | 2 | 1 | $2,196 |
| #3 | 2 | 1 | $2,196 |
| #4 | 2 | 1 | $2,196 |
| Total (4 units) | $8,783 | ||
UW: 25.0% down · 7.5% · 30yr · 1.5% tax · 5.0% vac · 8.0% maint · 8.0% mgmt
Financing live
Cash to close
- Down payment
- $207,500
- Closing costs
- $24,900
- Reserves months
- —
- Total cash needed
- —
Loan-product check · same deal, 3 products live
Conventional
25% down · 7.5% · 30yr
- Down + closing
- —
- Monthly P&I
- —
- Monthly cashflow
- —
- DSCR
- —
- Eligible?
- —
Personal DTI + credit; lowest rate.
DSCR
20% down · 8.5% · 30yr
- Down + closing
- —
- Monthly P&I
- —
- Monthly cashflow
- —
- DSCR
- —
- Eligible?
- —
No personal income docs; deal must DSCR.
Hard money
10% down · 12.0% · 12mo
- Down + closing
- —
- Monthly P&I
- —
- Monthly cashflow
- —
- DSCR
- —
- Eligible?
- —
Short-term bridge; refi at stabilization.
Rent comps 31 comps
| Address | Beds | Baths | Sqft | Rent | $/sqft | DOM | Units | Dist |
|---|---|---|---|---|---|---|---|---|
| 5518 13th St NW Washington, DC | 4.0 | 2.5 | 2746 | $4,875 | $1.78 | 3d | 1 | 0.24mi |
| 1311 Fort Stevens Dr NW Unit 1 Washington, DC | 3.0 | 1.0 | 3108 | $2,500 | $0.80 | 22d | 1 | 0.33mi |
| 5308 13th St NW Washington, DC | 3.0 | 3.5 | 3300 | $4,000 | $1.21 | 24d | 1 | 0.38mi |
| 1317 Rittenhouse St NW Washington, DC | 5.0 | 3.0 | 2534 | $3,900 | $1.54 | 24d | 1 | 0.40mi |
| 1305 Rittenhouse St NW Washington, DC | 3.0 | 2.5 | 2177 | $3,850 | $1.77 | 24d | 1 | 0.40mi |
| 1419 Rittenhouse St NW Washington, DC | 3.0 | 1.5 | 2091 | $3,350 | $1.60 | 12d | 1 | 0.41mi |
| 5211 14th St NW Washington, DC | 4.0 | 3.0 | 2220 | $4,500 | $2.03 | 24d | 1 | 0.45mi |
| 617 Longfellow St NW Washington, DC | 4.0 | 3.5 | 2500 | $5,500 | $2.20 | 24d | 1 | 0.59mi |
| 520 Jefferson St NW Washington, DC | 4.0 | 4.0 | 2380 | $6,499 | $2.73 | 2d | 1 | 0.69mi |
| 5404 4th St NW #1 Washington, DC | 4.0 | 4.5 | 2250 | $5,500 | $2.44 | 4d | 1 | 0.81mi |
| 5404 4th St NW #2 Washington, DC | 4.0 | 3.5 | 2250 | $5,900 | $2.62 | 4d | 1 | 0.81mi |
| 4909 Illinois Ave NW Washington, DC | 3.0 | 2.0 | 2460 | $3,950 | $1.61 | 24d | 1 | 0.82mi |
| 4823 9th St NW Washington, DC | 4.0 | 2.0 | 2144 | $3,750 | $1.75 | 5d | 1 | 0.82mi |
| 1501 Crittenden St NW Washington, DC | 5.0 | 2.0 | 3310 | $9,000 | $2.72 | 24d | 1 | 0.89mi |
| 225 Missouri Ave NW Washington, DC | 5.0 | 4.5 | 2138 | $7,100 | $3.32 | 1d | 1 | 0.96mi |
| 4605 Georgia Ave NW Washington, DC | 4.0 | 3.0 | 2000 | $4,500 | $2.25 | 7d | 1 | 0.99mi |
| 513 Whittier St NW Washington, DC | 5.0 | 4.0 | 2352 | $6,275 | $2.67 | 3d | 1 | 1.00mi |
| 513 Whittier St NW Washington, DC | 5.0 | 4.0 | 2352 | $6,275 | $2.67 | 16d | 1 | 1.00mi |
| 432 Emerson St NW Washington, DC | 4.0 | 3.5 | 2340 | $5,800 | $2.48 | 16d | 1 | 1.00mi |
| 118 Longfellow St NW Washington, DC | 3.0 | 2.5 | 1803 | $7,804 | $4.33 | 1d | 1 | 1.07mi |
| 114 Sheridan St NW Washington, DC | 3.0 | 3.0 | 2359 | $4,850 | $2.06 | 24d | 1 | 1.09mi |
| 5201 2nd St NW Unit A Washington, DC | 4.0 | 2.5 | 2000 | $4,000 | $2.00 | 24d | 1 | 1.11mi |
| 5020 2nd St NW Unit 3 Washington, DC | 3.0 | 1.0 | 2880 | $3,245 | $1.13 | 24d | 1 | 1.13mi |
| 242 Emerson St NW Washington, DC | 4.0 | 2.5 | 1800 | $3,775 | $2.10 | 18d | 1 | 1.13mi |
| 1155 Dahlia St NW Washington, DC | 3.0–5.0 | 2.0–4.0 | 1422 | $1,275 | $0.90 | 1d | 17 | 1.13mi |
| 5520 N Capitol St NW Washington, DC | 4.0 | 3.5 | 2070 | $5,399 | $2.61 | 4d | 1 | 1.23mi |
| 4208 16th St NW Washington, DC | 4.0 | 2.5 | 3373 | $4,650 | $1.38 | 17d | 1 | 1.25mi |
| 5430 N Capitol St NW Washington, DC | 3.0 | 2.5 | 2400 | $4,200 | $1.75 | 5d | 1 | 1.25mi |
| 4023 New Hampshire Ave NW Washington, DC | 4.0 | 3.5 | 1946 | $5,950 | $3.06 | 24d | 1 | 1.47mi |
| 3007 Oliver St NW Washington, DC | 4.0 | 4.5 | 3654 | $6,475 | $1.77 | 11d | 1 | 1.49mi |
| 2820 Ellicott St NW Washington, DC | 5.0 | 3.5 | 3542 | $7,995 | $2.26 | 18d | 1 | 1.49mi |
Listing history 13 events
-
2026-06-18days on market $830,000 Active 20 DOM
-
2026-06-17days on market $830,000 Active 19 DOM
-
2026-06-16days on market $830,000 Active 18 DOM
-
2026-06-15days on market $830,000 Active 17 DOM
-
2026-06-13days on market $830,000 Active 15 DOM
-
2026-06-09days on market $830,000 Active 11 DOM
-
2026-06-08days on market $830,000 Active 10 DOM
-
2026-06-07days on market $830,000 Active 9 DOM
-
2026-06-04days on market $830,000 Active 6 DOM
-
2026-06-03days on market $830,000 Active 5 DOM
-
2026-06-02days on market $830,000 Active 4 DOM
-
2026-06-01days on market $830,000 Active 3 DOM
-
2026-05-31days on market $830,000 Active 2 DOM
ⓘ Source: listings_history table (triggers on properties + properties_extension) + one-shot
backfill from property_details.listing_events for pre-trigger history.
Tax reassessment forecast DC · Partial reset (capped growth)
- Current annual tax
- $8,096 · $675/mo
- Projected year-2 tax
- $8,096 · $675/mo
- Expected delta
- $0/yr ($0/mo · 0.0%)
ⓘ Screening estimate from a state-policy table — verify with the county assessor before closing.
Climate risk First Street
- Flood 1/10 Low FEMA zone X (unshaded) · 0% chance over 30 yrs
- Wildfire 3/10 Moderate
- Heat 7/10 Severe 7 d/yr ≥104°F today · 15 d/yr by 30 yrs out
- Wind 4/10 Moderate 16% chance of damaging wind over 30 yrs
- Air quality 4/10 Moderate 5 unhealthy d/yr today · 6 by 30 yrs out
Nearby sold comps map
Loading sold comps map…
Walkable amenities ~0.75 mi
Loading nearby amenities…
Taxation est. · year 1
- Rental income
- $105,396
- − Mortgage interest
- −$46,493
- − Property taxes
- −$8,096
- − Insurance
- −$4,150
- − Repairs & maintenance
- −$8,432
- − Management
- −$8,432
- − Depreciation
- −$24,145
- Taxable income
- $5,648
- Est. tax owed @ 24.0%
- −$1,356
- After-tax cash flow
- $17,430/yr
For passive investors: Depreciation is non-cash, so a rental often shows a tax loss while cash-flowing — sheltering income. Rental losses are passive: they offset passive income freely, and up to $25,000/yr can offset ordinary (W-2) income if you actively participate and your MAGI is under $100k (phasing out to $0 by $150k); unused losses carry forward. On sale, claimed depreciation is recaptured at up to 25%, and gains may owe capital-gains tax (a 1031 exchange can defer both). Figures are a year-1 estimate at your 24.0% rate — not tax advice; consult a CPA.
Schools (NCES district)
- District
- District Of Columbia Public Schools
- NCES district ID
- 1100030
- Math proficiency
- 33% ▲ 3.00%
- Reading proficiency
- 40% ▲ 5.00%
- Median HH income
- $67,671
- Composite
- 35.84/100
- National rank
- #9606
- State rank
- #8 of 32 in DC
Livability — Washington
- Score
- 73/100
- State rank
- #1
- US rank
- #5327
Category grades
Schools grade is shown separately in the Schools card above.
Census & demographics
- Census place
- Washington, DC
- County
- District of Columbia · 671,873 people
- City population
- 671,873
- Metro
- Washington-Arlington-Alexandria, DC-VA-MD-WV
- Population (ZIP)
- 67,434
- Household income
- $110,309
- Rent vs Own
- Severe rent burden
- 3020.0
Population outlook (District of Columbia County) Hauer SSP2
- Today (2025)
- 821,926 people
- By 2030
- 899,517 · +9.4%
- By 2040
- 1,061,162 · +29.1%
- By 2050
- 1,231,493 · +49.8%
- By 2075
- 1,603,312 · +95.1%
- By 2100
- 1,847,141 · +124.7%
Race, ethnicity, and origin ACS 2023
- Neighborhood character
- Diverse neighborhood (Simpson 0.66)
- Race & ethnicity
- Black 50% Hispanic / Latino 23% White 20% Two or more races 10% Asian 2%
- Hispanic origin (detail)
- Mexican 2% Dominican 1%
- Common ancestry
- Lithuanian 1% Romanian 1% Slovak 1%
- Foreign-born
- 21% · Canada
- Languages at home
- 70% English-only · Spanish 20% French/Haitian/Cajun 2% Other Indo-European 1%
Political lean MEDSL · District of Columbia
- 2024 margin
- Solid D (+86.1) · D 91.2% · R 5.1% · Other 3.8%
- 2008→2024 swing
- +0.1pp no change · 2008: 85.9pp · 2024: 86.1pp
- All cycles
- 2024: D+86.1 2020: D+86.8 2016: D+88.7 2012: D+84.2 2008: D+85.9
Not yet ingested
- Civics
- —
Market trends
- HPI YoY
- ▼ -755.96%
- Current HPI
- 378.1083
- Rent YoY
- ▲ 1.45%
- Metro
- Washington-Arlington-Alexandria, DC-VA-MD-WV
- State GDP YoY
- ▲ 1.33%
- F500 in state
- 6
Industry mix (Fortune 500 HQ in DC)
| Industry | F500 HQs | Revenue |
|---|---|---|
| Financial Services | 1 | $153B |
|
||
| Life Sciences / Industrials | 1 | $25B |
|
||
| Industrial Machinery | 1 | $8B |
|
||
Price history
+2271.4% since first listed6 events — show timeline
- 2026-05-29 Listed $830,000 BRIGHT MLS
- 1995-08-17 Sold (Public Records) $125,000 Public Records
- 1995-05-01 Sold (MLS) $125,000 MRIS
- 1995-01-23 Delisted — MRIS
- 1995-01-13 Listed $125,000 MRIS
- 1975-06-05 Sold (Public Records) $35,000 Public Records
Property tax history
+16.9%/yrLatest (2025): $8,096 · +0.9% YoY. Source: county tax records.
Cash-flow waterfall
monthlySold comps — $/sqft
last 12 mo · ≤1 miLoading sold comps…