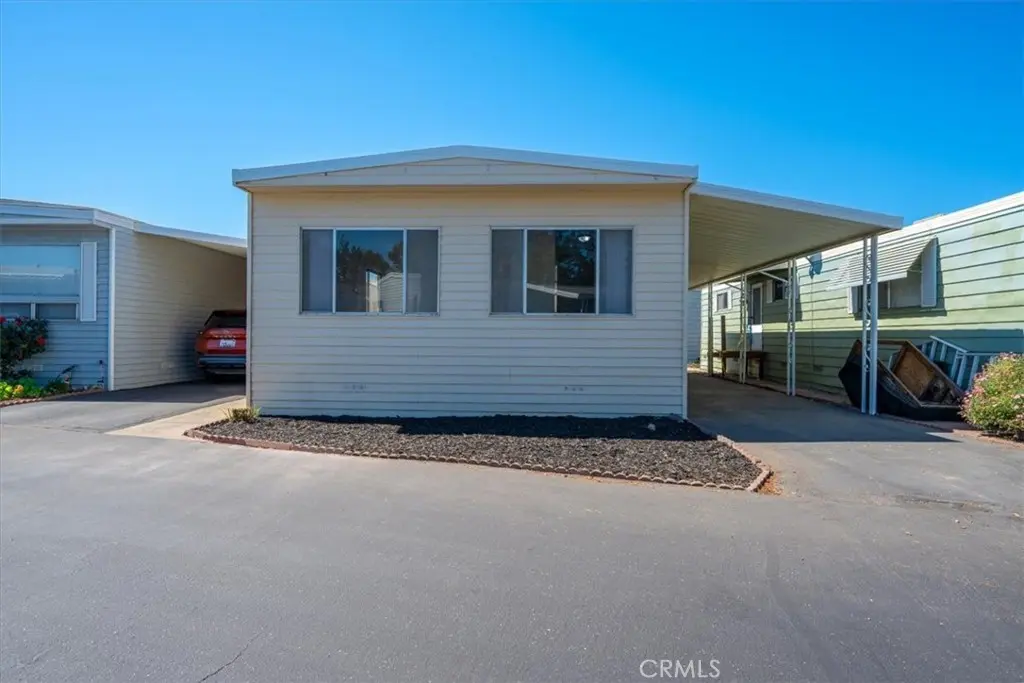
3210 Santa Maria Way #49 · Orcutt, CA
Flood risk 1/10 · Minimal
- FEMA flood zone
- X (unshaded)
- Chance of flooding over 30 yrs
- 0.0%
- Est. flood insurance / yr
- $507 – $1,088
Fire risk 4/10 · Minor
- Est. fire insurance / yr
- $659 – $1,223
Heat risk 3/10 · Minor
- Hot days now (above 85°F)
- 7 days/yr
- Hot days in 30 yrs
- 16 days/yr
Wind risk 1/10 · Minimal
- Chance of severe wind over 30 yrs
- —
Air-quality risk 6/10 · Moderate
- Unhealthy air days now
- 8 days/yr
- Unhealthy air days in 30 yrs
- 10 days/yr
Risk factors via First Street. Map © Google.
Why this score? — see what drove the B- grade
The composite is a weighted blend of 9 inputs, each scored 0–100. Each bar is that input's sub-score; the figure is the points it added to the 100-point composite (weight × sub-score).
- Cash flow +30.0/30.0
- 1% rule +10.0/10.0
- DSCR +10.0/10.0
- Schools +4.6/10.0
- ARV discount +4.1/15.0
- Livability +3.7/5.0
- Rent growth +3.1/5.0
- Condition / age +2.5/5.0
- Appreciation +0.0/10.0
$129,950
🖨 Deal sheet 📄 Offer letter ✓ Due diligence
Listing remarks
Welcome to this updated 1969 Hillcrest double-wide located in the Del Cielo Mobile Home Community. This 2-bedroom, 2-bath home offers a bright and inviting interior with abundant natural light throughout. Recently updated, the home features a clean and well-maintained living space that is move-in ready. The kitchen is equipped with a gas range, stainless steel refrigerator, and ample cabinetry for storage. Indoor laundry hookups add everyday convenience. Designed for comfortable living, this home provides a functional layout in an established community. Enjoy affordable space rent of $995 per month.
Key facts
- Ample cabinetry
- Gas range
- Built 1969
Tags
Property features AI
Finance
- Other: Double body type
- Financial info: Land lease: $995 per month
- HOA & community: Located in an urban manufactured home community; Park: Del Cielo MHC; Manager approval required for residency; Pets allowed with number limits
Exterior
- Parking: Located in Del Cielo Manufactured Home Community
- Utilities: Public sewer; District/Public water
- Home design: Single-story mobile home; Model: Hillcrest; Mobile home remains on site
- Construction: Mobile home approximately 20 ft by 40 ft; Total of 1 story; Year built source: Other
- Exterior features: No pool; Zero lot line
Interior
- Bathrooms: 2 full bathrooms
- Interior features: Front door entry; Entry level is 1
- Laundry & utility: Washer hookup; Gas dryer hookup; Has laundry
Neighborhood map
What this means for you Summary
Snapshot
- This is a 2-bed/2.0-bath manufactured listed at $130k.
Deal economics
- At list price, monthly cash flow is $1k ($13k/yr) — positive.
- The deal already cash-flows at list — no discount required.
- Meets the 1% rule at list price ($2k rent vs $130k).
- Recommended offer: $122k (6.0% below list) — sets the bar for market timing.
- Cap rate 16.2% vs local median 2.6% in Orcutt — top-decile yield for the area; either an underpriced asset or a hidden risk that comps aren't pricing in. Stress-test before assuming the spread holds.
Location & tenants
- Location reads 73/100 on livability (#169 in CA) — a middle-class / working-renter tenant base. Strengths: commute A+, employment A+, housing A+; Watch: crime D+, cost of living F.
- Orcutt Union Elementary (suburban): math 44% / reading 54% proficiency, ranked #414 of 1,400 in CA (top 30%) — families likely to look elsewhere, expect single-tenant / working-renter base with shorter leases.
- Market conditions: Rents rising (+2.2%/yr); 124 active listings in the ZIP; 7 comparable units currently listed for rent nearby; rentals at typical pace (median 14d on market — plan ~3-4 weeks tenant-placement turnaround); high-income renter base; 719 units permitted in Santa Barbara County in 2024 (217 in 5+ unit buildings).
Forward outlook
- Local home prices are declining (-3.0%/yr); year-one equity from $898 of loan paydown is wiped out by about $4k of value loss. Plan a longer hold.
- Santa Barbara County population projected at +20% by 2050 — long-run rental-demand tailwind backs the buy-and-hold thesis.
- At projected returns (-3.0% appreciation + 2.2% rent growth), your $36k cash investment doubles in ~4 years — after that, you're playing with house money.
Negotiation context
- It's been on market 70 days — a 6% lower offer ($122k) is reasonable based on typical stale-listing flexibility.
- 3 sale attempts; this cycle's ask has dropped $10k (7%) from the opening price — seller is motivated, your offer sets the floor, not the list.
Questions for the listing agent
- It's been on market 70 days. Have you received any prior offers? Is the seller open to a 6% concession, seller financing, or rate buy-down credit?
- Built in 1969 — when were the roof, HVAC, electrical panel, plumbing, and water heater last replaced?
- Why hasn't it sold? Are there any deal-killer items the seller is aware of (foundation, flood, title, zoning, code violations)?
- Is there a deadline driving the sale (1031 exchange, divorce, estate, relocation)? That informs how much negotiation room exists.
- Schools are B-rated — typically a magnet for longer-tenancy family renters. What's the average tenant stay here, and is there a school-zone premium baked into asking?
- Crime grade is D in this area — have there been break-ins, vandalism, or insurance claims at this property in the last 3 years? What carrier currently insures it and at what premium?
- What's the average days-on-market for RENTAL listings here right now (not sales)? A rising rental-DOM trend means longer vacancies and softer asking-rent achievability than the comps imply.
- What's the recent tenant-quality profile in this submarket — average credit score on applications, eviction rate, late-payment / NSF rate, and stable-employment percentage? A property-management company in the area should have these aggregated.
- How much new for-sale + rental construction is in the pipeline within 1–3 miles? Heavy new supply typically softens prices + rents 12–24 months out; constrained supply supports both.
Investment metrics
- 1% rule
- 1.92% ✓
- Cap rate
- 16.21%
- Cash-on-cash
- 35.41%
- DSCR
- 2.58
- GRM
- 4.3
CMA / ARV
- ARV (on-the-fly)
- $120,800
- Comps found
- 9
Show comp detail 9 sales within ~0.75 mi
| Address | Dist | Beds/Ba | Sqft | Sold | Price | $/sf | Match |
|---|---|---|---|---|---|---|---|
| 3210 Santa Maria Way #27 | 0.00mi | 2/2.0 | 800 (0%) | 8mo | $110,000 | $138 | 94 |
| 3210 Santa Maria Way #81 | 0.00mi | 2/2.0 | 800 (0%) | 8mo | $159,000 | $199 | 93 |
| 3210 Santa Maria Way #21 | 0.00mi | 2/2.0 | 840 (+5%) | 1mo | $159,950 | $190 | 91 |
| 3210 Santa Maria Way #66 | 0.00mi | 2/1.5 | 769 (-4%) | 12mo | $140,000 | $182 | 82 |
| 3210 Santa Maria Way #19 | 0.00mi | 1/1.0 (-1) | 780 (-2%) | 7mo | $115,000 | $147 | 81 |
| 3210 Santa Maria Way #90 | 0.00mi | 2/2.0 | 896 (+12%) | 6mo | $180,000 | $201 | 75 |
| 3210 Santa Maria Way #10 | 0.00mi | 2/1.0 | 859 (+7%) | 12mo | $120,000 | $140 | 74 |
| 3210 Santa Maria Way #46 | 0.00mi | 2/1.0 | 880 (+10%) | 8mo | $118,500 | $135 | 73 |
| 3210 Santa Maria Way #86 | 0.00mi | 2/1.0 | 860 (+8%) | 14mo | $129,900 | $151 | 72 |
Match score weights: distance 35% · size 25% · config 20% · recency 20%. Top-matched comps best support the ARV.
Projected returns pro-forma
-3.0% appreciation · 2.23% rent growth · sell at horizon
- IRR
- 30.2%
- Equity multiple
- 2.25×
- Total profit
- $45,442
- Equity at exit
- $19,376
- IRR
- 37.0%
- Equity multiple
- 4.30×
- Total profit
- $120,021
- Equity at exit
- $11,236
Cash invested: $36,386 (down + closing). Projections, not guarantees.
Landlord ↔ Tenant lean methodology
- Overall (STATE)
- 18 Strongly Tenant-Friendly
- State California
- 18 Strongly Tenant-Friendly · D+13
- County
- — inherits STATE
- City
- — inherits STATE
ZIP-level market 93455
- Rents YoY
- 2.2%
- Active inventory
- 124
- Price-to-rent
- 4.3×
Monthly cashflow live
- Estimated rent
- $2,496 high interval (Pro) →
- Mortgage (P&I)
- −$681
- Tax est. 1.5%
- −$162 /mo · $1,949/yr
- Insurance
- −$54
- HOA
- −$0
- Vacancy / Maint / Mgmt
- −$524
- Net cashflow
- $1,074
Break-even live
UW: 25.0% down · 7.5% · 30yr · 1.5% tax · 5.0% vac · 8.0% maint · 8.0% mgmt
Financing live
Cash to close
- Down payment
- $32,488
- Closing costs
- $3,898
- Reserves months
- —
- Total cash needed
- —
Loan-product check · same deal, 3 products live
Conventional
25% down · 7.5% · 30yr
- Down + closing
- —
- Monthly P&I
- —
- Monthly cashflow
- —
- DSCR
- —
- Eligible?
- —
Personal DTI + credit; lowest rate.
DSCR
20% down · 8.5% · 30yr
- Down + closing
- —
- Monthly P&I
- —
- Monthly cashflow
- —
- DSCR
- —
- Eligible?
- —
No personal income docs; deal must DSCR.
Hard money
10% down · 12.0% · 12mo
- Down + closing
- —
- Monthly P&I
- —
- Monthly cashflow
- —
- DSCR
- —
- Eligible?
- —
Short-term bridge; refi at stabilization.
Rent comps 7 comps
| Address | Beds | Baths | Sqft | Rent | $/sqft | DOM | Units | Dist |
|---|---|---|---|---|---|---|---|---|
| 3490 Santa Maria Way Unit 103F Santa Maria, CA | 2.0 | 1.5 | 1000 | $2,200 | $2.20 | 14d | 1 | 0.42mi |
| 3235 Orcutt Rd Orcutt, CA | 2.0–3.0 | 2.0 | 1202 | $2,695 | $2.24 | 14d | 5 | 0.58mi |
| 3519 Mercury Dr Bldg 5 Santa Maria, CA | 1.0 | 1.0 | 619 | $2,395 | $3.87 | 14d | 1 | 0.73mi |
| 504 Playa Blanca Ct Santa Maria, CA | 2.0 | 1.0 | 800 | $2,000 | $2.50 | 14d | 1 | 0.96mi |
| 958 Terrace Ave Santa Maria, CA | 1.0 | 1.0 | 555 | $1,360 | $2.45 | 14d | 1 | 0.98mi |
| 2460 Rubel Way Santa Maria, CA | 2.0–3.0 | 2.0 | 1230 | $2,992 | $2.43 | 14d | 11 | 1.07mi |
| 4036 Cedarhurst Dr Orcutt, CA | 1.0–2.0 | 1.0–2.0 | 781 | $2,648 | $3.39 | 14d | 6 | 1.24mi |
Listing history 23 events
-
2026-06-19price $129,950 Active 70 DOM
-
2026-06-18days on market $134,950 Active 70 DOM
-
2026-06-17days on market $134,950 Active 69 DOM
-
2026-06-16days on market $134,950 Active 68 DOM
-
2026-06-15days on market $134,950 Active 67 DOM
-
2026-06-14days on market $134,950 Active 65 DOM
-
2026-06-13days on market $134,950 Active 64 DOM
-
2026-06-10days on market $134,950 Active 62 DOM
-
2026-06-09days on market $134,950 Active 61 DOM
-
2026-06-08days on market $134,950 Active 60 DOM
-
2026-06-07days on market $134,950 Active 59 DOM
-
2026-06-05days on market $134,950 Active 56 DOM
-
2026-06-03days on market $134,950 Active 55 DOM
-
2026-06-02days on market $134,950 Active 54 DOM
-
2026-06-01days on market $134,950 Active 53 DOM
-
2026-05-31days on market $134,950 Active 52 DOM
-
2026-05-30days on market $134,950 Active 51 DOM
-
2026-05-22price $134,950
-
2026-04-16status Active
-
2026-04-09status Pending Sale
-
2026-04-02$139,950 Active
-
2026-04-02historical
-
2026-03-31$119,950 Active
ⓘ Source: listings_history table (triggers on properties + properties_extension) + one-shot
backfill from property_details.listing_events for pre-trigger history.
Climate risk First Street
- Flood 1/10 Low FEMA zone X (unshaded) · 0% chance over 30 yrs
- Wildfire 4/10 Moderate
- Heat 3/10 Moderate 7 d/yr ≥85°F today · 16 d/yr by 30 yrs out
- Wind 1/10 Low
- Air quality 6/10 Major 8 unhealthy d/yr today · 10 by 30 yrs out
Nearby sold comps map
Loading sold comps map…
Walkable amenities ~0.75 mi
Loading nearby amenities…
Taxation est. · year 1
- Rental income
- $29,950
- − Mortgage interest
- −$7,279
- − Property taxes
- −$1,949
- − Insurance
- −$650
- − Repairs & maintenance
- −$2,396
- − Management
- −$2,396
- − Depreciation
- −$3,780
- Taxable income
- $11,499
- Est. tax owed @ 24.0%
- −$2,760
- After-tax cash flow
- $10,124/yr
For passive investors: Depreciation is non-cash, so a rental often shows a tax loss while cash-flowing — sheltering income. Rental losses are passive: they offset passive income freely, and up to $25,000/yr can offset ordinary (W-2) income if you actively participate and your MAGI is under $100k (phasing out to $0 by $150k); unused losses carry forward. On sale, claimed depreciation is recaptured at up to 25%, and gains may owe capital-gains tax (a 1031 exchange can defer both). Figures are a year-1 estimate at your 24.0% rate — not tax advice; consult a CPA.
Schools (NCES district)
- District
- Orcutt Union Elementary
- NCES district ID
- 0628710
- Math proficiency
- 44% ▼ -1.00%
- Reading proficiency
- 54% ▲ 2.00%
- Median HH income
- $70,564
- Composite
- 45.96/100
- National rank
- #5530
- State rank
- #414 of 1400 in CA
Livability — Orcutt
- Score
- 73/100
- State rank
- #169
- US rank
- #5508
Category grades
Schools grade is shown separately in the Schools card above.
Census & demographics
- Census place
- Orcutt, CA
- County
- Santa Barbara County · 410,380 people
- Metro
- Santa Maria-Santa Barbara, CA
- Population (ZIP)
- 44,611
- Household income
- $110,661
- Rent vs Own
- Severe rent burden
- 765.0
Population outlook (Santa Barbara County) Hauer SSP2
- Today (2025)
- 484,679 people
- By 2030
- 505,323 · +4.3%
- By 2040
- 545,783 · +12.6%
- By 2050
- 584,263 · +20.5%
- By 2075
- 682,586 · +40.8%
- By 2100
- 723,188 · +49.2%
Race, ethnicity, and origin ACS 2023
- Neighborhood character
- Diverse neighborhood (Simpson 0.61)
- Race & ethnicity
- White 47% Hispanic / Latino 41% Two or more races 24% Asian 5% Black 2%
- Hispanic origin (detail)
- Mexican 38%
- Common ancestry
- Lithuanian 2% Russian 2% Italian 2%
- Foreign-born
- 13% · Canada, China, South Korea
- Languages at home
- 73% English-only · Spanish 23% Tagalog/Filipino 2%
Political lean MEDSL · Santa Barbara
- 2024 margin
- Strong D (+26.7) · D 61.8% · R 35.1% · Other 3.1%
- 2008→2024 swing
- +3.8pp toward D · 2008: 22.9pp · 2024: 26.7pp
- All cycles
- 2024: D+26.7 2020: D+32.1 2016: D+28.2 2012: D+17.1 2008: D+22.9
Not yet ingested
- Civics
- —
Market trends
- HPI YoY
- ▼ -729.78%
- Current HPI
- 314.6499
- Rent YoY
- ▲ 2.23%
- Metro
- Santa Maria-Santa Barbara, CA
- State GDP YoY
- ▲ 3.21%
- F500 in state
- 116
Industry mix (Fortune 500 HQ in CA)
| Industry | F500 HQs | Revenue |
|---|---|---|
| Technology | 27 | $1,492B |
|
||
| Financial Services | 3 | $174B |
|
||
| Retail | 3 | $44B |
|
||
| Insurance | 3 | $26B |
|
||
| Media / Entertainment | 2 | $115B |
|
||
| Pharmaceuticals / Biotech | 2 | $62B |
|
||
Price history
+12.5% since first listed6 events — show timeline
- 2026-05-22 Price Changed $134,950 CRMLS
- 2026-04-16 Relisted — CRMLS
- 2026-04-09 Pending — CRMLS
- 2026-04-02 Listing Removed — CRMLS
- 2026-04-02 Listed $139,950 CRMLS
- 2026-03-31 Listed $119,950 CRMLS
Cash-flow waterfall
monthlySold comps — $/sqft
last 12 mo · ≤1 miLoading sold comps…