 🏷️ Likely Rental
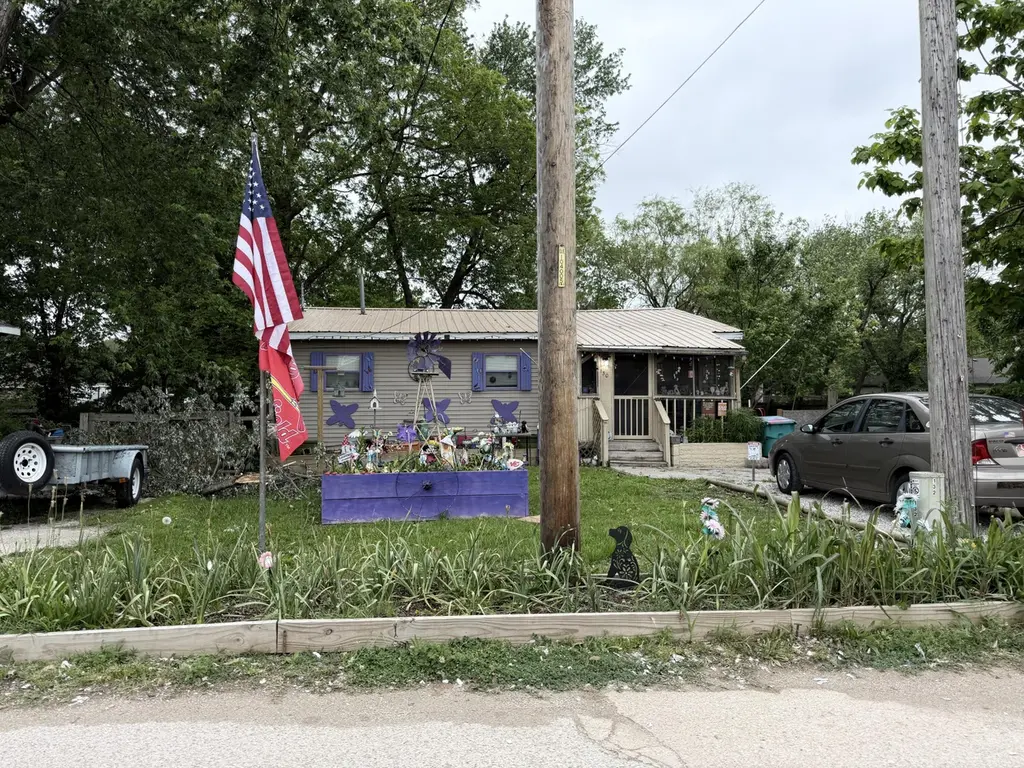
130 S Walnut Ave · Republic, MO
Flood risk 1/10 · Minimal
- FEMA flood zone
- X (unshaded)
- Chance of flooding over 30 yrs
- 0.0%
- Est. flood insurance / yr
- $507 – $1,088
Fire risk 4/10 · Minor
- Est. fire insurance / yr
- $1,054 – $1,958
Heat risk 5/10 · Moderate
- Hot days now (above 104°F)
- 7 days/yr
- Hot days in 30 yrs
- 19 days/yr
Wind risk 2/10 · Minimal
- Chance of severe wind over 30 yrs
- 1.0%
Air-quality risk 1/10 · Minimal
- Unhealthy air days now
- 0 days/yr
- Unhealthy air days in 30 yrs
- 0 days/yr
Risk factors via First Street. Map © Google.
Why this score? — see what drove the B grade
The composite is a weighted blend of 9 inputs, each scored 0–100. Each bar is that input's sub-score; the figure is the points it added to the 100-point composite (weight × sub-score).
- Cash flow +30.0/30.0
- 1% rule +10.0/10.0
- DSCR +10.0/10.0
- ARV discount +7.5/15.0
- Schools +4.8/10.0
- Livability +3.6/5.0
- Rent growth +3.4/5.0
- Condition / age +2.5/5.0
- Appreciation +0.0/10.0
$75,000
🖨 Deal sheet 📄 Offer letter ✓ Due diligence
Listing remarks
As-is sale -- priced for investors. Currently tenant occupied at $820/month in the growing community of Republic, MO. Located within walking distance of J. R. Martin Park, a well-maintained community park featuring a playground, pavilion, walking trails, and veteran tributes.
Key facts
- Pavilion
- Walking distance
- Community park
Tags
Property features AI
Finance
- Other: Location: 130 S Walnut Ave, Republic, MO 65738
- Financial info: Tax information provided (amount not included per instructions)
- HOA & community: HOA details not specified
Exterior
- Parking: Parking details not specified
- Security: Security details not specified
- Utilities: Public water; Public sewer
- Home design: Single-family residence; Residential property; One story
- Construction: Construction details not specified; Above-grade finished area approximately 952
- Exterior features: Metal roof; Lot approximately 0.22 acre
Interior
- Kitchen: Kitchen details not specified
- Bedrooms: Bedrooms not specified
- Flooring: Flooring details not specified
- Bathrooms: 2 full bathrooms
- Heating & cooling: Central air conditioning; Natural gas heating; Forced air heating
- Interior features: One-level living
- Laundry & utility: Laundry details not specified
Neighborhood map
What this means for you Summary
Snapshot
- This is a 2-bed/2.0-bath other listed at $75k.
Deal economics
- At list price, monthly cash flow is $403 ($5k/yr) — positive.
- The deal already cash-flows at list — no discount required.
- Meets the 1% rule at list price ($1k rent vs $75k).
- Recommended offer: $73k (3.0% below list) — sets the bar for market timing.
- Cap rate 12.7% vs local median 4.0% in Republic — top-decile yield for the area; either an underpriced asset or a hidden risk that comps aren't pricing in. Stress-test before assuming the spread holds.
Location & tenants
- Location reads 72/100 on livability (#92 in MO) — a middle-class / working-renter tenant base. Strengths: cost of living A+, housing A+, crime A; Watch: amenities F, commute F, health & safety F.
- Republic R-III (suburban): math 56% / reading 57% proficiency, ranked #19 of 324 in MO (top 6%) — acceptable for families but not a draw, mixed tenant base, ~2y average lease.
- Zoned schools: Republic Middle (math 50% / reading 53%, grade C, #57 of 391 statewide, top 15%, 1,146 students, 39% FRL); Republic High (math 56% / reading 60%, grade C, #48 of 521 statewide, top 9%, 1,542 students, 31% FRL) — zoned schools at 35% FRL track the district average.
- Market conditions: Rents rising (+3.6%/yr); 478 active listings in the ZIP; 5 comparable units currently listed for rent nearby; rentals at typical pace (median 21d on market — plan ~3-4 weeks tenant-placement turnaround); 40% of comp listings sitting > 30 days — soft ceiling on asking rent; 1,302 units permitted in Greene County in 2024 (250 in 5+ unit buildings).
Forward outlook
- Local home prices are declining (-3.0%/yr); year-one equity from $519 of loan paydown is wiped out by about $2k of value loss. Plan a longer hold.
- Greene County population projected at +25% by 2050 — long-run rental-demand tailwind backs the buy-and-hold thesis.
- At projected returns (-3.0% appreciation + 3.6% rent growth), your $21k cash investment doubles in ~6 years — after that, you're playing with house money.
Negotiation context
- It's been on market 35 days — a 3% lower offer ($73k) is reasonable based on typical stale-listing flexibility.
- 4 sale attempts since 10y ago with the ask held roughly flat each time — persistent listings suggest the price (not the market) is what's stuck; bring a comps-based counter.
Risks & watch-outs
- Climate carrying-cost: extreme-heat days projected 7→19/yr by 2055 (HVAC capex compounding) — expect insurance premiums to compound above CPI over the hold.
Questions for the listing agent
- It's been on market 35 days. Have you received any prior offers? Is the seller open to a 3% concession, seller financing, or rate buy-down credit?
- Built in 1960 — when were the roof, HVAC, electrical panel, plumbing, and water heater last replaced?
- Is there a deadline driving the sale (1031 exchange, divorce, estate, relocation)? That informs how much negotiation room exists.
- Schools are B-rated — typically a magnet for longer-tenancy family renters. What's the average tenant stay here, and is there a school-zone premium baked into asking?
- What's the average days-on-market for RENTAL listings here right now (not sales)? A rising rental-DOM trend means longer vacancies and softer asking-rent achievability than the comps imply.
- What's the recent tenant-quality profile in this submarket — average credit score on applications, eviction rate, late-payment / NSF rate, and stable-employment percentage? A property-management company in the area should have these aggregated.
- How much new for-sale + rental construction is in the pipeline within 1–3 miles? Heavy new supply typically softens prices + rents 12–24 months out; constrained supply supports both.
Investment metrics
- 1% rule
- 1.50% ✓
- Cap rate
- 12.73%
- Cash-on-cash
- 23.00%
- DSCR
- 2.02
- GRM
- 5.6
CMA / ARV
- ARV (median comp)
- $169,940
- List price
- $75,000
- Delta
- -55.87%
- Verdict
- UNDERPRICED
- Comps
- 20 within 1.0 mi
Projected returns pro-forma
-3.0% appreciation · 3.61% rent growth · sell at horizon
- IRR
- 16.6%
- Equity multiple
- 1.67×
- Total profit
- $14,174
- Equity at exit
- $11,183
- IRR
- 25.6%
- Equity multiple
- 3.30×
- Total profit
- $48,218
- Equity at exit
- $6,485
Cash invested: $21,000 (down + closing). Projections, not guarantees.
Landlord ↔ Tenant lean methodology
- Overall (STATE)
- 81 Strongly Landlord-Friendly
- State Missouri
- 81 Strongly Landlord-Friendly · R+10
- County
- — inherits STATE
- City
- — inherits STATE
ZIP-level market 65738
- Home prices YoY
- -32.2%
- Rents YoY
- 3.6%
- Active inventory
- 478
- Price-to-rent
- 5.6×
Monthly cashflow live
- Estimated rent
- $1,122 high interval (Pro) →
- Mortgage (P&I)
- −$393
- Tax from tax record
- −$59 /mo · $713/yr
- Insurance
- −$31
- HOA
- −$0
- Vacancy / Maint / Mgmt
- −$236
- Net cashflow
- $403
Break-even live
UW: 25.0% down · 7.5% · 30yr · 1.5% tax · 5.0% vac · 8.0% maint · 8.0% mgmt
Financing live
Cash to close
- Down payment
- $18,750
- Closing costs
- $2,250
- Reserves months
- —
- Total cash needed
- —
Loan-product check · same deal, 3 products live
Conventional
25% down · 7.5% · 30yr
- Down + closing
- —
- Monthly P&I
- —
- Monthly cashflow
- —
- DSCR
- —
- Eligible?
- —
Personal DTI + credit; lowest rate.
DSCR
20% down · 8.5% · 30yr
- Down + closing
- —
- Monthly P&I
- —
- Monthly cashflow
- —
- DSCR
- —
- Eligible?
- —
No personal income docs; deal must DSCR.
Hard money
10% down · 12.0% · 12mo
- Down + closing
- —
- Monthly P&I
- —
- Monthly cashflow
- —
- DSCR
- —
- Eligible?
- —
Short-term bridge; refi at stabilization.
Rent comps 5 comps
| Address | Beds | Baths | Sqft | Rent | $/sqft | DOM | Units | Dist |
|---|---|---|---|---|---|---|---|---|
| 217 W Logan St Republic, MO | 2.0 | 1.0 | 800 | $1,300 | $1.62 | 21d | 1 | 0.49mi |
| 223 N Cedar Ave Unit A205 Republic, MO | 1.0 | 1.0 | 800 | $650 | $0.81 | 13d | 1 | 0.58mi |
| 912 N Walnut Ave Unit 06 Republic, MO | 2.0 | 1.0 | 750 | $775 | $1.03 | 43d | 1 | 0.88mi |
| 912 N Walnut Ave Unit 15 Republic, MO | 2.0 | 1.0 | 750 | $775 | $1.03 | 21d | 1 | 0.88mi |
| 1740 E Hamilton St Republic, MO | 1.0–3.0 | 1.0–2.0 | 1110 | $1,195 | $1.08 | 43d | 7 | 1.45mi |
Listing history 25 events
-
2026-06-18status $75,000 Pending 35 DOM
-
2026-06-18days on market $75,000 Active 35 DOM
-
2026-06-17days on market $75,000 Active 34 DOM
-
2026-06-16days on market $75,000 Active 33 DOM
-
2026-06-15days on market $75,000 Active 32 DOM
-
2026-06-14days on market $75,000 Active 30 DOM
-
2026-06-13days on market $75,000 Active 29 DOM
-
2026-06-10days on market $75,000 Active 27 DOM
-
2026-06-09days on market $75,000 Active 26 DOM
-
2026-06-08days on market $75,000 Active 25 DOM
-
2026-06-07days on market $75,000 Active 24 DOM
-
2026-06-05days on market $75,000 Active 21 DOM
-
2026-06-03days on market $75,000 Active 20 DOM
-
2026-06-02days on market $75,000 Active 19 DOM
-
2026-06-01days on market $75,000 Active 18 DOM
-
2026-05-31days on market $75,000 Active 17 DOM
-
2026-05-30days on market $75,000 Active 16 DOM
-
2026-05-14$75,000 Active 276-char remark
-
2019-04-18soldstatus $350,000
-
2018-11-29$67,500
-
2017-05-13$65,000
-
2016-04-24$84,900
-
2013-11-14soldstatus
-
2005-10-21soldstatus
-
2005-10-11soldstatus
ⓘ Source: listings_history table (triggers on properties + properties_extension) + one-shot
backfill from property_details.listing_events for pre-trigger history.
Tax reassessment forecast MO · Resets to sale price
- Current annual tax
- $713 · $59/mo
- Projected year-2 tax
- $728 · $61/mo
- Expected delta
- +$14/yr (+$1/mo · 2.0%)
ⓘ Screening estimate from a state-policy table — verify with the county assessor before closing.
Climate risk First Street
- Flood 1/10 Low FEMA zone X (unshaded) · 0% chance over 30 yrs
- Wildfire 4/10 Moderate
- Heat 5/10 Major 7 d/yr ≥104°F today · 19 d/yr by 30 yrs out
- Wind 2/10 Low 100% chance of damaging wind over 30 yrs
- Air quality 1/10 Low 0 unhealthy d/yr today · 0 by 30 yrs out
Nearby sold comps map
Loading sold comps map…
Walkable amenities ~0.75 mi
Loading nearby amenities…
Taxation est. · year 1
- Rental income
- $13,467
- − Mortgage interest
- −$4,201
- − Property taxes
- −$713
- − Insurance
- −$375
- − Repairs & maintenance
- −$1,077
- − Management
- −$1,077
- − Depreciation
- −$2,182
- Taxable income
- $3,841
- Est. tax owed @ 24.0%
- −$922
- After-tax cash flow
- $3,909/yr
For passive investors: Depreciation is non-cash, so a rental often shows a tax loss while cash-flowing — sheltering income. Rental losses are passive: they offset passive income freely, and up to $25,000/yr can offset ordinary (W-2) income if you actively participate and your MAGI is under $100k (phasing out to $0 by $150k); unused losses carry forward. On sale, claimed depreciation is recaptured at up to 25%, and gains may owe capital-gains tax (a 1031 exchange can defer both). Figures are a year-1 estimate at your 24.0% rate — not tax advice; consult a CPA.
Schools (NCES district)
- District
- Republic R-III
- NCES district ID
- 2926220
- Math proficiency
- 56% ▲ 2.00%
- Reading proficiency
- 57% ▼ -1.00%
- Median HH income
- $51,329
- Composite
- 48.3/100
- National rank
- #2152
- State rank
- #19 of 324 in MO
Livability — Republic
- Score
- 72/100
- State rank
- #92
- US rank
- #6228
Category grades
Schools grade is shown separately in the Schools card above.
Census & demographics
- Census place
- Republic, MO
- County
- Greene County · 244,327 people
- City population
- 21,283
- Metro
- Springfield, MO
- Population (ZIP)
- 21,283
- Household income
- $67,841
- Rent vs Own
- Severe rent burden
- 461.0
Population outlook (Greene County) Hauer SSP2
- Today (2025)
- 319,054 people
- By 2030
- 335,135 · +5.0%
- By 2040
- 366,186 · +14.8%
- By 2050
- 397,431 · +24.6%
- By 2075
- 477,035 · +49.5%
- By 2100
- 520,828 · +63.2%
Race, ethnicity, and origin ACS 2023
- Neighborhood character
- Predominantly White (91%)
- Race & ethnicity
- White 91% Two or more races 4% Hispanic / Latino 3% Black 1%
- Common ancestry
- Italian 2% Lithuanian 2% Portuguese 2%
- Foreign-born
- 1% · Canada, China
- Languages at home
- 98% English-only · Spanish 1%
Political lean MEDSL · Greene
- 2024 margin
- Strong R (+20.8) · D 38.9% · R 59.7% · Other 1.4%
- 2008→2024 swing
- -5.0pp toward R · 2008: -15.8pp · 2024: -20.8pp
- All cycles
- 2024: R+20.8 2020: R+20.1 2016: R+27.4 2012: R+24.4 2008: R+15.8
Not yet ingested
- Civics
- —
Market trends
- HPI YoY
- ▼ -102.93%
- Current HPI
- 217.1512
- Rent YoY
- ▲ 3.61%
- Metro
- Springfield, MO
- State GDP YoY
- ▲ 1.84%
- F500 in state
- 20
Industry mix (Fortune 500 HQ in MO)
| Industry | F500 HQs | Revenue |
|---|---|---|
| Healthcare | 1 | $163B |
|
||
| Insurance | 1 | $21B |
|
||
| Industrial Technology | 1 | $17B |
|
||
| Retail | 1 | $16B |
|
||
| Industrial Distribution | 1 | $10B |
|
||
| Utilities | 1 | $9B |
|
||
Price history
-11.7% since first listed8 events — show timeline
- 2026-05-14 Listed $75,000 SOMO
- 2019-04-18 Sold (Public Records) $350,000 Public Records
- 2018-11-29 Listed $67,500 SOMO
- 2017-05-13 Listed $65,000 SOMO
- 2016-04-24 Listed $84,900 SOMO
- 2013-11-14 Sold (Public Records) — Public Records
- 2005-10-21 Sold (Public Records) — Public Records
- 2005-10-11 Sold (Public Records) — Public Records
Property tax history
+2.0%/yrLatest (2025): $713 · +7.7% YoY. Source: county tax records.
Cash-flow waterfall
monthlySold comps — $/sqft
last 12 mo · ≤1 miLoading sold comps…