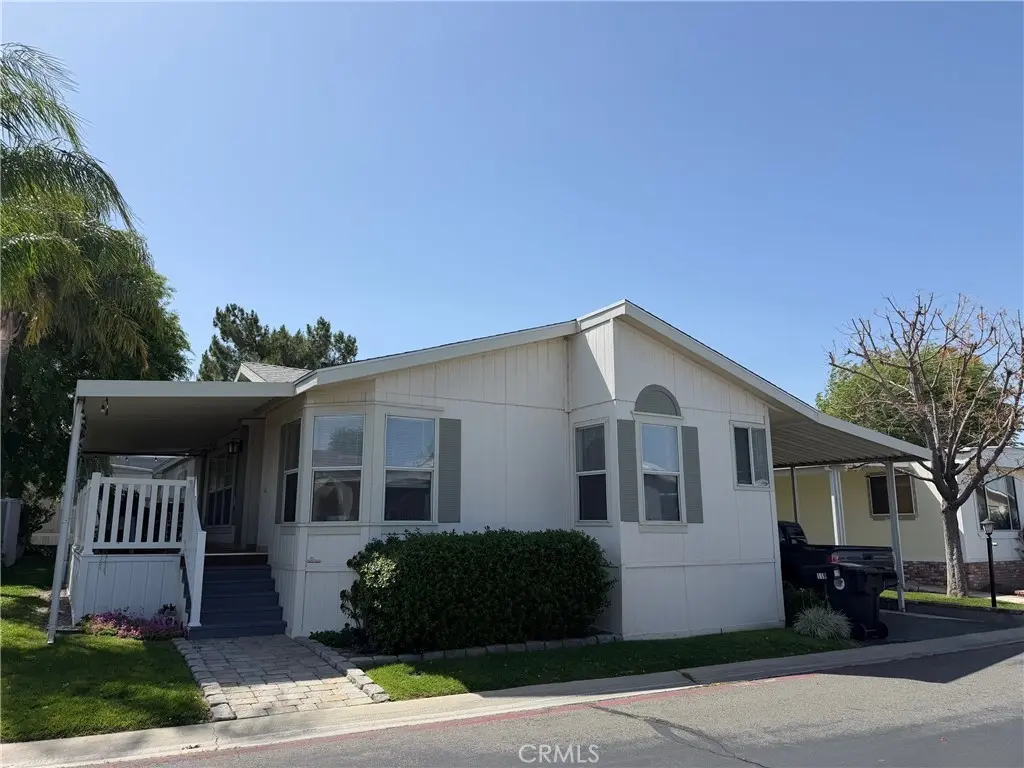
27361 Sierra Hwy #119 · Santa Clarita, CA
Flood risk 1/10 · Minimal
- FEMA flood zone
- X (unshaded)
- Chance of flooding over 30 yrs
- 0.0%
- Est. flood insurance / yr
- $507 – $1,088
Fire risk 8/10 · Major
- Est. fire insurance / yr
- $659 – $1,223
Heat risk 7/10 · Major
- Hot days now (above 98°F)
- 7 days/yr
- Hot days in 30 yrs
- 21 days/yr
Wind risk 1/10 · Minimal
- Chance of severe wind over 30 yrs
- —
Air-quality risk 6/10 · Moderate
- Unhealthy air days now
- 9 days/yr
- Unhealthy air days in 30 yrs
- 13 days/yr
Risk factors via First Street. Map © Google.
Why this score? — see what drove the C- grade
The composite is a weighted blend of 9 inputs, each scored 0–100. Each bar is that input's sub-score; the figure is the points it added to the 100-point composite (weight × sub-score).
- Cash flow +18.1/30.0
- ARV discount +6.4/15.0
- Schools +5.9/10.0
- DSCR +5.7/10.0
- 1% rule +4.9/10.0
- Condition / age +3.8/5.0
- Livability +3.5/5.0
- Rent growth +2.9/5.0
- Appreciation +0.0/10.0
$350,000
🖨 Deal sheet 📄 Offer letter ✓ Due diligence
Listing remarks
Beautifully maintained home in the desirable Cordova Estates community! This inviting residence features a brand-new front porch with all-new vinyl railing, a sun-blocking roller shade, and vinyl wind blocker—perfect for relaxing outdoors in comfort. Inside, you’ll find a spacious and well-designed floor plan with a separate dining room, ideal for entertaining. The open layout offers great flow and functionality, creating a comfortable living environment throughout. The spacious kitchen features newer appliances, a center island, abundant cabinetry, and a convenient closet pantry for extra storage. The generously sized primary bedroom includes a walk-in closet, adding to the hom
Key facts
- Separate dining room
- Walk-in closet
- Front porch
Tags
Property features AI
Finance
- Other: Living area source: Assessor's data; Parcel number: 8950082119
- Financial info: Land lease amount approximately $1,105.19 per month
- HOA & community: Land lease community with monthly land lease
Exterior
- Parking: Located in Cordova Mobile Estates
- Utilities: Public sewer; District/public water
- Home design: Single-story home; Mobile home remains on site; Entry on street level; Mobile dimensions approx. 26 ft by 60 ft
- Construction: Year built: Other (source indicates nonstandard); Built with mobile home construction
- Exterior features: Community pool; Landscaped grounds; Street lighting in the community
Interior
- Bathrooms: 2 full bathrooms
- Interior features: Street-level entry
- Laundry & utility: Washer included; Dryer included
Neighborhood map
What this means for you Summary
Snapshot
- This is a 3-bed/2.0-bath manufactured listed at $350k. Condition is rated good.
Deal economics
- At list price, monthly cash flow is $309 ($4k/yr) — positive.
- The deal already cash-flows at list — no discount required.
- To meet the 1% rule (rent ≥ 1% of price), the offer needs to be $345k (1.4% below list).
- Recommended offer: $329k (6.0% below list) — sets the bar for market timing.
- Cap rate 7.4% vs local median 2.8% in Santa Clarita — top-decile yield for the area; either an underpriced asset or a hidden risk that comps aren't pricing in. Stress-test before assuming the spread holds.
Location & tenants
- Location reads 70/100 on livability (#229 in CA) — a middle-class / working-renter tenant base. Strengths: employment A+, housing A, crime A-; Watch: amenities D+, cost of living F, health & safety F.
- William S. Hart Union High (suburban): math 52% / reading 72% proficiency, ranked #155 of 1,400 in CA (top 11%) — acceptable for families but not a draw, mixed tenant base, ~2y average lease; only 18% free/reduced lunch — higher-income household profile.
- Market conditions: Rents rising (+1.7%/yr); 106 active listings in the ZIP; 19 comparable units currently listed for rent nearby; rentals leasing fast (median 1d on market — plan ~1-2 weeks tenant-placement turnaround); high-income renter base; 19,697 units permitted in Los Angeles County in 2024 (9,426 in 5+ unit buildings).
- This rent runs 36% of the median local income ($115k/yr) — at the standard rent-burdened threshold; future hikes will face affordability resistance.
Forward outlook
- Local home prices are declining (-3.0%/yr); year-one equity from $2k of loan paydown is wiped out by about $10k of value loss. Plan a longer hold.
- Los Angeles County population projected at +9% by 2050 — modest demand growth; plan on rents tracking national, not racing it.
Negotiation context
- It's been on market 61 days — a 6% lower offer ($329k) is reasonable based on typical stale-listing flexibility.
Risks & watch-outs
- Climate carrying-cost: severe wildfire risk; extreme-heat days projected 7→21/yr by 2055 (HVAC capex compounding) — expect insurance premiums to compound above CPI over the hold.
Questions for the listing agent
- It's been on market 61 days. Have you received any prior offers? Is the seller open to a 6% concession, seller financing, or rate buy-down credit?
- Why hasn't it sold? Are there any deal-killer items the seller is aware of (foundation, flood, title, zoning, code violations)?
- Is there a deadline driving the sale (1031 exchange, divorce, estate, relocation)? That informs how much negotiation room exists.
- Schools are B-rated — typically a magnet for longer-tenancy family renters. What's the average tenant stay here, and is there a school-zone premium baked into asking?
- What's the average days-on-market for RENTAL listings here right now (not sales)? A rising rental-DOM trend means longer vacancies and softer asking-rent achievability than the comps imply.
- What's the recent tenant-quality profile in this submarket — average credit score on applications, eviction rate, late-payment / NSF rate, and stable-employment percentage? A property-management company in the area should have these aggregated.
- How much new for-sale + rental construction is in the pipeline within 1–3 miles? Heavy new supply typically softens prices + rents 12–24 months out; constrained supply supports both.
Investment metrics
- 1% rule
- 0.99% ✗
- Cap rate
- 7.35%
- Cash-on-cash
- 3.78%
- DSCR
- 1.17
- GRM
- 8.4
CMA / ARV
- ARV (on-the-fly)
- $341,992
- Comps found
- 6
Show comp detail 6 sales within ~0.75 mi
| Address | Dist | Beds/Ba | Sqft | Sold | Price | $/sf | Match |
|---|---|---|---|---|---|---|---|
| 27361 Sierra Hwy Spc 294 | 0.00mi | 3/2.0 | 1,680 (-3%) | 10mo | $255,000 | $152 | 86 |
| 27361 Sierra Hwy #312 | 0.00mi | 4/2.0 (+1) | 1,782 (+3%) | 17mo | $350,500 | $197 | 76 |
| 27361 Sierra Hwy #41 | 0.00mi | 2/2.0 (-1) | 1,573 (-9%) | 14mo | $274,900 | $175 | 68 |
| 27361 Sierra HWY #246 | 0.09mi | 4/2.0 (+1) | 1,608 (-7%) | 14mo | $360,000 | $224 | 67 |
| 27361 Sierra Hwy #277 | 0.00mi | 3/2.0 | 1,494 (-14%) | 12mo | $305,000 | $204 | 67 |
| 18540 Soledad Canyon Rd #85 | 0.38mi | 3/2.0 | 1,680 (-3%) | 23mo | $235,000 | $140 | 58 |
Match score weights: distance 35% · size 25% · config 20% · recency 20%. Top-matched comps best support the ARV.
Projected returns pro-forma
-3.0% appreciation · 1.7% rent growth · sell at horizon
- IRR
- -11.8%
- Equity multiple
- 0.58×
- Total profit
- $-41,453
- Equity at exit
- $52,186
- IRR
- -4.7%
- Equity multiple
- 0.71×
- Total profit
- $-28,381
- Equity at exit
- $30,262
Cash invested: $98,000 (down + closing). Projections, not guarantees.
Landlord ↔ Tenant lean methodology
- Overall (STATE)
- 18 Strongly Tenant-Friendly
- State California
- 18 Strongly Tenant-Friendly · D+13
- County
- — inherits STATE
- City
- — inherits STATE
ZIP-level market 91351
- Rents YoY
- 1.7%
- Active inventory
- 106
- Price-to-rent
- 8.4×
Monthly cashflow live
- Estimated rent
- $3,453 high interval (Pro) →
- Mortgage (P&I)
- −$1,835
- Tax est. 1.5%
- −$438 /mo · $5,250/yr
- Insurance
- −$146
- HOA
- −$0
- Vacancy / Maint / Mgmt
- −$725
- Net cashflow
- $309
Break-even live
UW: 25.0% down · 7.5% · 30yr · 1.5% tax · 5.0% vac · 8.0% maint · 8.0% mgmt
Financing live
Cash to close
- Down payment
- $87,500
- Closing costs
- $10,500
- Reserves months
- —
- Total cash needed
- —
Loan-product check · same deal, 3 products live
Conventional
25% down · 7.5% · 30yr
- Down + closing
- —
- Monthly P&I
- —
- Monthly cashflow
- —
- DSCR
- —
- Eligible?
- —
Personal DTI + credit; lowest rate.
DSCR
20% down · 8.5% · 30yr
- Down + closing
- —
- Monthly P&I
- —
- Monthly cashflow
- —
- DSCR
- —
- Eligible?
- —
No personal income docs; deal must DSCR.
Hard money
10% down · 12.0% · 12mo
- Down + closing
- —
- Monthly P&I
- —
- Monthly cashflow
- —
- DSCR
- —
- Eligible?
- —
Short-term bridge; refi at stabilization.
Rent comps 19 comps
| Address | Beds | Baths | Sqft | Rent | $/sqft | DOM | Units | Dist |
|---|---|---|---|---|---|---|---|---|
| 27105 Silver Oak Ln Canyon Country, CA | 1.0–3.0 | 1.0–2.0 | 1021 | $3,785 | $3.71 | 1d | 25 | 0.36mi |
| 18211 Flynn Dr #144 Canyon Country, CA | 2.0 | 2.0 | 1085 | $2,700 | $2.49 | 1d | 1 | 0.46mi |
| 27070 Hidaway Ave #4 Canyon Country, CA | 2.0 | 1.5 | 1078 | $3,200 | $2.97 | 2d | 1 | 0.47mi |
| 26827 Circle of the Oaks Newhall, CA | 2.0 | 2.0 | 1254 | $2,550 | $2.03 | 10d | 1 | 0.47mi |
| 27520 Sierra Hwy Canyon Country, CA | 1.0–3.0 | 1.0–2.0 | 965 | $2,995 | $3.10 | 1d | 1 | 0.49mi |
| 18135 Erik Ct Canyon Country, CA | 3.0 | 2.0 | 1155 | $3,200 | $2.77 | 1d | 1 | 0.51mi |
| 18742 Vista Del Canon Santa Clarita, CA | 3.0 | 2.0 | 1132 | $2,800 | $2.47 | 1d | 1 | 0.52mi |
| 18005 Annes Cir Canyon Country, CA | 1.0–3.0 | 1.0–2.5 | 979 | $3,499 | $3.57 | 1d | 10 | 0.57mi |
| 17991 Lost Canyon Rd Canyon Country, CA | 3.0 | 2.0 | 1280 | $3,225 | $2.52 | 15d | 1 | 0.70mi |
| 26752 Winsome Cir Newhall, CA | 2.0 | 2.0 | 1120 | $2,950 | $2.63 | 1d | 1 | 0.78mi |
| 17954 River Cir Canyon Country, CA | 3.0 | 3.0 | 1225 | $2,995 | $2.44 | 1d | 1 | 0.93mi |
| 17621 Pauline Ct Canyon Country, CA | 2.0–3.0 | 2.5 | 1200 | $3,389 | $2.82 | 1d | 8 | 1.06mi |
| 19331 Green Mountain Dr Newhall, CA | 3.0 | 3.0 | 1587 | $4,150 | $2.61 | 1d | 1 | 1.16mi |
| 19300 Maybrook LN Santa Clarita, CA | 1.0–3.0 | 1.0–2.0 | 1017 | $3,744 | $3.68 | 1d | 61 | 1.19mi |
| 26844 Albion Way Unit 1 Santa Clarita, CA | 3.0 | 2.5 | 1817 | $3,995 | $2.20 | 12d | 1 | 1.23mi |
| 17846 Wildridge Ln Canyon Country, CA | 4.0 | 3.0 | 1884 | $4,995 | $2.65 | 2d | 1 | 1.28mi |
| 17350 Humphreys Pkwy Canyon Country, CA | 1.0–3.0 | 1.0–2.0 | 1009 | $4,000 | $3.96 | 1d | 65 | 1.30mi |
| 26379 Rainbow Glen Dr Newhall, CA | 3.0 | 2.0 | 1427 | $3,600 | $2.52 | 1d | 1 | 1.48mi |
| 26350 Piazza Di Sarro Newhall, CA | 3.0 | 3.0 | 1797 | $4,000 | $2.23 | 10d | 1 | 1.48mi |
Listing history 15 events
-
2026-06-18days on market $350,000 Active 61 DOM
-
2026-06-17days on market $350,000 Active 60 DOM
-
2026-06-16days on market $350,000 Active 59 DOM
-
2026-06-15days on market $350,000 Active 58 DOM
-
2026-06-13days on market $350,000 Active 56 DOM
-
2026-06-13days on market $350,000 Active 55 DOM
-
2026-06-09days on market $350,000 Active 52 DOM
-
2026-06-08days on market $350,000 Active 51 DOM
-
2026-06-07days on market $350,000 Active 50 DOM
-
2026-06-04days on market $350,000 Active 47 DOM
-
2026-06-03days on market $350,000 Active 46 DOM
-
2026-06-02days on market $350,000 Active 45 DOM
-
2026-06-01days on market $350,000 Active 44 DOM
-
2026-05-31days on market $350,000 Active 43 DOM
-
2026-04-18$350,000 Active
ⓘ Source: listings_history table (triggers on properties + properties_extension) + one-shot
backfill from property_details.listing_events for pre-trigger history.
Climate risk First Street
- Flood 1/10 Low FEMA zone X (unshaded) · 0% chance over 30 yrs
- Wildfire 8/10 Severe
- Heat 7/10 Severe 7 d/yr ≥98°F today · 21 d/yr by 30 yrs out
- Wind 1/10 Low
- Air quality 6/10 Major 9 unhealthy d/yr today · 13 by 30 yrs out
Nearby sold comps map
Loading sold comps map…
Walkable amenities ~0.75 mi
Loading nearby amenities…
Taxation est. · year 1
- Rental income
- $41,432
- − Mortgage interest
- −$19,605
- − Property taxes
- −$5,250
- − Insurance
- −$1,750
- − Repairs & maintenance
- −$3,315
- − Management
- −$3,315
- − Depreciation
- −$10,182
- Taxable loss
- −$1,985
- Est. tax savings @ 24.0%
- +$476
- After-tax cash flow
- $4,182/yr
For passive investors: Depreciation is non-cash, so a rental often shows a tax loss while cash-flowing — sheltering income. Rental losses are passive: they offset passive income freely, and up to $25,000/yr can offset ordinary (W-2) income if you actively participate and your MAGI is under $100k (phasing out to $0 by $150k); unused losses carry forward. On sale, claimed depreciation is recaptured at up to 25%, and gains may owe capital-gains tax (a 1031 exchange can defer both). Figures are a year-1 estimate at your 24.0% rate — not tax advice; consult a CPA.
Condition & rehab AI · 12 photos
This well-maintained manufactured home in Cordova Estates is move-in ready with a fresh exterior and interior. Minor updates to the exterior trim and flooring would significantly enhance its resale and rental value.
Value-add opportunities
- Both Paint exterior trim — Enhances curb appeal and value
- Both Replace carpet with hardwood — Improves aesthetics and value
- Both Replace kitchen appliances — Modernizes and increases value
Renovation cost estimate screening
Value-add ROI direction
- Both Paint exterior trim — Enhances curb appeal and value ↑
- Both Replace carpet with hardwood — Improves aesthetics and value ↑
- Both Replace kitchen appliances — Modernizes and increases value ↑
ⓘ Cost ranges are severity-bucket heuristics (US national rule-of-thumb). Get contractor quotes + a written scope before underwriting a rehab budget.
Schools (NCES district)
- District
- William S. Hart Union High
- NCES district ID
- 0642510
- Math proficiency
- 52% ▬ 0.00%
- Reading proficiency
- 72% ▲ 1.00%
- Median HH income
- $95,844
- Composite
- 58.6/100
- National rank
- #2030
- State rank
- #155 of 1400 in CA
Livability — Santa Clarita
- Score
- 70/100
- State rank
- #229
- US rank
- #7378
Category grades
Schools grade is shown separately in the Schools card above.
Census & demographics
- Census place
- Santa Clarita, CA
- County
- Los Angeles County · 9,444,647 people
- City population
- 219,066
- Metro
- Los Angeles-Long Beach-Anaheim, CA
- Population (ZIP)
- 33,155
- Household income
- $115,364
- Rent vs Own
- Severe rent burden
- 784.0
Population outlook (Los Angeles County) Hauer SSP2
- Today (2025)
- 10,940,515 people
- By 2030
- 11,256,481 · +2.9%
- By 2040
- 11,729,929 · +7.2%
- By 2050
- 11,948,407 · +9.2%
- By 2075
- 11,818,114 · +8.0%
- By 2100
- 10,842,928 · -0.9%
Race, ethnicity, and origin ACS 2023
- Neighborhood character
- Diverse neighborhood (Simpson 0.64)
- Race & ethnicity
- Hispanic / Latino 49% White 34% Two or more races 21% Asian 6% Black 4% Native American 1%
- Hispanic origin (detail)
- Mexican 36%
- Common ancestry
- Romanian 1% Lithuanian 1% Scotch-Irish 1%
- Foreign-born
- 23% · Canada, Jamaica, South Korea
- Languages at home
- 54% English-only · Spanish 35% Other Indo-European 3% Tagalog/Filipino 2%
Political lean MEDSL · Los Angeles
- 2024 margin
- Solid D (+32.9) · D 64.8% · R 31.9% · Other 3.3%
- 2008→2024 swing
- -7.4pp toward R · 2008: 40.4pp · 2024: 32.9pp
- All cycles
- 2024: D+32.9 2020: D+44.2 2016: D+48.0 2012: D+40.0 2008: D+40.4
Not yet ingested
- Civics
- —
Market trends
- HPI YoY
- ▼ -703.16%
- Current HPI
- 360.9901
- Rent YoY
- ▲ 1.70%
- Metro
- Los Angeles-Long Beach-Anaheim, CA
- State GDP YoY
- ▲ 3.21%
- F500 in state
- 116
Industry mix (Fortune 500 HQ in CA)
| Industry | F500 HQs | Revenue |
|---|---|---|
| Technology | 27 | $1,492B |
|
||
| Financial Services | 3 | $174B |
|
||
| Retail | 3 | $44B |
|
||
| Insurance | 3 | $26B |
|
||
| Media / Entertainment | 2 | $115B |
|
||
| Pharmaceuticals / Biotech | 2 | $62B |
|
||
Price history
1 event — show timeline
- 2026-04-18 Listed $350,000 CRMLS
Property tax history
+9.6%/yrLatest (2025): $342 · +9.6% YoY. Source: county tax records.
Cash-flow waterfall
monthlySold comps — $/sqft
last 12 mo · ≤1 miLoading sold comps…